Diagnostic Imaging Market (2026 - 2035)

Diagnostic Imaging Market Research Report By Technology (X-Ray, Ultrasound, Computed Tomography, Magnetic Resonance Imaging, Nuclear Imaging), By Application (Cardiology, Orthopedics, Oncology, Neurology, Gynecology), By End Use (Hospitals, Diagnostic Imaging Centers, Research Institutes, Ambulatory Surgical Centers), By Product Type (Standalone Imaging Systems, Software Solutions, Mobile Imaging Systems) and By Regional (North America, Europe, South America, Asia Pacific, Middle East and Africa) - Industry Forecast to 2035.
ID: MRFR/MED/5301-HCR
85 Pages
Rahul Gotadki, Kinjoll Dey
Last Updated: July 10, 2026
Diagnostic Imaging Market
Market Size
Forecast Period2026-2035
CAGR (2026-2035)4.80%
2025 Market SizeUSD 84.40 Billion
2035 Market SizeUSD 134.75 Billion
Key Players
GE HealthCare
Siemens Healthineers
Philips Healthcare
Canon Medical Systems
Fujifilm Healthcare
Hologic Inc.
Opportunities
  • AI-Powered Clinical Decision Support
  • Mobile and Handheld Imaging in Emerging Markets
  • Theranostics and Companion Diagnostic Imaging

Diagnostic Imaging Market Summary

The global Diagnostic Imaging Market reached an estimated USD 84.40 billion in 2025, propelled by aging populations, rising chronic disease burdens, and sustained hospital capital-expenditure cycles across developed and emerging economies. From a 2026 starting value of USD 88.41 billion, Market Research Future (MRFR) projects the Diagnostic Imaging Market will grow at a 4.80% CAGR through 2035, reaching USD 134.75 billion. Government mandates around early cancer detection — including the European Commission's Beating Cancer Plan targeting 90% breast-screening coverage by 2025 and CMS reimbursement expansions for low-dose CT lung screening in the United States — have anchored demand at scale [1][2].

Clinical sites are changing the way they buy and deploy imaging assets through a technology change. Digital flat-panel detectors and AI-integrated reconstruction engines are replacing film-based and analog radiography systems, which are decreasing scan durations by 30–50% and reducing radiation dose [3]. The next platform change for the Diagnostic Imaging Market is photon counting CT, which gathers spectral energy data in a single acquisition and drew over USD 1.2 billion in combined R&D spend across key OEMs between 2022 and 2025 [4].


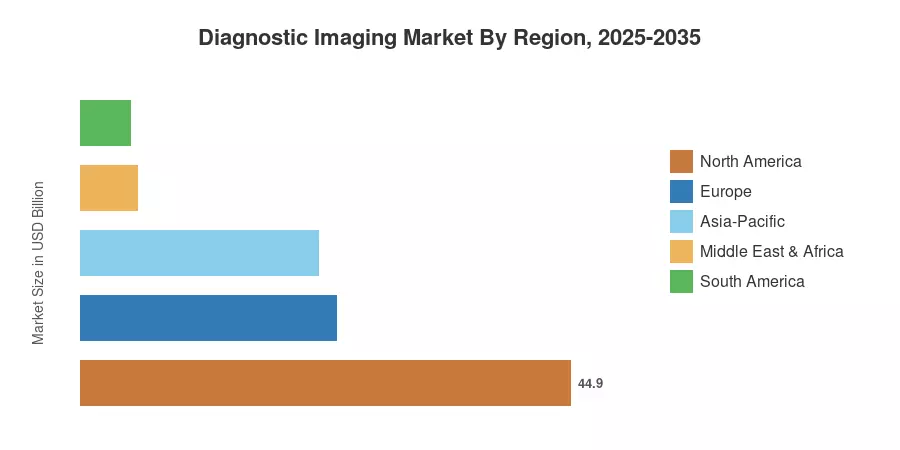
The revenue share of North America is 44.9%, driven by a dense installed base and the willingness of payers to reimburse sophisticated modalities. The Asia-Pacific area is the fastest expanding with a 5.9% CAGR led by government hospital development plans in India, China and Southeast Asia. Europe accounts for the second-largest proportion at 23.5%, as cross-border procurement procedures speed up equipment improvements. Diagnostic Imaging Market to grow at a steady mid-single-digit CAGR, driven by AI-enabled workflows and value-based reimbursement models changing site-of-care economics worldwide.


Key Report Takeaways

• By Modality

  • X-ray anchored the Diagnostic Imaging Market with a 27.1% revenue share in 2025, reflecting high-volume emergency and orthopedic use cases across hospital and outpatient settings.
  • Computed tomography is forecast to expand at a 6.8% CAGR through 2035, driven by photon-counting detector adoption and AI-assisted triage protocols.
  • MRI is projected to surpass USD 22.50 billion by 2035 as ultra-high-field and helium-free magnet designs lower lifecycle costs.

• By Application

  • Diagnostic applications accounted for 62.1% of the Diagnostic Imaging Market in 2025, spanning oncology, cardiology, and musculoskeletal evaluations.
  • Therapeutic and interventional imaging is set to post a 7.1% CAGR through 2035, fueled by image-guided surgery and minimally invasive procedures.

• By End User

  • Hospitals held 57.2% share in 2025, leveraging multimodality suites integrated with electronic health records.
  • Diagnostic imaging centers are the fastest-growing end-user segment at a 7.6% CAGR, as payers steer referrals toward lower-cost freestanding sites.

• By Geography

  • North America led the Diagnostic Imaging Market with a 44.9% share in 2025, supported by favorable reimbursement and technology-forward health systems.
  • Asia-Pacific is expanding at a 5.9% CAGR as China and India scale domestic manufacturing and tier-2 hospital procurement.


Diagnostic Imaging Market Size and Forecast (2021–2035)

The Market Research Future (MRFR) sizing methodology combines bottom-up device-shipment statistics with top-down revenue tracking by geography and modality. Historical figures (2021–2024) are based on audited OEM disclosures and trade-association data; projection values (2026–2035) are based on a calibrated 4.80% CAGR adjusted for macro-demographic and technology-adoption assumptions.
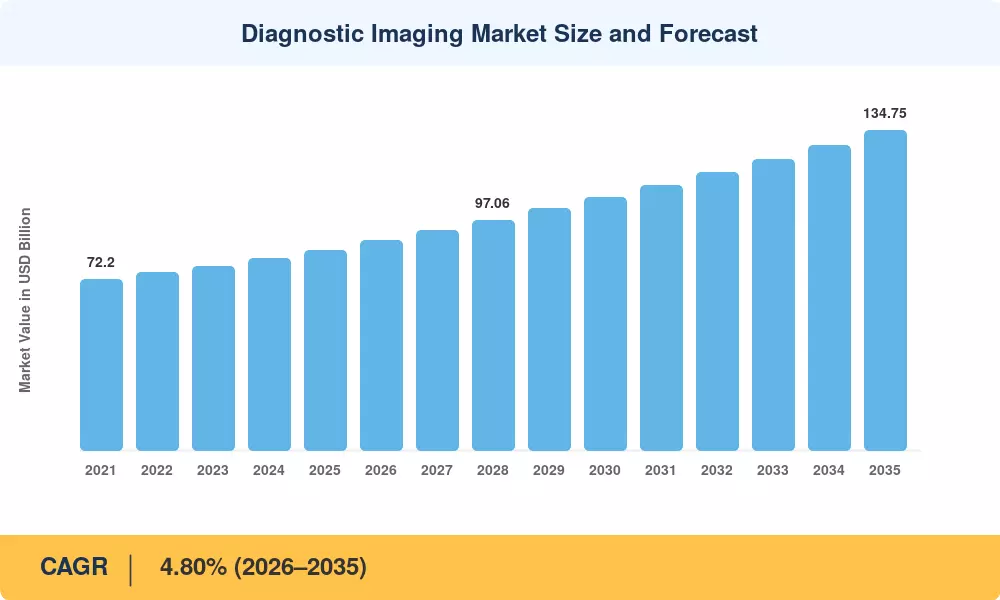
Diagnostic Imaging Market Size and Forecast
Our Impact
Enabled $4.3B Revenue Impact for Fortune 500 and Leading Multinationals
Partnering with 2000+ Global Organizations Each Year
30K+ Citations by Top-Tier Firms in the Industry

Driver Impact Analysis

Driver ~% Impact on CAGR Geographic Relevance Impact Timeline
Aging Population & Chronic Disease Burden +0.9% Global Long-term (≥4 yr)
AI/ML Integration in Image Reconstruction +0.8% North America, Europe Medium-term (2–4 yr)
Government Screening Mandates +0.6% Europe, Asia-Pacific Short-term (≤2 yr)
Photon-Counting Detector Commercialization +0.5% North America, Europe Medium-term (2–4 yr)
Outpatient Site-of-Service Shift +0.4% North America Short-term (≤2 yr)
Emerging-Market Hospital Expansion +0.5% Asia-Pacific, MEA Long-term (≥4 yr)
Portable and Point-of-Care Ultrasound +0.3% Global Medium-term (2–4 yr)


Aging Population and Chronic Disease Burden

The WHO estimates that adults aged 65 and older will double to 1.6 billion globally by 2050, sharply raising demand for cancer, cardiovascular, and neurological imaging [1]. In the United States alone, CMS projects Medicare imaging expenditures will grow 6–8% annually through 2030 as the baby-boomer cohort enters peak-utilization years, directly expanding the Diagnostic Imaging Market revenue base [7].

AI/ML Integration in Image Reconstruction

The FDA has cleared over 900 AI-enabled medical-device algorithms as of early 2025, with radiology accounting for roughly 75% of those clearances [6]. Deep-learning reconstruction reduces MRI scan times by up to 50% and CT noise by 40%, enabling higher patient throughput without additional hardware — a powerful economics driver for the Diagnostic Imaging Market [3].

Government Screening Mandates

The European Commission's Beating Cancer Plan requires member states to offer breast, cervical, and colorectal screening to 90% of eligible populations by 2025, creating procurement waves for mammography and CT colonography equipment [2]. India's Ayushman Bharat Digital Mission is similarly catalyzing radiology infrastructure in district hospitals, expanding addressable sites for the Diagnostic Imaging Market across tier-2 and tier-3 cities [8].


Restraints Impact Analysis

Restraint ~% Impact on CAGR Geographic Relevance Impact Timeline
High Capital and Maintenance Costs –0.6% Global Long-term (≥4 yr)
Radiation Safety Regulations –0.3% Europe, North America Medium-term (2–4 yr)
Skilled Workforce Shortages –0.4% Global Long-term (≥4 yr)
Reimbursement Compression –0.3% North America Short-term (≤2 yr)
Helium Supply Constraints for MRI –0.2% Global Medium-term (2–4 yr)


High Capital and Maintenance Costs

A premium 3T MRI system can cost USD 2.5–3.5 million before site preparation, with annual service contracts adding 8–12% of the purchase price [10]. These capital thresholds exclude many smaller health systems and delay upgrade cycles, tempering volume growth in the Diagnostic Imaging Market — particularly in price-sensitive markets across South America and the Middle East.

Skilled Workforce Shortages

The American Society of Radiologic Technologists reported a 15% vacancy rate for MRI technologists in 2024, mirroring similar shortfalls in the UK and Australia [12]. Staffing gaps limit scanner utilization rates and slow adoption of advanced modalities, constraining the pace at which the Diagnostic Imaging Market can monetize installed capacity.


Diagnostic Imaging Market Opportunities

AI-Powered Clinical Decision Support

Embedding AI triage algorithms directly into PACS and RIS platforms can reduce critical-finding turnaround by 30–45 minutes, creating a software-revenue layer on top of hardware sales [6]. Vendors that bundle decision-support subscriptions with device contracts stand to capture recurring revenue streams across the Diagnostic Imaging Market.

Mobile and Handheld Imaging in Emerging Markets

Handheld ultrasound devices priced below USD 5,000 are opening primary-care screening markets in Sub-Saharan Africa and rural Southeast Asia [9]. These devices bypass traditional capital-procurement barriers and expand the addressable Diagnostic Imaging Market by reaching populations that lack access to fixed-site radiology.

Theranostics and Companion Diagnostic Imaging

The convergence of PET imaging with radiopharmaceutical therapeutics — exemplified by lutetium-177 PSMA therapy — creates a companion-imaging requirement that sustains per-patient scan volumes [14]. This application linkage positions the Diagnostic Imaging Market for structural demand growth tied to precision-oncology pipelines.

Cloud-Based Image Analytics and Data Monetization

Cloud PACS platforms that aggregate de-identified imaging datasets enable secondary revenue through algorithm training and population-health analytics [15]. Health systems that monetize imaging data through federated-learning partnerships introduce new business models to the Diagnostic Imaging Market without compromising patient privacy.

Outpatient Imaging Center Expansion

Payer-driven site-of-service redirection is shifting 18–22% of advanced imaging volume from hospital outpatient departments to freestanding centers in the United States [7]. This structural shift creates greenfield procurement opportunities and faster equipment-replacement cycles for the Diagnostic Imaging Market.


Diagnostic Imaging Market Future Outlook

AI-Autonomous Imaging Workflows

By 2030, fully automated scan-protocol selection and post-processing will be standard on premium CT and MRI platforms, reducing radiologist read time by up to 40% [6]. The Diagnostic Imaging Market will shift toward software-subscription revenue models as hardware becomes the delivery vehicle for AI capabilities rather than the primary value driver.

Precision Medicine and Molecular Imaging Convergence

The growth of theranostics — particularly in prostate and neuroendocrine cancers — will lock PET/CT into oncology treatment pathways, raising per-patient imaging intensity [14]. This linkage ensures the Diagnostic Imaging Market benefits from every approved radiopharmaceutical therapeutic, not just standalone diagnostic volume.

Sustainability and Green Imaging Initiatives

Helium-free MRI magnets and low-power digital detectors will reduce imaging's carbon footprint by an estimated 20–30% per scan by 2032 [13]. ESG-aligned hospital procurement policies in Europe and North America will favor OEMs that demonstrate lifecycle environmental performance, reshaping competitive positioning within the Diagnostic Imaging Market.

Platform Economics and As-a-Service Models

Pay-per-scan and managed-equipment-service contracts are emerging as alternatives to outright capital purchase, lowering adoption barriers for mid-tier hospitals and ambulatory centers [10]. These platform models will expand the addressable Diagnostic Imaging Market by converting deferred purchases into operational expenditure commitments.


Diagnostic Imaging Market Segmentation

By Modality

Segment Key Metric Primary Demand Driver
X-Ray 27.1% share (2025) Emergency and orthopedic high-volume screening
Computed Tomography CAGR 6.8% AI-assisted detection, photon-counting upgrades
MRI USD 22.50 Billion (2035) Neurological and musculoskeletal diagnostics
Ultrasound CAGR 5.4% Point-of-care and portable device adoption
Others (PET, SPECT, Mammography) 14.2% share (2025) Oncology staging and theranostics


X-ray remains the volume workhorse of the Diagnostic Imaging Market, deployed across virtually every emergency department, orthopedic clinic, and dental practice worldwide. Flat-panel digital detectors have replaced computed radiography cassettes in most developed markets, improving image quality while reducing dose. Computed tomography is the fastest-expanding modality as photon-counting detectors transition from premium research installations to mainstream clinical platforms, delivering spectral data without dual-scan protocols [4].

MRI growth in the Diagnostic Imaging Market is driven by expanding clinical indications in neurology, cardiac imaging, and breast screening. Helium-free magnet technology from multiple OEMs is lowering the total cost of ownership, broadening the addressable buyer base to community hospitals and outpatient centers [13].

By Application

Segment Key Metric Primary Demand Driver
Diagnostic Imaging 62.1% share (2025) Cancer screening, cardiology, musculoskeletal evaluation
Therapeutic & Interventional CAGR 7.1% Image-guided surgery, minimally invasive procedures
Research & Clinical Trials USD 4.80 Billion (2025) Pharmaceutical imaging endpoints, biomarker validation


Diagnostic applications dominate the Diagnostic Imaging Market because screening, staging, and surveillance imaging generate the highest procedure volumes across all clinical specialties. Therapeutic and interventional imaging is growing faster as hybrid operating rooms and catheterization labs integrate real-time fluoroscopy and cone-beam CT into procedural workflows.

By End User

Segment Key Metric Primary Demand Driver
Hospitals 57.2% share (2025) Multi-modality suites, 24/7 emergency access
Diagnostic Imaging Centers CAGR 7.6% Payer site-of-service steering, lower facility costs
Others (Clinics, Research Labs) USD 6.90 Billion (2025) Specialty clinics, academic research


Hospitals remain the dominant end user in the Diagnostic Imaging Market thanks to their ability to finance premium equipment and link imaging revenue to procedural service lines. Diagnostic imaging centers are gaining share rapidly as commercial payers and Medicare Advantage plans incentivize outpatient utilization through differential reimbursement and prior-authorization pathways [7].


Regional Market Share Analysis

Region 2025 Share (%) Primary Investment Themes
North America 44.9 AI integration, replacement cycles, outpatient shift
Europe 23.5 Cross-border procurement, dose-reduction mandates
Asia-Pacific 21.8 Hospital construction, domestic OEM scaling
South America 4.6 Public-health infrastructure, refurbished equipment
Middle East & Africa 5.2 PPP hospital projects, mobile imaging
Total 100.0

The Diagnostic Imaging Market spans five major regions, each shaped by distinct reimbursement structures, regulatory environments, and demographic trajectories.


North America

Country Key Metric Key Driver
United States 82.3% of regional share Medicare reimbursement expansion
Canada CAGR 4.3% Provincial health authority upgrade programs
Mexico USD 1.95 Billion (2025) IMSS hospital modernization


The United States anchors the Diagnostic Imaging Market in North America through a combination of high per-capita imaging utilization, technology-forward academic medical centers, and robust commercial-payer coverage. CMS's 2024 physician-fee-schedule update preserved favorable technical-component reimbursement for CT and MRI, sustaining capital-investment confidence [7].

Europe

Country Key Metric Key Driver
Germany 24.8% of regional share University hospital procurement
United Kingdom CAGR 4.5% NHS diagnostic-capacity recovery
France USD 3.10 Billion (2025) National cancer-screening mandates
Italy CAGR 4.1% EU Recovery Fund allocations
Spain 8.2% of regional share Regional health-service expansion
Nordic Countries CAGR 4.6% AI-first imaging strategies
Russia USD 1.15 Billion (2025) Import-substitution programs
Rest of Europe 14.5% of regional share EU Cohesion Fund investments


The UK's NHS committed GBP 2.3 billion to its Community Diagnostic Centre program through 2025, directly expanding the Diagnostic Imaging Market footprint outside traditional hospital settings [16]. Germany and France continue to lead continental demand through university-hospital capital budgets and government screening mandates.

Asia-Pacific

Country Key Metric Key Driver
China 38.5% of regional share Domestic OEM scale-up, county-hospital programs
India CAGR 7.2% Ayushman Bharat infrastructure expansion
Japan USD 4.25 Billion (2025) Aging demographics, technology refresh
South Korea CAGR 5.8% National Health Insurance coverage is broadening
ASEAN 12.6% of regional share PPP hospital projects
Rest of Asia-Pacific CAGR 5.1% Medical tourism investment


China's 14th Five-Year Plan allocated over CNY 200 billion to county-level hospital upgrades, creating a procurement pipeline for mid-range CT and ultrasound systems from domestic manufacturers such as Mindray and United Imaging [8]. India's Diagnostic Imaging Market is accelerating as the Ayushman Bharat Digital Mission links 150,000+ health facilities to a national health-information exchange that requires digitized imaging.

South America

Country Key Metric Key Driver
Brazil 58.4% of regional share SUS public-health network expansion
Argentina CAGR 4.0% Private-clinic modernization
Rest of South America USD 0.68 Billion (2025) IDB-financed hospital projects


Brazil's Unified Health System continues to procure digital X-ray and ultrasound systems for primary-care units, sustaining baseline volume growth in the regional Diagnostic Imaging Market. Refurbished equipment channels account for an estimated 25–30% of installed capacity in the region [10].

Middle East & Africa

Country Key Metric Key Driver
Saudi Arabia 31.5% of regional share Vision 2030 healthcare investment
UAE CAGR 5.6% Medical-tourism hub strategy
South Africa USD 0.62 Billion (2025) National Health Insurance pilot
Egypt CAGR 5.3% Universal health-coverage reform
Rest of MEA 22.8% of regional share NGO and donor-funded programs


Saudi Arabia's Vision 2030 earmarked over USD 65 billion for health-sector transformation, including 20 new hospitals requiring full imaging-suite commissioning [17]. These mega-projects are a direct growth lever for the Diagnostic Imaging Market across the Gulf Cooperation Council states.


Diagnostic Imaging Market By Region, 2025-2035

Competitive Benchmarking

The Diagnostic Imaging Market is moderately concentrated, with the top five companies anticipated to hold a combined revenue share of 55-65%. The Herfindahl-Hirschman Index is in the moderate range (~1,200-1,500) and is an oligopoly of established multinationals with an increasing number of mid-tier and regional competitors. In the value segment, price pressure from Chinese manufacturers is increasing, while differentiation through AI software is changing the premium-tier positioning.

Company Est. Revenue Share Range Key Offerings for the Diagnostic Imaging Market Strategic Positioning
GE HealthCare ~14–18% Revolution CT, SIGNA MRI, AI Edison platform Broadest modality portfolio, strong service network
Siemens Healthineers ~14–17% NAEOTOM Alpha photon-counting CT, MAGNETOM MRI Technology leader in spectral CT, digital twin imaging
Philips Healthcare ~10–13% Spectral CT 7500, SmartSpeed MRI, Lumify ultrasound AI-first workflow integration, ambulatory focus
Canon Medical Systems ~6–9% Aquilion CT, Vantage MRI, Aplio ultrasound Deep-learning reconstruction, mid-price positioning
Fujifilm Healthcare ~5–8% FDR digital radiography, Echelon MRI Digital X-ray leadership, post-Hitachi portfolio integration
Hologic Inc. ~3–5% Genius 3D mammography, Brevera biopsy system Breast-health specialization, screening dominance
Shimadzu Corporation ~2–4% RADspeed digital radiography, Trinias angiography Fluoroscopy and angiography niche, Japan-centric
Mindray Medical ~2–4% Resona ultrasound, digital radiography systems Cost-competitive positioning, emerging-market distribution
Samsung Electronics ~2–3% V8 and HS70A ultrasound, GM85 digital radiography Portable and point-of-care ultrasound focus
Carestream Health ~1–3% DRX digital X-ray, Vue PACS Imaging IT and workflow solutions


Recent News & Developments

  • GE HealthCare (December 2021): Launched the Revolution Apex CT platform featuring a deep-learning image-reconstruction engine designed to cut scan times by 40% [18].
  • Siemens Healthineers (September 2021): Received expanded FDA clearance for NAEOTOM Alpha photon-counting CT across cardiac and oncology indications, reinforcing its technology lead in the Diagnostic Imaging Market [19].


  • Fujifilm Healthcare (July 2021): Completed integration of Hitachi's diagnostic imaging business, adding MRI and CT modalities to its portfolio and expanding its Diagnostic Imaging Market footprint [21].


Diagnostic Imaging Market Report Scope

Parameter Detail
Market Scope Global Diagnostic Imaging Market covering devices, software, and services
Study Period 2021–2035
CAGR (Forecast) 4.80% (2026–2035)
Base Year Market Size USD 84.40 Billion (2025)
Forecast End Market Size USD 134.75 Billion (2035)
Fastest Growing Modality Computed Tomography (6.8% CAGR)
Fastest Growing End User Diagnostic Imaging Centers (7.6% CAGR)
Companies Profiled 10 major players
Valuation Currency USD Billion


FAQs

What ROI timeline should hospitals expect when investing in the Diagnostic Imaging Market?
Most hospitals recover capital costs within 4–6 years through increased throughput and fewer repeat scans. AI-assisted triage can shorten payback by 15–20% [10].
How does AI integration affect radiology staffing models?
AI reduces manual annotation but increases demand for informatics-trained technologists. Departments typically reallocate staff toward quality assurance rather than eliminating positions [6].
What cybersecurity risks do networked systems in the Diagnostic Imaging Market face?
Connected devices expand attack surfaces through DICOM and HL7 interfaces. Zero-trust network segmentation and encrypted data transfer are essential safeguards [11].
How do refurbished imaging systems compare to new equipment for smaller clinics?
Refurbished systems cost 40–60% less and suit low-volume facilities. Buyers should verify OEM certification and software update eligibility before purchase [10].
What role does 3D printing play alongside diagnostic imaging workflows?
3D printing converts CT and MRI data into surgical guides and anatomical models. The workflow depends on DICOM-compatible segmentation software [14].
How are value-based care models reshaping procurement in the Diagnostic Imaging Market?
Value-based reimbursement rewards appropriate utilization over volume. Imaging departments increasingly adopt clinical-decision-support tools to guide evidence-based ordering [7].
What interoperability standards matter most for imaging platform selection?
Buyers should prioritize DICOM, IHE profiles, and FHIR-compatible systems. These standards enable seamless data exchange with EHRs and analytics platforms [15].    
What is the current size of the diagnostic imaging market?
The diagnostic imaging market reached USD 84.40 billion in 2025 and is projected to reach USD 134.75 billion by 2035.
What is the CAGR of the diagnostic imaging market?
The diagnostic imaging market is projected to grow at a CAGR of 4.80% during the forecast period 2026–2035.
Which region leads the diagnostic imaging market?
North America holds the largest share at 44.9%, while Asia-Pacific is the fastest-growing region at 5.9% CAGR.
Author
Author
Author Profile
Rahul Gotadki LinkedIn
Research Manager
He holds an experience of about 9+ years in Market Research and Business Consulting, working under the spectrum of Life Sciences and Healthcare domains. Rahul conceptualizes and implements a scalable business strategy and provides strategic leadership to the clients. His expertise lies in market estimation, competitive intelligence, pipeline analysis, customer assessment, etc.
Co-Author
Co-Author Profile
Kinjoll Dey LinkedIn
Senior Research Analyst
He is an extremely curious individual currently working in Healthcare and Medical Devices Domain. Kinjoll is comfortably versed in data centric research backed by healthcare educational background. He leverages extensive data mining and analytics tools such as Primary and Secondary Research, Statistical Analysis, Machine Learning, Data Modelling. His key role also involves Technical Sales Support, Client Interaction and Project management within the Healthcare team. Lastly, he showcases extensive affinity towards learning new skills and remain fascinated in implementing them.

Research Approach


Secondary Research

The secondary research process involved comprehensive analysis of regulatory databases for medical devices, peer-reviewed radiology journals, clinical imaging publications, and authoritative health technology organizations. Key sources included the US Food & Drug Administration (FDA) Center for Devices and Radiological Health (CDRH) 510(k) and PMA databases, European Medicines Agency (EMA) medical device regulations, International Medical Device Regulators Forum (IMDRF), Radiological Society of North America (RSNA), European Society of Radiology (ESR), American College of Radiology (ACR), American Institute of Ultrasound in Medicine (AIUM), Society of Nuclear Medicine and Molecular Imaging (SNMMI), American Association of Physicists in Medicine (AAPM), National Institutes of Health (NIH) Imaging Research Program, National Center for Biotechnology Information (NCBI/PubMed) for radiology studies, Centers for Medicare & Medicaid Services (CMS) procedure coding and reimbursement data, OECD Health Statistics, World Health Organization (WHO) Medical Device Information System, World Bank Health Indicators, and national regulatory authorities including Japan PMDA, China NMPA, Health Canada, and Australia's TGA.

These sources were employed to gather data on the volumes of imaging procedures, regulatory approval pathways for Class II/III diagnostic devices, clinical safety studies on radiation exposure and contrast agents, equipment installation census data, and technology landscape analysis for computed tomography, magnetic resonance imaging, ultrasound systems, X-ray modalities, and nuclear medicine platforms.


Primary Research

Supply-side and demand-side stakeholders were interviewed during the primary research process to acquire qualitative and quantitative insights regarding procurement cycles, technology adoption patterns, and replacement dynamics. The supply-side sources consulted were CEOs, Presidents of Imaging Divisions, VPs of Engineering and R&D, global regulatory affairs chiefs, and commercial directors from diagnostic imaging equipment manufacturers (OEMs) and component suppliers. Demand-side sources included chief of radiology departments, board-certified radiologists, hospital C-suite executives (CIOs/CMOs), clinical engineers, procurement directors from integrated delivery networks (IDNs), independent diagnostic imaging center operators, and outpatient facility administrators. The primary research validated market segmentation across imaging modalities, confirmed product upgrade and replacement timelines, and gathered insights on slice-count preferences for CT, tesla-strength trends for MRI, point-of-care ultrasound adoption, AI-integration pricing premiums, and value-based imaging reimbursement dynamics.

Primary Respondent Breakdown:

By Designation: C-level Primaries (32%), Director Level (30%), Others (38%)

By Region: North America (32%), Europe (30%), Asia-Pacific (28%), Rest of World (10%)


Market Size Estimation

The global market valuation was determined by analyzing new equipment procurement, replacement cycle modeling, and installed base mapping. The methodology comprised the following:

Identification of over 50 prominent manufacturers of imaging equipment in North America, Europe, Asia-Pacific, Latin America, and the Middle East and Africa

X-ray systems (digital radiography, fluoroscopy, mammography), computed tomography (16-slice to 512+ slice), magnetic resonance imaging (1.5T to 7T), ultrasound (cart-based and portable), and nuclear medicine (SPECT, PET, hybrid systems): product mapping

A review of the reported annual revenues and unit shipments that are specific to diagnostic imaging portfolios, including imaging software and service contracts

Manufacturers that account for 75-80% of the global market share in 2024 are included in the coverage.

Segment-specific valuations by modality, application area, and end-user facility type are derived through extrapolation using bottom-up (installed base × maintenance contracts + new unit sales × ASP by country/region) and top-down (manufacturer revenue validation and service revenue modeling) approaches.

Download Free Sample

Kindly complete the form below to receive a free sample of this Report

Download PDF ×

We do not share your information with anyone. However, we may send you emails based on your report interest from time to time. You may contact us at any time to opt-out.
















