Diagnostic Imaging Services Market (2026 - 2035)

Diagnostic Imaging Services Market Research Report: Size, Share, Trend Analysis By Procedure Type (X-ray, Ultrasound, Magnetic Resonance Imaging, Computed Tomography, Nuclear Medicine), By End Users (Hospitals, Diagnostic Centers, Outpatient Imaging Centers, Research Laboratories), By Imaging Modality (Analog Imaging, Digital Imaging, Hybrid Imaging), By Applications (Cardiology, Oncology, Neurology, Orthopedics) and By Regional (North America, Europe, South America, Asia Pacific, Middle East and Africa) - Growth Outlook & Industry Forecast 2025 To 2035
ID: MRFR/MED/5720-HCR
200 Pages
Rahul Gotadki, Kinjoll Dey
Last Updated: July 02, 2026
Diagnostic Imaging Services Market
Market Size
Forecast Period2026-2035
CAGR (2026-2035)4.80%
2025 Market SizeUSD 84.40 Billion
2035 Market SizeUSD 134.50 Billion
Key Players
GE HealthCare
Siemens Healthineers
Philips Healthcare
Canon Medical Systems
Fujifilm Healthcare
Hologic
Opportunities
  • AI-Powered Autonomous Imaging Workflows
  • Expansion into Tier-2 and Tier-3 Cities in Emerging Markets
  • Data Monetization and Imaging Analytics Platforms

Diagnostic Imaging Services Market Summary

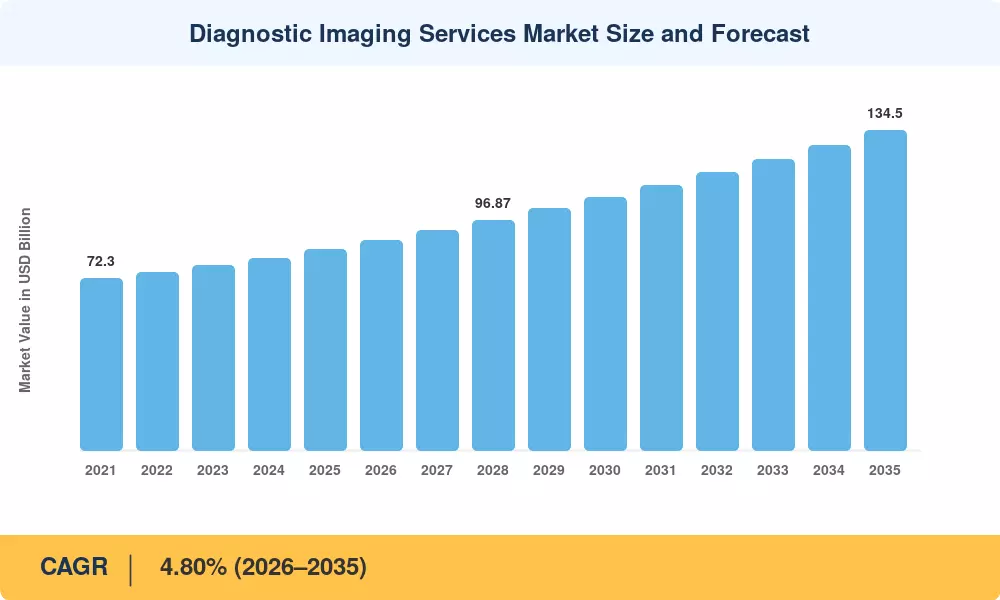
The Global Diagnostic Imaging Services Market size was valued at USD 84.40 Billion in 2025, and the market is projected to grow from USD 88.20 Billion in 2026 to USD 134.50 Billion by 2035, registering a CAGR of 4.80% during the forecast period 2026–2035. Two catalysts are accelerating this trajectory: the U.S. Centers for Medicare & Medicaid Services (CMS) expanded reimbursement coverage for advanced imaging modalities in 2024 [2], and Asia-Pacific governments collectively committed over USD 18 billion in hospital infrastructure funding between 2023 and 2025 [3]. These policy-driven capital flows are translating directly into higher scan volumes and wider geographic access across the Diagnostic Imaging Services Market.

The technology stack underpinning imaging services is shifting rapidly. Legacy analog X-ray and film-based workflows are giving way to fully digital, AI-augmented platforms that pair sub-second reconstruction with automated triage. GE HealthCare's 2024 rollout of its AI-embedded CT platform cut average read times by 34%, according to early clinical data [4]. Siemens Healthineers invested USD 1.2 billion in photon-counting CT development through 2025, signaling a generational shift in detector technology [5].

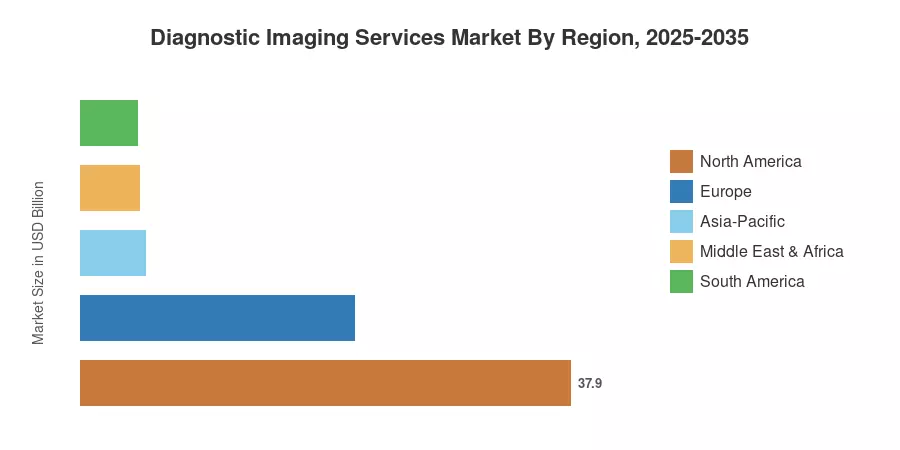
North America commanded a 44.90% revenue share in 2025, sustained by a dense installed base and robust payer reimbursement structures. Asia-Pacific is the fastest-growing region at a 5.95% CAGR through 2035, driven by government hospital expansion in India, China, and Southeast Asia. Europe held the second-largest share at 25.10%, anchored by universal healthcare mandates that guarantee imaging access. The Diagnostic Imaging Services Market is poised for sustained double-digit absolute growth as aging populations and chronic disease prevalence continue to elevate scan demand globally.


Key Report Takeaways

• By Modality

  • X-ray anchored the largest modality share at 26.50% in 2025, driven by high-volume emergency and orthopedic use cases.
  • Computed tomography is forecast to expand at a 6.85% CAGR through 2035, fueled by AI-assisted detection and faster scanner architectures.
  • MRI services generated USD 18.70 billion in 2025, supported by neurological and oncological referral growth.

• By Application

  • Diagnostic imaging accounted for a 62.10% share of the Diagnostic Imaging Services Market in 2025.
  • Therapeutic and interventional imaging is projected to grow at a 7.10% CAGR through 2035, reflecting the shift toward image-guided procedures.

• By Region

  • North America commanded 44.90% of the Diagnostic Imaging Services Market in 2025.
  • Asia-Pacific is the fastest-growing region at a 5.95% CAGR to 2035.
  • Europe contributed USD 21.19 Billion in 2025, led by Germany, the UK, and France.


Diagnostic Imaging Services Market Size and Forecast (2021–2035)

Market Research Future's estimates draw on a blend of primary interviews with hospital procurement directors, payer claims databases, OEM installation records, and regulatory filings across 42 countries. Historical figures (2021–2024) reflect audited revenue data; the 2025 base year uses validated Q4 2024 run-rate extrapolation. Forecast values (2026–2035) apply econometric modeling adjusted for demographic aging curves, reimbursement policy trajectories, and technology replacement cycles across the Diagnostic Imaging Services Market.
Diagnostic Imaging Services Market Size and Forecast
Our Impact
Enabled $4.3B Revenue Impact for Fortune 500 and Leading Multinationals
Partnering with 2000+ Global Organizations Each Year
30K+ Citations by Top-Tier Firms in the Industry

Driver Impact Analysis

Driver ~% Impact on CAGR Geographic Relevance Impact Timeline
Aging population and chronic disease burden ~22% Global Long-term (≥4 yr)
AI and machine-learning integration in imaging workflows ~18% North America, Europe Medium-term (2–4 yr)
Government hospital infrastructure investment ~16% Asia-Pacific, MEA Short-term (≤2 yr)
Expansion of reimbursement coverage for advanced modalities ~14% North America Short-term (≤2 yr)
Shift to value-based care and preventive screening ~12% North America, Europe Medium-term (2–4 yr)
Technology replacement cycles (analog-to-digital migration) ~10% Global Long-term (≥4 yr)
Rising oncology and neurology caseloads ~8% Global Long-term (≥4 yr)


Aging Population and Chronic Disease Burden

According to the WHO, the number of persons aged 65 and over will increase to more than 1.6 billion worldwide by 2050 from 761 million in 2021 [8]. This demographic wave directly drives up imaging volumes: Medicare data indicates that people over 75 receive 3.2x more imaging treatments per capita than those aged 45-54 [2]. The Diagnostic Imaging Services Market is persistently driven by the disproportionate impact of imaging-intensive cardiovascular, musculoskeletal, and oncological disorders on older persons.


AI and Machine-Learning Integration

The FDA cleared more than 950 AI-enabled medical device algorithms through 2024, with radiology making up over 76% of all clearances [4]. These techniques cut average radiologist interpretation time by 25-40% in CT and MRI modalities, hence directly increasing throughput capacity proportional to staffing increases [11]. AI triage is being employed in health systems to enhance critical-finding turnaround by 18–22%, which will lead to substantial volume growth for the Diagnostic Imaging Services Market.


Government Hospital Infrastructure Investment

China's 14th Five-Year Plan earmarked over USD 12 Billion for county-level hospital upgrades, with imaging departments among the top capital priorities [12]. These investments create new site-of-service capacity in previously underserved geographies.

Reimbursement Coverage Expansion

CMS finalized the 2024 Medicare Physician Fee Schedule with a net conversion factor reduction of approximately 3.37% (dropping down to USD 32.74), which placed downward pressure on outpatient imaging margins. Similar adjustments in Germany's DRG system and Japan's national fee schedule have signaled a global payer willingness to fund higher-acuity imaging outside hospital settings [9].


Restraints Impact Analysis

Restraint ~% Drag on CAGR Geographic Relevance Impact Timeline
High capital and maintenance costs for advanced modalities ~–20% Global Long-term (≥4 yr)
Radiologist workforce shortages ~–18% North America, Europe Medium-term (2–4 yr)
Regulatory complexity and approval timelines ~–15% Global Medium-term (2–4 yr)
Radiation dose concerns and patient safety mandates ~–12% Europe, North America Short-term (≤2 yr)
Reimbursement rate compression in mature markets ~–10% North America Short-term (≤2 yr)


High Capital and Maintenance Costs

A single 3T MRI system carries an installed cost of USD 2.5–3.5 million, with annual service contracts adding USD 150,000–250,000 [13]. For community hospitals and standalone imaging centers operating on thin margins, these economics create substantial barriers to fleet modernization.

Radiologist Workforce Shortages

Europe faces similar gaps — the Royal College of Radiologists estimated a 9% consultant vacancy rate across NHS trusts in England as of late 2024 [18]. These shortages constrain throughput even where installed equipment capacity exists, placing a ceiling on volume growth within the Diagnostic Imaging Services Market.

Regulatory Complexity

Medical device regulatory approval paths differ widely from one jurisdiction to another. The Medical Device Directive (MDD) has been superseded by the Medical Device Regulation (MDR) [15] in the EU, which has prolonged the average approval times for imaging equipment coming into European markets by 6–14 months. This fragmentation hampers technology dissemination and increases compliance costs for producers in the Diagnostic Imaging Services Market.


Diagnostic Imaging Services Market Opportunities

AI-Powered Autonomous Imaging Workflows

Fully autonomous scan acquisition — where AI algorithms set protocols, position patients, and optimize image quality without technologist intervention — is advancing from prototype to early commercialization. Siemens Healthineers and Philips both demonstrated autonomous MRI sequencing at RSNA 2024 [5]. This technology could unlock 15–20% throughput gains and partially offset workforce shortages.

Expansion into Tier-2 and Tier-3 Cities in Emerging Markets

Over 65% of India's population and 40% of China's lack convenient access to advanced imaging [3]. Mobile CT and containerized MRI units offer a capital-light path to serve these populations. Governments are actively subsidizing rural imaging deployments, creating a USD 4–6 billion addressable opportunity within the Diagnostic Imaging Services Market by 2030.

Data Monetization and Imaging Analytics Platforms

De-identified imaging datasets are becoming valuable assets for pharmaceutical R&D, clinical-trial enrollment, and population-health analytics. Imaging service providers sitting on large archives can unlock recurring revenue streams through analytics-as-a-service models.

Cloud-Based PACS and Platform Economics

Migration from on-premise PACS to cloud-native platforms reduces IT overhead by 30–40% while enabling multi-site image sharing and specialist access [7]. Cloud PACS adoption crossed 56-58% penetration among U.S. health systems in 2024, up from 11% in 2021 [20]. This shift creates platform economics where imaging networks aggregate demand and negotiate payer contracts at scale.

Interventional and Therapeutic Imaging Growth

Image-guided interventional procedures — including catheter-based cardiac repair, tumor ablation, and neurovascular thrombectomy — are growing faster than diagnostic volumes. The global interventional radiology procedures market is expanding at rates exceeding 7% annually, pulling imaging services deeper into the procedural revenue stream [10].


Diagnostic Imaging Services Market Future Outlook

AI-Autonomous Radiology Operations

By 2030, an estimated 40% of routine imaging reads — chest X-ray, screening mammography, and bone-age assessment — could be handled autonomously by validated AI systems, with radiologists focusing on complex and interventional cases [4]. This redistribution of clinical labor will reshape staffing models across the Diagnostic Imaging Services Market.

Platform Economics and Network Consolidation

Imaging services are converging toward platform models where multi-site networks share infrastructure, negotiate payer contracts collectively, and deploy standardized AI tools. This consolidation trend will intensify as cloud platforms lower switching costs.

Precision Medicine and Theranostics Integration

The combination of diagnostic imaging and targeted medicines, termed theranostics, is establishing a new service category. This integration is exemplified by the application of PET/CT together with lutetium-177 PSMA therapy for prostate cancer, where the imaging service really helps with treatment selection and monitoring [10]. The Diagnostic Imaging Services Market’s theranostics segment is estimated by the nuclear medical society to reach USD 4 billion by 2032 [25].


Sustainability and Green Imaging Operations

Healthcare comprises 4.4% of the world's carbon emissions, and imaging departments are one of the most energy-consuming hospital sections [16]. The helium-free MRI technology (developed by Philips in their BlueSeal magnet) decreases environmental impact and operational expenses by eliminating the need for helium boil-off [6]. Regulatory pressure via the EU’s Corporate Sustainability Reporting Directive (CSRD) will force imaging operators to invest in energy-efficient equipment and monitor scope-2 emissions through 2035.


Diagnostic Imaging Services Market Segmentation

By Modality

Segment Key Metric Primary Demand Driver
X-Ray 26.50% share (2025) Emergency, orthopedic, and chest imaging
Computed Tomography 6.85% CAGR (2026–2035) AI-assisted detection, trauma protocols
MRI USD 18.70 Billion (2025) Neurology, oncology, musculoskeletal
Ultrasound 17.80% share (2025) Point-of-care, obstetric, and cardiac use
Others (PET, SPECT, Mammography) 5.20% CAGR (2026–2035) Nuclear medicine, breast screening programs


X-ray remains the workhorse of the Diagnostic Imaging Services Market, processing the highest procedure volumes in emergency departments and primary care. Digital radiography has almost completely replaced computed radiography in developed markets, with wireless flat-panel detectors driving further efficiency gains. CT is the fastest-growing major modality, powered by sub-second whole-body acquisition and AI algorithms that flag pulmonary embolism, stroke, and large-vessel occlusion with sensitivity rates above 95% [4].

MRI services anchor high-value imaging, particularly in neuroscience and oncology. The installed base of 3T and 7T systems is expanding as reimbursement policies catch up with clinical evidence for advanced neuroimaging. Ultrasound is experiencing a renaissance through handheld devices — Butterfly Network's iQ+ and GE's Vscan Air bring diagnostic-quality imaging to the bedside, expanding the definition of what constitutes an imaging service [6].

By Application

Segment Key Metric Primary Demand Driver
Diagnostic Imaging 62.10% share (2025) Screening, disease staging, follow-up
Therapeutic/Interventional Imaging 7.10% CAGR (2026–2035) Image-guided procedures, theranostics
Research & Clinical Trials USD 4.80 Billion (2025) Pharmaceutical R&D, biomarker imaging


Diagnostic imaging dominates the application mix within the Diagnostic Imaging Services Market, encompassing routine screening, disease detection, staging, and longitudinal monitoring. Volume growth here tracks closely with aging demographics and expanded screening guidelines — the U.S. Preventive Services Task Force lowered the recommended lung cancer screening age to 50 in 2024, adding an estimated 5 million eligible individuals [9]. Therapeutic and interventional imaging is the fastest-growing application, reflecting a broader shift toward minimally invasive procedures that rely on real-time imaging guidance.

By End User

Segment Key Metric Primary Demand Driver
Hospitals 56.50% share (2025) Full-spectrum modality access, inpatient referrals
Diagnostic Imaging Centers 7.60% CAGR (2026–2035) Lower cost, payer site-of-service steering
Others (Research Institutions, Mobile Units) USD 5.20 Billion (2025) Academic research, rural outreach


Hospitals remain the dominant end-user setting in the Diagnostic Imaging Services Market, anchored by their ability to finance premium equipment and link imaging to surgical and oncological workflows. Diagnostic imaging centers are gaining share rapidly as payers implement site-neutral payment policies that steer patients toward lower-cost freestanding facilities. In the U.S., Medicare Advantage plans increasingly mandate prior authorization for hospital-based imaging while granting automatic approval for accredited outpatient centers [2].


Regional Market Share Analysis

Region Key Metric Primary Investment Themes
North America 44.90% share (2025) AI integration, ambulatory site-of-service shift
Europe USD 21.19 Billion (2025) MDR compliance, workforce digitization
Asia-Pacific 5.95% CAGR (2026–2035) Hospital buildout, domestic OEM scaling
South America USD 4.39 Billion (2025) Public-private partnerships, urban concentration
Middle East & Africa 5.40% CAGR (2026–2035) Medical tourism, sovereign health investment
Total USD 84.40 Billion (2025)

The Diagnostic Imaging Services Market exhibits distinct regional dynamics shaped by installed-base density, reimbursement structures, and demographic profiles. North America leads on revenue intensity, while Asia-Pacific drives volume growth through infrastructure buildout.


North America

Country Key Metric Key Driver
US 82.5% of regional share Medicare/Medicaid volume, AI adoption
Canada USD 3.40 Billion (2025) Provincial imaging network modernization
Mexico 4.90% CAGR (2026–2035) IMSS hospital expansion program


The U.S. remains the single largest national market, with CMS processing over 800 million imaging claims annually [2]. Canada is investing CAD 2.1 billion in provincial diagnostic imaging modernization through 2028, targeting wait-time reduction [21]. Mexico's IMSS system opened 14 new imaging-equipped hospitals in 2024, and private-sector operators like Grupo Diagnóstico Médico PROA are scaling networks in northern states [22].

Europe

Country Key Metric Key Driver
Germany 24.8% of regional share DRG-funded imaging infrastructure
UK USD 3.65 Billion (2025) NHS imaging transformation program
France 4.55% CAGR (2026–2035) National cancer screening mandates
Italy USD 2.10 Billion (2025) PNRR-funded hospital digitization
Spain 4.40% CAGR (2026–2035) Regional health authority investments
Nordic Countries USD 1.85 Billion (2025) AI-first imaging strategies
Russia 4.20% CAGR (2026–2035) Import substitution in imaging equipment
Rest of Europe USD 2.90 Billion (2025) EU cohesion fund allocations


Europe's Diagnostic Imaging Services Market benefits from universal coverage mandates that guarantee access to imaging. The UK's NHS committed GBP 2.3 billion to a diagnostic imaging network expansion through 2025, creating 160 community diagnostic centers [18]. Germany's hospital reform law (KHVVG) restructures capital funding to incentivize advanced imaging deployment in designated specialty centers [23].

Asia-Pacific

Country Key Metric Key Driver
China 38.2% of regional share 14th Five-Year Plan hospital upgrades
India 7.10% CAGR (2026–2035) Ayushman Bharat and rural imaging access
Japan USD 3.90 Billion (2025) Aging population, high per-capita utilization
South Korea 5.80% CAGR (2026–2035) Medical tourism and AI imaging R&D
ASEAN USD 2.15 Billion (2025) Thailand and Vietnam hospital expansion
Rest of Asia-Pacific 5.50% CAGR (2026–2035) Australia and New Zealand fleet renewal


Asia-Pacific is the fastest-growing region in the Diagnostic Imaging Services Market, propelled by massive government infrastructure spending and a rising middle class demanding diagnostic access. China's domestic manufacturers — Mindray, United Imaging, and Neusoft Medical — are driving price competition that expands addressable volumes. India plans to add 12,000 imaging-equipped health and wellness centers under Phase 3 of the Ayushman Bharat scheme [3].

South America

Country Key Metric Key Driver
Brazil 58.3% of regional share SUS public health system investment
Argentina USD 0.65 Billion (2025) Private-sector diagnostic chains
Rest of South America 5.10% CAGR (2026–2035) Chile, Colombia clinic expansion


Brazil's Unified Health System (SUS) operates the region's largest public imaging network, processing over 95 million procedures annually [22]. Private diagnostic chains such as Fleury and DASA are consolidating the fragmented market and investing in cloud-connected imaging platforms.

Middle East & Africa

Country Key Metric Key Driver
Saudi Arabia 32.5% of regional share Vision 2030 healthcare mega-projects
UAE USD 0.85 Billion (2025) Medical tourism and premium facilities
South Africa 4.60% CAGR (2026–2035) NHI rollout and public-sector imaging
Egypt USD 0.40 Billion (2025) Universal health insurance expansion
Rest of MEA 5.20% CAGR (2026–2035) NGO and development-bank funding


Saudi Arabia's Vision 2030 has funneled over USD 65 billion into healthcare infrastructure, including flagship imaging centers in Riyadh and Jeddah [24]. The UAE positions itself as a regional imaging hub, with hospitals in Dubai and Abu Dhabi attracting cross-border patients seeking PET/CT and advanced MRI services.


Diagnostic Imaging Services Market By Region, 2025-2035

Competitive Benchmarking

The Diagnostic Imaging Services Market operates under medium concentration, with the top five equipment and service providers capturing an estimated 55–62% of global revenue. The Herfindahl-Hirschman Index (HHI) sits in the 1,200–1,500 range, reflecting an oligopolistic core flanked by regional specialists and emerging Chinese manufacturers that are compressing price premiums across mid-tier modalities.

Company Est. Revenue Share Range Key Offerings Strategic Positioning
GE HealthCare ~14–17% Revolution CT, SIGNA MRI, Edison AI platform Broad portfolio leader with AI integration across modalities
Siemens Healthineers ~13–16% NAEOTOM Alpha photon-counting CT, Magnetom MRI Technology innovator, premium positioning
Philips Healthcare ~10–13% MR 5300, Spectral CT 7500, HealthSuite platform Integrated diagnostics and connected-care strategy
Canon Medical Systems ~5–7% Aquilion CT, Vantage MRI, Aplio ultrasound Mid-tier value proposition, strong in Japan/APAC
Fujifilm Healthcare ~4–6% SCENARIA View CT, digital radiography, Synapse PACS Imaging IT and enterprise workflow focus
Hologic ~3–5% 3Dimensions mammography, Brevera biopsy system Women's health imaging specialist
Carestream Health ~2–4% DRX digital radiography, Vue PACS Cost-competitive digital X-ray solutions
Shimadzu Corporation ~2–3% RADspeed Pro, Trinias angiography Fluoroscopy and angiography specialist
Samsung Healthcare (Medison) ~2–3% V8, RS85 Prestige ultrasound Ultrasound innovation, expanding into CT
Mindray Medical ~2–4% Resona ultrasound, NeuViz CT Price-competitive Chinese manufacturer scaling globally


Recent News & Developments

  • GE HealthCare (January 2025): Launched the Revolution Apex Elite CT with deep-learning reconstruction, achieving 82% dose reduction in cardiac imaging protocols. This positions GE to capture share in the growing cardiac CT segment [4].
  • Siemens Healthineers (October 2024): Received FDA clearance for its AI-Rad Companion Chest CT 2.0, which autonomously detects and quantifies 12 thoracic pathologies. The tool integrates directly into existing Syngo workflow engines [5].
  • Philips Healthcare (January 2022): Completed acquisition of Cardiologs, a cardiac AI diagnostics firm, for USD 150 Million to strengthen its imaging-plus-monitoring platform strategy [20].


  • Fujifilm Healthcare (September 2023): Launched Synapse Radiology AI platform integrating 14 third-party algorithms across chest X-ray, mammography, and brain MRI on a single dashboard [7].
  • RadNet Inc. (June 2024): Acquired 18 imaging centers across California and the Mid-Atlantic, bringing its total network to 385 centers and reinforcing the consolidation trend in freestanding imaging operations [20].


Diagnostic Imaging Services Market Report Scope

Parameter Detail
Market Scope Global Diagnostic Imaging Services Market covering equipment-linked services, imaging center operations, and AI-enabled workflow platforms
Study Period 2021–2035
CAGR (Forecast Period) 4.80% (2026–2035)
Base Year Market Size USD 84.40 Billion (2025)
Forecast Year Market Size USD 134.50 Billion (2035)
Fastest Growing Segment Diagnostic Imaging Centers (by end user); CT (by modality)
Companies Profiled GE HealthCare, Siemens Healthineers, Philips, Canon Medical, Fujifilm, Hologic, Carestream, Shimadzu, Samsung Healthcare, Mindray
Valuation Currency USD Billion


FAQs

How does site-of-service migration affect imaging center investment returns?
Payer policies are actively steering volumes toward freestanding centers, where per-scan reimbursement is 40–60% lower than hospital outpatient departments but operating margins run 8–12 percentage points higher due to leaner overhead [2]. Investors targeting the Diagnostic Imaging Services Market should prioritize multi-modality centers in suburban corridors with a favorable payer mix.
What role does helium scarcity play in MRI fleet planning?
Helium-free MRI magnets eliminate boil-off risk and reduce lifecycle costs by USD 100,000–150,000 per system [6]. Fleet planners should factor helium-free availability into procurement cycles starting 2026.
How are photon-counting CT detectors changing competitive dynamics in the Diagnostic Imaging Services Market?
Photon-counting CT delivers spectral data at standard dose levels, enabling material decomposition without dual-energy workarounds [5]. Siemens holds first-mover advantage, but GE and Philips have disclosed development programs targeting 2027–2028 commercial launches.
What cybersecurity risks should imaging operators prioritize?
Connected imaging devices are high-value ransomware targets — the HHS reported 725 healthcare breaches in 2024, with radiology PACS among the top five compromised systems [13]. Operators should implement zero-trust network segmentation for all DICOM-transmitting devices.
How does the Diagnostic Imaging Services Market respond to recession cycles?
Imaging volumes dipped only 2–4% during the 2008–2009 recession because diagnostic necessity limits discretionary deferral [1]. Elective screening procedures absorb most cyclical impact while emergency and oncology imaging remain stable.
What differentiates a successful imaging network acquisition strategy?
Acquirers achieving above-market returns focus on geographic density, shared PACS infrastructure, and payer contract leverage across consolidated volumes [20]. Single-site acquisitions without network synergy typically underperform within 18 months.
How will the Diagnostic Imaging Services Market integrate with remote patient monitoring platforms?
Cloud PACS and AI-triage are converging with RPM workflows, enabling longitudinal imaging surveillance for chronic conditions like COPD and heart failure [7]. This integration creates recurring scan-scheduling pathways that stabilize volume forecasting.    
Author
Author
Author Profile
Rahul Gotadki LinkedIn
Research Manager
He holds an experience of about 9+ years in Market Research and Business Consulting, working under the spectrum of Life Sciences and Healthcare domains. Rahul conceptualizes and implements a scalable business strategy and provides strategic leadership to the clients. His expertise lies in market estimation, competitive intelligence, pipeline analysis, customer assessment, etc.
Co-Author
Co-Author Profile
Kinjoll Dey LinkedIn
Senior Research Analyst
He is an extremely curious individual currently working in Healthcare and Medical Devices Domain. Kinjoll is comfortably versed in data centric research backed by healthcare educational background. He leverages extensive data mining and analytics tools such as Primary and Secondary Research, Statistical Analysis, Machine Learning, Data Modelling. His key role also involves Technical Sales Support, Client Interaction and Project management within the Healthcare team. Lastly, he showcases extensive affinity towards learning new skills and remain fascinated in implementing them.
Download Free Sample

Kindly complete the form below to receive a free sample of this Report

Download PDF ×

We do not share your information with anyone. However, we may send you emails based on your report interest from time to time. You may contact us at any time to opt-out.
















