Request Free Sample ×

Kindly complete the form below to receive a free sample of this Report

* Please use a valid business email

Leading companies partner with us for data-driven Insights

clients tt-cursor
Hero Background

Drip Irrigation Market

ID: MRFR/Agri/6780-HCR
200 Pages
Snehal Singh
Last Updated: May 27, 2026
Drip Irrigation Market Size, Share, Industry Trend & Analysis Research Report By Application (Surface Drip Irrigation, Subsurface Drip Irrigation (SDI)), By Component (Drip Tubes / Tapes, Emitters / Drippers, Filters, Controllers & Sensors, Fittings & Connectors), By Crop Type (Field Crops, Orchard / Plantation Crops, Vegetable & Horticulture, Other (Turf & Landscape)), By End User (Commercial Farms, Smallholder Farms, Residential Landscapes), By Sales Channel (Dealers & Distributors, Direct Sales, Online Retail), By Region (Asia-Pacific, Europe, North America, South America, Middle East & Africa) - Forecast to 2035
Download PDF ×

We do not share your information with anyone. However, we may send you emails based on your report interest from time to time. You may contact us at any time to opt-out.


Drip Irrigation Market Summary

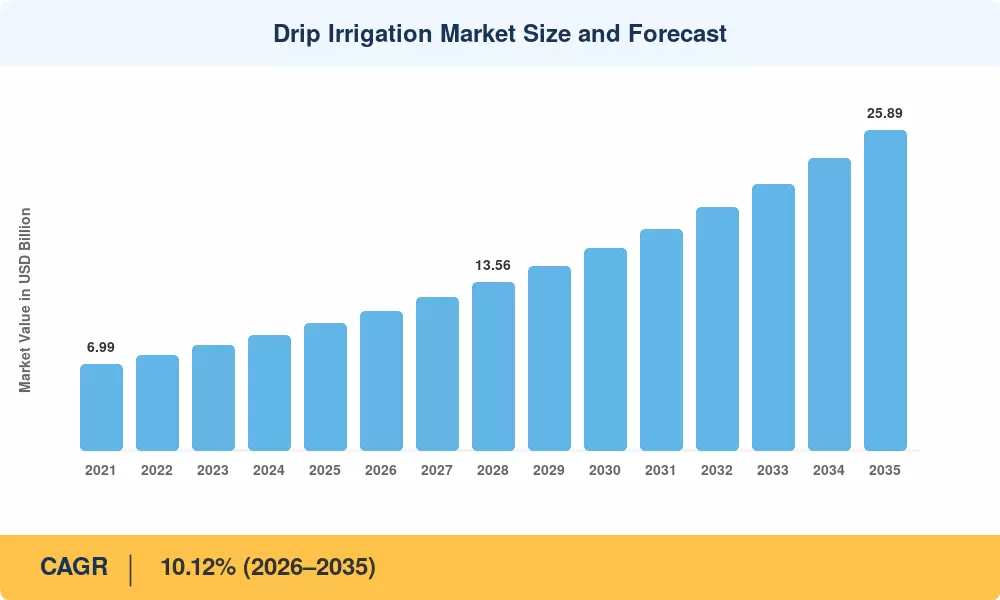
The Drip Irrigation Market stood at USD 10.28 billion in 2025 and is projected to reach USD 11.15 billion in 2026 before climbing to USD 25.89 billion by 2035, registering a CAGR of 10.12% across the forecast window. Two catalysts anchor this trajectory: India's Pradhan Mantri Krishi Sinchayee Yojana (PMKSY), which channels roughly USD 3.5 billion in cumulative micro-irrigation subsidies through 2028 [2], and the European Union's Common Agricultural Policy reform mandating a 25% reduction in freshwater abstraction for irrigated cropland by 2030 [3]. These policy levers compress payback periods for growers, turning precision water delivery agriculture from a long-horizon bet into a near-term operational upgrade.

A technological shift is altering the way water gets to the root zone. Legacy flood and furrow systems, which still represent an estimated 85% of irrigated hectares globally, are being progressively replaced with drip tape fertigation systems and micro drip emitter irrigation networks that reduce water consumption by 30–50% per hectare [4]. Smart drip irrigation automation platforms currently use soil-moisture sensors, weather APIs and variable-rate controllers to schedule watering cycles without manual intervention, reducing on-farm labor needs by up to 25% [5]. Investment in subsurface drip irrigation (SDI) sped up after California’s Sustainable Groundwater Management Act (SGMA) set basin-level extraction limits, with almond and pistachio growers beginning to refit entire blocks with underground drip lines [6].

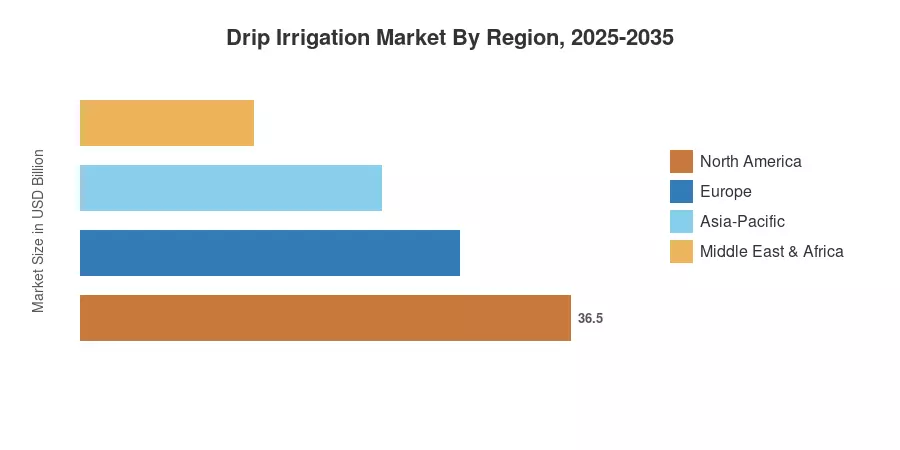
Asia-Pacific, with 45.0 share of the Drip Irrigation Market, anchors absolute demand with India’s subsidy architecture and China’s cotton-belt modernization program. Africa has the highest regional CAGR at 12.0%, driven by World Bank–financed climate-smart agriculture projects in East and West Africa [7]. Regionally, Europe is the second largest, and with water framework compliance and CAP eco-schemes, growers are being pushed towards precision water delivery agriculture. With growing freshwater stress on every continent, the Drip Irrigation Market is poised to be the go-to capital expenditure for irrigated agriculture by the mid-2030s.


Key Report Takeaways

• By Application

  • Surface drip systems captured 72.0% of the Drip Irrigation Market revenue in 2025, reflecting the lower upfront cost per hectare for annual row crops.
  • Subsurface drip irrigation SDI is projected to expand at a 12.5% CAGR through 2035 as permanent crop growers prioritize water savings and reduced tillage interference.

• By Component

  • Drip tubes and drip tape fertigation system components accounted for USD 3.26 billion in 2025, anchoring the consumables segment.
  • Controllers and sensors used in smart drip irrigation automation are forecast to log the highest component CAGR of 15.0% through 2035.

• By Geography

  • Asia-Pacific led the Drip Irrigation Market with a 45.0% share in 2025, underpinned by India and China.
  • Africa is poised for a 12.0% CAGR through 2035, the fastest among all regions.
  • North America contributed USD 1.85 billion in 2025, driven by SGMA compliance and specialty-crop economics.


Drip Irrigation Market Size and Forecast (2021–2035)

The MARKET RESEARCH FUTURE market-sizing model triangulates manufacturer shipments, trade-flow statistics, and end-user surveys in 42 countries. Historical values (2021-2024) are cross-checked against customs databases and company reports. The 2025 base year is a blend of preliminary shipment data and channel checks. Forecast values (2026-2035) use a compound model based on expansion in irrigated area, subsidy disbursement timelines and technology adoption S-curves.

Market Size Chart
Our Impact
Enabled $4.3B Revenue Impact for Fortune 500 and Leading Multinationals
Partnering with 2000+ Global Organizations Each Year
30K+ Citations by Top-Tier Firms in the Industry
 

Driver Impact Analysis

Driver ~% Impact on CAGR Geographic Relevance Impact Timeline
Government subsidies & cost-share programs 22% India, China, EU Short-term (≤2 yr)
Freshwater depletion & regulatory mandates 18% Western US, MENA, Southern Europe Medium-term (2–4 yr)
Smart drip irrigation automation & IoT integration 16% North America, Europe, Israel Medium-term (2–4 yr)
Commodity-price economics favoring yield intensification 12% Global Short-term (≤2 yr)
Climate-smart agriculture financing (World Bank, AfDB) 11% Sub-Saharan Africa, South Asia Long-term (≥4 yr)
Online retail & direct-to-grower distribution 10% India, Southeast Asia Medium-term (2–4 yr)
Subsurface drip irrigation SDI adoption for permanent crops 11% US, Australia, Spain Long-term (≥4 yr)


Government Subsidies & Cost-Share Programs

India's PMKSY allocated INR 93,068 crore (approximately USD 11 billion) over its operational lifespan, with the micro-irrigation component covering 55% of capital costs for smallholders under five hectares [2]. These programs compress payback to under two seasons, converting drip from an aspirational upgrade into a default investment for the Drip Irrigation Market.

Freshwater Depletion & Regulatory Mandates

California's SGMA framework requires 21 critically over-drafted basins to reach sustainability by 2040, with interim milestones triggering land-fallowing penalties [6]. Growers who install subsurface drip irrigation SDI can demonstrate measurable extraction reductions, avoiding curtailment orders. A similar dynamic plays out in Spain's Guadalquivir basin, where the Confederación Hidrográfica has capped annual irrigation allocations at 4,000 m³/ha, making precision water delivery agriculture the only viable path for high-value olive and citrus operations [12].

Smart Automation & IoT Integration

The convergence of low-cost soil-moisture probes (now under USD 50 per unit) and cloud-based scheduling engines enables real-time zone-level control in drip tape fertigation systems [5]. Netafim's NetBeat platform and Rivulis's Manna system use satellite imagery and machine-learning models to adjust emitter run times daily, delivering documented water savings of 18–22% above manually scheduled micro drip emitter irrigation [13]. As sensor hardware costs continue declining, smart drip irrigation automation will shift from premium to mainstream in the Drip Irrigation Market.

Climate-Smart Agriculture Financing

International development finance institutions are actively scaling precision irrigation systems to build long-term climate resilience. The World Bank’s regional irrigation initiatives across sub-Saharan Africa finance localized drip infrastructure to secure smallholder yields against volatile weather patterns. In parallel, the African Development Bank’s agricultural transformation programs direct concessional lending facilities toward micro-irrigation equipment for regional vegetable and staple cultivation, cementing the continent as a rapidly growing commercial frontier.


Restraints Impact Analysis

The restraint estimates below are directional indicators of downward pressure on market growth. They reflect adoption-friction factors rather than direct subtraction from the CAGR figure.

Restraint ~% Negative Impact Geographic Relevance Impact Timeline
High upfront capital cost for smallholders –18% Sub-Saharan Africa, South Asia Short-term (≤2 yr)
Clogging & maintenance complexity –14% Arid regions with hard water Medium-term (2–4 yr)
Limited agronomic extension services –12% Developing economies Long-term (≥4 yr)
Fragmented land tenure discourages fixed investment –10% Sub-Saharan Africa, Southeast Asia Long-term (≥4 yr)
Supply-chain bottlenecks for polymer raw materials –8% Global Short-term (≤2 yr)


High Upfront Capital Cost

Fully installed drip systems cost USD 1,200–USD 2,500 per hectare, depending on topography and emitter density, a sum that exceeds two-season net income for many smallholders in rainfed zones [14]. While subsidies offset 40–55% of this cost in India and China, coverage remains thin across Southeast Asia and francophone Africa, limiting penetration of precision water delivery agriculture where water stress is most acute.

Clogging & Maintenance Complexity

Emitter clogging from calcium carbonate, iron bacteria, and algae build-up reduces micro drip emitter irrigation system efficiency by 15–25% within two seasons if filtration is neglected [15]. Growers who lack access to acid-flush kits and proper sand-media filters face recurring downtime, eroding trust in drip technology and slowing repeat purchases in the Drip Irrigation Market.

Fragmented Land Tenure

In regions characterized by communal, shared, or insecure land holding structures, growers demonstrate a clear reluctance to commit limited capital toward fixed, subterranean irrigation infrastructure that cannot be easily extracted or relocated. Institutional field surveys highlight that a lack of formal land titles and clear tenure documentation routinely prevents qualified smallholders from participating in state-sponsored micro-irrigation financing and subsidy initiatives, suppressing the addressable market footprint.


Drip Irrigation Market Opportunities

Retrofit of Legacy Flood-Irrigated Acreage

The vast majority of global agricultural land still relies heavily on legacy flood and furrow irrigation methods, representing an expansive long-term conversion opportunity for micro-irrigation hardware. State-level water-pricing reforms, such as transitioning to volumetric water tariffs for agricultural users, are poised to drastically accelerate this shift, compelling commercial growers to swap out inefficient flooding practices for automated drip tape fertigation networks.

Drone-as-a-Service for Micro-Irrigation Mapping

Emerging drone-based canopy-stress mapping services allow agronomists to pinpoint under-irrigated zones within existing drip blocks, driving component upgrades — particularly additional micro drip emitter irrigation laterals and smart controllers. This precision water delivery agriculture overlay model creates recurring revenue for equipment vendors.

Fertigation-as-a-Service Subscription Models

Leading irrigation technology manufacturers are expanding into operational subscription structures that bundle baseline field hardware, specialized nutrient delivery setups, and digital agronomic advisory services into a unified per-hectare annual operational fee. This shift effectively eliminates the steep upfront capital requirement that historically blocked smallholder participation, restructuring the competitive landscape toward recurring-revenue service models.

Emerging-Market Expansion via Concessional Finance

Africa and South Asia represent under-penetrated geographies where drip adoption sits below 5% of irrigated area [7]. Blended-finance vehicles — combining World Bank IDA credits with private irrigation-fund equity — can de-risk investments and open greenfield demand for smart drip irrigation automation.

Data Monetization from Soil & Weather Telemetry

Connected drip systems generate high-resolution soil-moisture, nutrient-uptake, and microclimate datasets. Aggregated and anonymized, this data holds value for crop-insurance underwriters, commodity traders, and seed-biotech firms, creating a secondary revenue stream for platform operators in the Drip Irrigation Market.


Drip Irrigation Market Future Outlook

AI-Driven Autonomous Irrigation

Smart drip irrigation automation platforms are increasingly integrating advanced AI crop models capable of adjusting emitter schedules in real time based on predictive weather forecasting and satellite-derived evapotranspiration indices. This optimization enhances global crop water productivity, directly driving the long-term expansion of the drip irrigation market.

Circular-Economy Material Innovation

Polymer supply constraints and heightened environmental, social, and governance scrutiny are pushing manufacturers toward recycled and bio-based drip tape solutions. Leading industry players are scaling up circularity programs to produce drip tubes from post-consumer recycled resin, significantly lowering the embedded carbon footprint of the hardware. This shift directly aligns drip tape production with the strict Scope 3 emission reporting requirements demanded by major food-retail buyers.


Solar-Powered Drip Systems

Off-grid solar pump kits paired with micro-drip emitter networks are opening up vital new agricultural markets in regions where grid electricity is absent or unreliable. The continuous decline in the manufacturing and deployment costs of solar-irrigation infrastructure has made these standalone kits highly competitive against traditional diesel-powered pumping systems, accelerating micro-irrigation adoption across water-stressed regions.


Platform Economics & Digital Ecosystems

Subscription-based digital platforms that bundle hardware leasing, automation software, agronomic advisory services, and crop insurance are emerging as a major competitive frontier. Companies capable of effectively monetizing telemetry data from subsurface drip irrigation networks will capture substantial value beyond traditional hardware margins, steadily shifting the broader market toward recurring-revenue service models.


Drip Irrigation Market Segmentation

By Application

Segment Key Metric Primary Demand Driver
Surface Drip Irrigation 72.0% share (2025) Lower capex for annual row crops
Subsurface Drip Irrigation (SDI) 12.5% CAGR (2026–2035) Permanent-crop water efficiency


Surface systems dominate the Drip Irrigation Market because annual-crop growers prefer retrievable laterals that can be repositioned each season. The consumable nature of surface drip tape fertigation systems generates steady replacement demand. Subsurface drip irrigation SDI, while costlier to install, delivers superior water savings of 40–50% and eliminates surface evaporation, making it the preferred choice for almond, grape, and olive orchards where payback extends over a 10–15-year tree lifespan [6].

By Component

Segment Key Metric Primary Demand Driver
Drip Tubes / Tapes USD 3.26 Billion (2025) Consumable replacement cycle
Emitters / Drippers 8.8% CAGR (2026–2035) Precision micro drip emitter irrigation upgrades
Filters USD 1.05 Billion (2025) Anti-clogging compliance
Controllers & Sensors 15.0% CAGR (2026–2035) Smart drip irrigation automation demand
Fittings & Connectors USD 0.72 Billion (2025) System standardization


Controllers and sensors represent the fastest-growing component category because precision water delivery agriculture requires real-time feedback loops. Integration of IoT-enabled flow meters with cloud platforms allows remote monitoring of thousands of hectares, reducing on-farm labor by 20–30% [5].

By Crop Type

Segment Key Metric Primary Demand Driver
Field Crops 52.0% share (2025) Cotton, sugarcane, and maize acreage scale
Orchard / Plantation Crops 11.0% CAGR (2026–2035) High-value permanent-crop economics
Vegetable & Horticulture USD 2.16 Billion (2025) Export-quality produce standards
Other (Turf & Landscape) 8.2% CAGR (2026–2035) Urban green-infrastructure mandates


Field crops command the largest share of the Drip Irrigation Market, driven by government programs that subsidize drip installation on cotton and sugarcane acreage in India and China [2][11]. Orchard crops are the fastest-growing category as growers of almonds, avocados, and citrus invest in subsurface drip irrigation SDI to maximize water productivity and qualify for sustainability certifications demanded by export markets.

By End User

Segment Key Metric Primary Demand Driver
Commercial Farms 57.5% share (2025) Scale economics and subsidy access
Smallholder Farms 9.2% CAGR (2026–2035) Concessional finance and aggregator models
Residential Landscapes 10.5% CAGR (2026–2035) Municipal water-use restrictions


By Sales Channel

Segment Key Metric Primary Demand Driver
Dealers & Distributors 49.0% share (2025) Established agronomic advisory bundling
Direct Sales USD 2.36 Billion (2025) Large-farm procurement contracts
Online Retail 14.2% CAGR (2026–2035) Price transparency and smallholder access


Online retail is reshaping distribution in the Drip Irrigation Market, particularly across India and Southeast Asia, where platforms such as BigHaat and AgriBazaar offer micro drip emitter irrigation kits with doorstep delivery and EMI financing [10].


Regional Market Share Analysis

Region Key Metric Primary Investment Themes
Asia-Pacific 45.0% market share (2025) Subsidy-driven micro drip emitter irrigation rollout; cotton-belt modernization
Europe USD 1.95 Billion (2025) CAP eco-scheme compliance; Mediterranean water scarcity
North America 10.12% CAGR (2026–2035) SGMA compliance; specialty-crop economics
South America USD 0.82 Billion (2025) Sugarcane drip conversion; Cerrado expansion
Middle East & Africa 12.0% CAGR (2026–2035) Climate-smart agriculture finance; arid-zone food security
Total USD 10.28 Billion (2025)

The Drip Irrigation Market exhibits pronounced regional asymmetry. Asia-Pacific dominates in absolute volume, while Africa registers the steepest growth slope. Precision water delivery agriculture adoption correlates tightly with subsidy availability, water-stress severity, and extension-service reach.


Asia-Pacific

Country Key Metric Key Driver
China 9.8% CAGR (2026–2035) Xinjiang cotton-belt subsurface drip irrigation SDI
India USD 2.48 Billion (2025) PMKSY subsidy disbursement
Japan 5.6% CAGR (2026–2035) High-value greenhouse horticulture
South Korea USD 0.18 Billion (2025) Smart-farm government initiative
ASEAN 11.2% CAGR (2026–2035) Palm oil and tropical-fruit drip conversion
Rest of Asia-Pacific USD 0.31 Billion (2025) Emerging vegetable-export corridors


India's micro-irrigation mission has cumulatively covered over 12.5 million hectares, with Maharashtra, Andhra Pradesh, and Gujarat leading state-level adoption [2]. China's precision water delivery agriculture strategy targets 13.3 million hectares of drip-irrigated farmland by 2030, predominantly in arid northwestern provinces, reinforcing Asia-Pacific's anchor role in the Drip Irrigation Market [11].

Europe

Country Key Metric Key Driver
Germany USD 0.24 Billion (2025) Vineyard and hop-field precision irrigation
UK 7.2% CAGR (2026–2035) Post-Brexit farm-productivity grants
France USD 0.38 Billion (2025) Lavender and wine-region drip adoption
Italy 8.5% CAGR (2026–2035) Olive and tomato fertigation expansion
Spain USD 0.52 Billion (2025) Guadalquivir basin water-allocation caps
Nordic Countries 6.1% CAGR (2026–2035) Greenhouse smart drip irrigation automation
Russia USD 0.12 Billion (2025) Southern steppe grain-belt trials
Rest of Europe 7.8% CAGR (2026–2035) EU Water Framework Directive compliance


Spain leads European adoption, driven by Andalucía's olive groves, where drip tape fertigation systems have replaced surface flooding on roughly 60% of irrigated area since 2018 [12]. The EU's Farm-to-Fork strategy ties subsidy eligibility to water-use efficiency benchmarks, creating a regulatory pull for the Drip Irrigation Market across all member states [3].

South America

Country Key Metric Key Driver
Brazil USD 0.54 Billion (2025) Sugarcane and coffee micro drip emitter irrigation
Argentina 8.9% CAGR (2026–2035) Wine-region drip conversion in Mendoza
Rest of South America USD 0.11 Billion (2025) Andean vegetable and berry exports


Brazil's sugarcane sector is piloting subsurface drip irrigation SDI on 45,000 hectares in São Paulo state, documenting 20% yield gains over center-pivot sprinklers while reducing water withdrawal by 35% [18].

North America

Country Key Metric Key Driver
US USD 1.52 Billion (2025) SGMA compliance; almond and pistachio retrofit
Canada 8.3% CAGR (2026–2035) Greenhouse cannabis and berry drip systems
Mexico USD 0.14 Billion (2025) Avocado and berry-export precision irrigation


The US dominates North America's Drip Irrigation Market share. California alone accounted for roughly 42% of domestic drip-system shipments in 2024, propelled by SGMA enforcement and specialty-crop economics that justify premium smart drip irrigation automation investments [6].

Middle East & Africa

Country Key Metric Key Driver
Saudi Arabia USD 0.28 Billion (2025) Vision 2030 agricultural diversification
UAE 9.5% CAGR (2026–2035) Controlled-environment agriculture
South Africa USD 0.22 Billion (2025) Wine and citrus drip adoption
Egypt 11.8% CAGR (2026–2035) New Delta & Toshka reclamation projects
Rest of MEA 13.1% CAGR (2026–2035) World Bank Sahel Irrigation Initiative


Large-scale land reclamation programs anchor Africa's growth trajectory. Egypt's New Administrative Capital agricultural belt alone plans 150,000 hectares of drip-irrigated farmland, while Kenya's Galana-Kulalu Food Security Project targets precision water delivery agriculture across 1 million acres [7][19].


Regional Market Share
 

Competitive Benchmarking

The Drip Irrigation market is moderately concentrated, with the top five vendors anticipated to account for 38%-44% of global revenues. The Herfindahl-Hirschman Index is between 900 and 1,100, which indicates a market that is balanced between established multinationals and aggressive regional challengers. Vertical integration from polymer extrusion to emitter manufacture to digital advice is the competitive moat for incumbents. Low-cost Asian newcomers compete on price in subsidy-driven markets.

Company Est. Revenue Share Range Key Offerings Strategic Positioning
Netafim (Orbia) 10–14% Precision drip systems, NetBeat digital platform Global leader in smart drip irrigation automation
The Toro Company 7–10% Drip tape, micro-sprinklers, controllers Diversified irrigation and landscape portfolio
Rivulis 5–8% Drip lines, Manna satellite advisory Technology-forward mid-market positioning
Jain Irrigation Systems 6–9% Drip tubes, tissue culture, food processing Vertically integrated Indian champion
Lindsay Corporation 3–5% FieldNET, drip-pivot hybrid systems Pivot-to-drip crossover strategy
Rain Bird Corporation 3–5% Landscape drip, XFS subsurface emitters Residential and commercial landscape focus
Chinadrip Irrigation Equipment 2–4% Low-cost drip tape and fittings Price-leader for the Chinese domestic market
Elgo Irrigation 1–3% Clip-on emitters, micro drip emitter irrigation kits Smallholder and greenhouse specialist
Hunter Industries 2–4% Smart controllers, residential drip kits Connected-home landscape integration
N-Drip 1–2% Gravity-fed micro-irrigation, zero-energy drip Disruptive low-pressure technology entrant


Recent News & Developments


  • Rivulis (January 2025): Acquired Eurodrip's Turkish operations, consolidating its Eastern Mediterranean presence and adding 120,000 MT of annual drip-line extrusion capacity [22].
  • Jain Irrigation (October 2024): Signed a USD 180 million contract with Egypt's New Urban Communities Authority for drip tape fertigation system deployment across 50,000 hectares of reclaimed desert [19].
  • The Toro Company (July 2024): Integrated Aqua-Traxx precision drip tape with its Tempus cloud platform, enabling real-time flow analytics for subsurface drip irrigation SDI installations [23].
  • N-Drip (April 2024): Closed a USD 44 million Series C round led by Insight Partners to scale its gravity-fed micro drip emitter irrigation technology across India and sub-Saharan Africa [24].
  • Government of India (February 2024): Approved Phase III of PMKSY with an additional INR 14,236 crore allocation for micro-irrigation coverage expansion to 20 million hectares by 2028 [2].
  • Lindsay Corporation (December 2023): Partnered with CropX to embed soil-sensor analytics into its FieldNET platform, targeting precision water delivery agriculture for US corn and soybean growers [25].


Drip Irrigation Market Report Scope

Parameter Details
Market Scope Global Drip Irrigation Market covering surface and subsurface systems, components, crop types, end users, and sales channels
Study Period 2021–2035
CAGR (Forecast) 10.12% (2026–2035)
Base Year Market Size USD 10.28 Billion (2025)
Forecast Endpoint USD 25.89 Billion (2035)
Fastest Growing Segment Controllers & sensors (15.0% CAGR); Africa (12.0% CAGR)
Companies Profiled 10
Valuation Currency USD Billion


FAQs

How long does a typical drip system last before requiring full replacement?

Commercial-grade drip tape lasts 1–3 seasons, while heavy-wall drip tubing and subsurface lines deliver 10–15 years of service with proper filtration and acid flushing [15]. System longevity depends primarily on water quality and maintenance discipline.

What is the minimum farm size that justifies drip irrigation investment?

Farms as small as 0.25 hectares can achieve payback within two seasons when subsidies cover 50% of capital costs, as demonstrated under India's PMKSY program [2]. Aggregator models further lower the threshold.

How does drip compare with center-pivot sprinklers on water-use efficiency?

Drip systems deliver water directly to the root zone at 90–95% application efficiency, versus 75–85% for center-pivot sprinklers [4]. The gap widens in arid climates where evaporative losses penalize overhead systems.


What role does fertigation play in drip irrigation ROI?

Drip tape fertigation systems deliver nutrients directly to roots, cutting fertilizer use by 25–30% while boosting yields 10–15%, which typically recovers the incremental system cost within a single growing season [5].

Are there insurance or financing products specifically designed for drip adoption?

Several agri-fintech firms now bundle drip-system loans with weather-indexed crop insurance, reducing lender risk and offering growers integrated coverage packages [10]. NABARD's refinance schemes in India provide concessional rates for micro-irrigation loans.


Author
Author
Author Profile
Snehal Singh LinkedIn
Manager - Research
High acumen in analyzing complex macro & micro markets with more than 6 years of work experience in the field of market research. By implementing her analytical skills in forecasting and estimation into market research reports, she has expertise in Packaging, Construction, and Equipment domains. She handles a team size of 20-25 resources and ensures smooth running of the projects, associated marketing activities, and client servicing.

Research Approach


Secondary Research

The secondary research process involved comprehensive analysis of agricultural databases, water resource management publications, peer-reviewed agronomy journals, and authoritative environmental organizations. Key sources included the Food and Agriculture Organization (FAO) FAOSTAT Database, US Department of Agriculture (USDA) National Agricultural Statistics Service (NASS), World Bank Water Resources Data, International Water Management Institute (IWMI) Publications, International Commission on Irrigation and Drainage (ICID) Reports, US Environmental Protection Agency (EPA) WaterSense Program, European Environment Agency (EEA) Water Information System for Europe (WISE), US Geological Survey (USGS) Water Use Program, CGIAR Research Program on Water, Land and Ecosystems (WLE), India National Mission on Micro Irrigation (NMMI) Reports, Israel Ministry of Agriculture and Rural Development Irrigation Division, China Ministry of Water Resources National Irrigation Development Statistics, Australia Bureau of Meteorology (BOM) Water Register, California Department of Water Resources (DWR), andTexas Commission on Environmental Quality (TCEQ) Agricultural Water Use Reports. These sources were utilized to collect irrigated area statistics, water scarcity indices, adoption rates of precision irrigation technologies, subsidy program data, crop yield comparative studies, and regulatory frameworks governing agricultural water efficiency standards for surface drip, sub-surface drip, inline emitter, and online emitter systems.


Primary Research

To gather both qualitative and quantitative insights, the primary research process involved including stakeholders from both the supply-side and the demand-side through survey instruments and structured interviews. Participants from the supply side included top executives from companies that make drip irrigation systems, emitter technology, filtration systems, and smart ag-tech solutions. They included directors of regional sales, chiefs of irrigation product development, heads of agricultural technology, and regulatory compliance officers. Large-scale farmers, agronomists who focus on water-efficient farming, irrigation system designers, landscape contractors, government agricultural extension agents, and cooperative procurement managers were all part of the demand-side sources. The following information was derived from primary sources: the adoption patterns of different crops, the dates of research and development for pressure-compensating emitters and clog-resistant technologies, the investment cycles of irrigation infrastructure, the utilization rates of subsidies, and the effects of water tariffs on technology adoption.

Primary Respondent Breakdown:

By Designation: C-level Primaries (32%), Director Level (30%), Others (38%)

By Region: North America (32%), Europe (30%), Asia-Pacific (28%), Rest of World (10%)


Market Size Estimation

Global market valuation was derived through revenue mapping, installed base analysis, and irrigated area adoption metrics. The methodology included:

Identification of 40+ key manufacturers and system integrators across North America, Europe, Asia-Pacific, Latin America, and Middle East & Africa

Product mapping across inline emitters (cylindrical/flat drip lines), online emitters (button/drip emitters), surface drip systems, and sub-surface drip irrigation (SDI) networks, including filtration units, valves, and automation controllers

Analysis of reported and modeled annual revenues specific to drip irrigation equipment portfolios and precision agriculture service offerings

Coverage of manufacturers representing 65-70% of global market share in 2024, including Netafim, Jain Irrigation, Rain Bird, The Toro Company, Hunter Industries, and regional specialists

Bottom-up estimation through analysis of total irrigated hectarage by crop type (field crops, orchard crops, plantation crops, landscape) multiplied by average system adoption rates and average selling prices (ASP) by country/region

Top-down validation through manufacturer revenue triangulation, import/export data analysis for irrigation equipment, and government subsidy disbursement records for micro-irrigation schemes

Cross-verification with water stress indices and agricultural productivity metrics to model addressable market potential through 2035

Download Free Sample

Kindly complete the form below to receive a free sample of this Report