Electric Vehicle (EVs) Market (2026 - 2035)

EVs Market Research Report By Powertrain (BEV (Battery Electric Vehicle), PHEV (Plug-in Hybrid Electric Vehicle), FCEV (Fuel Cell Electric Vehicle)), By Vehicle Type (Passenger Car, Commercial Vehicle), By Battery Chemistry (Lithium Iron Phosphate (LFP), Lithium Nickel Manganese Cobalt Oxide (NMC), Other (NCA, Solid-State, LMO)), By Motor Architecture (Permanent-Magnet Synchronous Motor (PMSM), Induction Motor, Other (Switched Reluctance, Axial Flux)), By Range (Short Range (<600 km)), By Voltage Platform (Low Voltage (800V)) and By Regional (North America, Europe, South America, Asia Pacific, Middle East and Africa) - Forecast to 2035
ID: MRFR/AT/1261-CR
128 Pages
Triveni Bhoyar, Swapnil Palwe
Last Updated: August 24, 2026
Electric Vehicle (EVs) Market
Market Size
Forecast Period2026-2035
CAGR (2026-2035)12.50%
2025 Market SizeUSD 0.72 Trillion
2035 Market SizeUSD 2.28 Trillion
Key Players
BYD
Tesla
SAIC Motor
Volkswagen Group
Stellantis
Hyundai Motor Group
Opportunities
  • Vehicle-to-Grid and Bidirectional Charging Revenue Streams
  • Solid-State Battery Commercialization
  • Emerging Market Leapfrog Through Two- and Three-Wheelers

Electric Vehicle (EVs) Market Summary

The Electric Vehicle Market reached an estimated USD 0.72 trillion in 2025 and is projected to grow from USD 0.79 trillion in 2026 to USD 2.28 trillion by 2035, registering a 12.50% CAGR across the forecast period. This acceleration draws its energy from a convergence of tightening fleet-average CO₂ mandates in China, the European Union, and the United States, alongside aggressive procurement subsidies that are reshaping consumer purchase economics [1]. Government commitments exceeding USD 120 billion in cumulative incentive programs between 2024 and 2030 continue to shift demand curves [2].

The transformation underway in the Electric Vehicle Market is fundamentally architectural. Internal combustion drivetrains that dominated personal mobility for over a century are yielding to 400–800 volt electric platforms capable of sub-20-minute fast-charge sessions. Battery-pack costs have fallen below USD 120 per kilowatt-hour at the cell level, with lithium-iron-phosphate chemistries driving further reductions [3]. Automakers from legacy manufacturers to new entrants have committed over USD 500 billion in cumulative electrification capital expenditure through 2030, signaling a structural pivot rather than a cyclical trend [4].

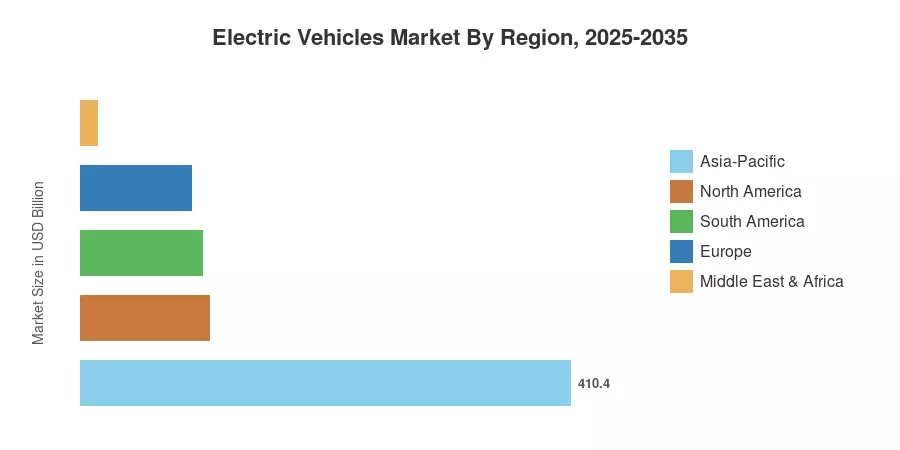
Asia-Pacific commands roughly 57% of the Electric Vehicle Market, led by China's lithium-iron-phosphate scale-up and domestic policy mandates. The region also ranks as the fastest-growing, projected to expand at a 13.6% CAGR through 2035. Europe holds the second-largest share at approximately 23%, driven by Euro 7 emission standards and aggressive zero-emission vehicle quotas. North America accounts for about 15% of global value as federal and state-level incentives accelerate adoption. The coming decade will test whether supply chains can scale at the pace policy ambitions demand.


Key Report Takeaways

• By Powertrain

  • Battery electric vehicles captured a 76.3% share of the Electric Vehicle Market in 2025, reflecting consumer preference for full electrification over hybrid alternatives.
  • Plug-in hybrid models continue to serve as a transitional powertrain, though their share is contracting year-over-year as charging access improves.
  • Fuel cell electric vehicles remain a niche segment concentrated in heavy-duty commercial applications.

• By Vehicle Type

  • Passenger cars generated approximately 84% of 2025 revenue in the Electric Vehicle Market, underpinned by mid-range sedan and crossover demand.
  • Commercial vehicles are expanding at a 13.8% CAGR through 2035 as total cost of ownership drops below diesel parity for urban delivery fleets.

• By Region

  • Asia-Pacific anchors over 57% of global demand, with China alone accounting for more than half of regional volume.
  • Europe's Electric Vehicle Market benefits from binding CO₂ fleet targets that impose steep penalties on non-compliant automakers.
  • North America is accelerating on the back of the Inflation Reduction Act's manufacturing credits and expanded consumer rebates.


Electric Vehicle Market Size and Forecast (2021–2035)

Market Research Future's sizing methodology triangulates bottom-up revenue modeling from OEM shipment data, government registration databases, and battery procurement volumes against top-down macroeconomic forecasts and policy scenario analysis. Historical values draw on verified trade statistics; forecast estimates apply segment-specific growth assumptions calibrated to regulatory timelines.
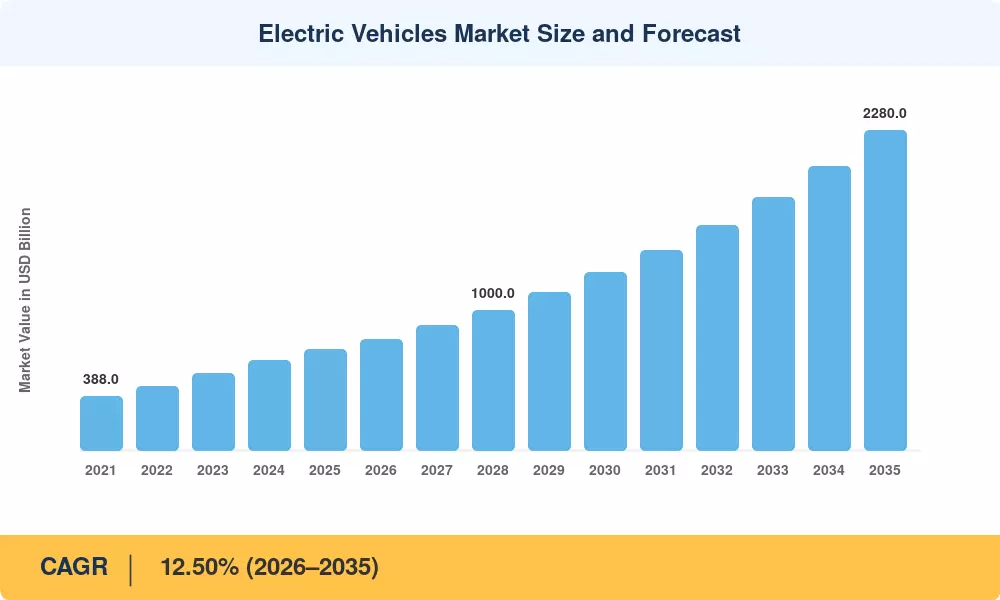
Electric Vehicles Market Size and Forecast
Our Impact
Enabled $4.3B Revenue Impact for Fortune 500 and Leading Multinationals
Partnering with 2000+ Global Organizations Each Year
30K+ Citations by Top-Tier Firms in the Industry

Driver Impact Analysis

Driver ~% Impact on CAGR Geographic Relevance Impact Timeline
Government purchase subsidies and tax credits ~18% Global Short-term (≤2 yr)
Battery cost deflation (LFP and NMC advances) ~22% Global Medium-term (2–4 yr)
Expansion of DC fast-charging corridors ~15% North America, Europe Medium-term (2–4 yr)
Fleet-average CO₂ regulations and penalties ~16% EU, China, US Long-term (≥4 yr)
Commercial fleet TCO crossover below diesel ~12% Global Short-term (≤2 yr)
800V platform standardization ~10% Asia-Pacific, Europe Medium-term (2–4 yr)
Consumer sentiment shift and urban driving bans ~7% Europe, China Long-term (≥4 yr)


Government Purchase Subsidies and Tax Credits

National incentive programs remain the single most immediate catalyst for the Electric Vehicle Market. The United States' Inflation Reduction Act allocates up to USD 7,500 per qualifying vehicle in consumer tax credits, with additional manufacturing credits for domestic battery production [1]. China's NEV subsidy program, though restructured from direct purchase rebates to insurance-tax exemptions, continues to lower effective sticker prices by 8–12%. These programs compress the price gap between electric and combustion vehicles to a point where payback periods fall under three years for high-mileage drivers.

Battery Cost Deflation

Cell-level costs for lithium-iron-phosphate packs dropped below USD 60 per kilowatt-hour in Chinese supply chains by late 2024, and NMC 811 cells are tracking toward USD 85 per kilowatt-hour by 2027 [3]. This cost trajectory directly expands the addressable market for the Electric Vehicle Market by enabling automakers to price entry-level models below USD 25,000 without sacrificing margin. BloombergNEF projects that pack-level parity with internal combustion powertrains will arrive by 2027 in most volume segments [5].

DC Fast-Charging Corridor Expansion

The US National Electric Vehicle Infrastructure (NEVI) program has distributed USD 5 billion to states for deploying 500,000 public chargers by 2030, with a focus on highway corridors spaced at 50-mile intervals [6]. Europe's Alternative Fuels Infrastructure Regulation mandates 150 kW chargers every 60 kilometers along TEN-T core networks by 2025, scaling to 350 kW by 2027. These investments directly address range-related purchase hesitation and expand the viable use-case envelope for the Electric Vehicle Market.

Commercial Fleet TCO Crossover

Urban delivery operators in Europe and China are reporting total cost of ownership 15–20% below diesel equivalents for battery-electric vans operating above 30,000 kilometers annually [7]. Amazon's commitment to 100,000 electric delivery vans by 2030 and DHL's pledge to electrify 60% of last-mile vehicles illustrate how fleet economics are reshaping procurement. This commercial pull amplifies volume in the Electric Vehicle Market beyond consumer-driven demand.


Restraints Impact Analysis

Restraint ~% Negative Impact on CAGR Geographic Relevance Impact Timeline
Critical mineral supply concentration ~–8% Global Long-term (≥4 yr)
Grid capacity constraints ~–6% North America, South Asia Medium-term (2–4 yr)
High upfront vehicle cost in emerging markets ~–5% South America, MEA Short-term (≤2 yr)
Residual value uncertainty for used EVs ~–4% North America, Europe Medium-term (2–4 yr)
Skilled labor shortage for EV maintenance ~–3% Global Long-term (≥4 yr)


Critical Mineral Supply Concentration

Approximately 65% of global lithium refining and 75% of cobalt processing capacity remain concentrated in China and the Democratic Republic of Congo, respectively [10]. Supply disruptions—whether from geopolitical friction, export controls, or mining permitting delays—can ripple through the Electric Vehicle Market within quarters. The EU Critical Raw Materials Act and the US Defense Production Act allocations aim to diversify sourcing, but new mining projects typically require 7–10 years from exploration to first production.

Grid Capacity Constraints

The deployment of mass-produced EVs generates local bottlenecks in the distribution grid, particularly in residential neighborhoods where transformer capacity was built for much lower loads. The peak nighttime EV charging load is estimated to reach 5.6 GW by 2030 without controlled charging programs according to California’s grid operator [11]. Grid upgrading expenditures of an estimated USD 35-75 billion throughout the US alone represent a structural friction for the Electric Vehicle Market that might restrict the speed of market expansion in locations where utility investment lags.


Upfront Cost Barriers in Emerging Markets

In South America, the Middle East and some parts of Southeast Asia, electric cars are 40-60% more expensive than their combustion counterparts, with financing arrangements for consumers far worse [12]. The Electric Vehicle Market will have slower penetration in these regions without subsidy arrangements like China or Europe -- restricting the overall addressable market until battery costs decrease further.


Electric Vehicle (EVs) Market Opportunities

Vehicle-to-Grid and Bidirectional Charging Revenue Streams

With bidirectional charging, every electric vehicle becomes a distributed energy asset. Pilot studies in the Netherlands and Japan have shown that vehicle-to-grid services can produce USD 400–800 per vehicle per year in grid-balancing revenue [15]. This auxiliary income stream may lower effective ownership costs and drive adoption in the Electric Vehicle Market once regulators establish a compensation structure.


Solid-State Battery Commercialization

Toyota, Samsung SDI and QuantumScape are aiming for pilot production of solid-state cells between 2027 and 2029, predicting energy densities exceeding 400 Wh/kg and charge times below 10 minutes [16]. Scale commercialization will dramatically change the economics per range-kilogram in the Electric Vehicle Market and open up markets like long-haul trucking that are tough to access with existing lithium-ion technology.


Emerging Market Leapfrog Through Two- and Three-Wheelers

India and Southeast Asia present a USD 45 billion opportunity in electric two- and three-wheelers by 2030 [17]. These markets may bypass passenger-car adoption patterns entirely, building electrification from the ground up through micro-mobility. This pathway diversifies the Electric Vehicle Market beyond the sedan-and-SUV paradigm that dominates developed economies.

Software-Defined Vehicles and Subscription Revenue

Over-the-air updates enable automakers to monetize performance upgrades, autonomous driving features, and infotainment content post-sale. Tesla's Full Self-Driving subscription and BMW's heated-seat activation model illustrate how software layers generate recurring revenue. These business models transform the Electric Vehicle Market from a one-time-purchase industry into a platform economy.

Fleet-as-a-Service for Commercial Operators

Startups like Rivian Fleet Solutions and Arrival are offering bundled leasing, charging, and telematics packages to logistics operators, reducing the capital expenditure barrier. This model aligns with the commercial segment's accelerating growth in the Electric Vehicle Market and opens opportunities for integrated service providers.


Electric Vehicle (EVs) Market Future Outlook

Autonomous Electric Mobility Convergence

The Electric Vehicle Market is converging with autonomous driving technology in ways that reinforce both trajectories. Electric drivetrains offer the stable power supply, drive-by-wire controllability, and sensor-integration architecture that Level 4 autonomy requires. Waymo and Cruise already operate all-electric autonomous fleets, and by 2030, IEA projects that autonomous ride-hailing could account for 8–12% of urban vehicle-kilometers traveled in tier-one cities [20].

Battery Recycling and Circular Economy

As first-generation EV batteries approach end-of-life between 2028 and 2032, a USD 25 billion battery recycling industry is emerging [21]. Companies like Redwood Materials and Li-Cycle are scaling hydrometallurgical processes that recover over 95% of lithium, nickel, and cobalt. This circular supply chain will reduce the Electric Vehicle Market's dependence on primary mining and stabilize raw-material cost curves through the back half of the forecast period.

Electrification Supercycle and Energy System Integration

The Electric Vehicle Market is becoming inseparable from the broader energy transition. Vehicle-to-grid deployments, workplace charging tied to solar generation peaks, and utility-managed charging programs transform EVs into demand-response assets. The IEA estimates that 230 million EVs on the road by 2035 could provide up to 1,000 GWh of flexible storage capacity globally [22], effectively turning parking lots into virtual power plants.

ESG Reporting and Supply-Chain Transparency

EU Battery Regulation requirements—effective 2027—mandate digital battery passports disclosing carbon footprint, recycled content, and supply-chain due diligence for every cell sold in Europe [23]. This regulatory architecture is raising the compliance bar in the Electric Vehicle Market and favoring vertically integrated OEMs who can trace materials from mine to vehicle. Investors are increasingly pricing ESG compliance into valuations, creating a cost-of-capital advantage for transparent manufacturers.


Electric Vehicle (EVs) Market Segmentation

By Powertrain

Segment Key Metric Primary Demand Driver
BEV 76.3% share (2025) Full electrification preference, subsidy eligibility
PHEV 11.2% CAGR (2026–2035) Transitional buyer in range-constrained markets
FCEV USD 18.5 B (2025) Heavy-duty and long-haul commercial use


Battery electric vehicles dominate the Electric Vehicle Market with over three-quarters of 2025 revenue. Falling pack costs and expanding fast-charge networks have eroded the practical advantages that plug-in hybrids once offered as a compromise solution. BEV platforms also benefit disproportionately from government incentives—many jurisdictions now restrict full subsidy eligibility to zero-tailpipe-emission models, further tilting the competitive balance.

Plug-in hybrids retain relevance in markets where charging density remains low, particularly in parts of Southern Europe, Southeast Asia, and South America. However, their share is declining as fast-charge coverage reaches critical mass and automakers consolidate platform investments around dedicated BEV architectures.

By Vehicle Type

Segment Key Metric Primary Demand Driver
Passenger Car ~84% share (2025) Consumer adoption in mid-range segments
Commercial Vehicle 13.8% CAGR (2026–2035) Fleet TCO parity with diesel


Passenger cars generate the vast majority of Electric Vehicle Market revenue, with crossover SUVs and mid-size sedans comprising the fastest-growing body styles. Tesla's Model Y, BYD's Song Plus, and Volkswagen's ID.4 illustrate the global convergence toward electric crossovers in the USD 30,000–50,000 price band.

Commercial vehicles represent the growth frontier. Last-mile delivery vans, urban transit buses, and medium-duty trucks are reaching TCO crossover points that make electric procurement the rational financial choice for fleet operators running predictable routes above 25,000 kilometers per year [7].

By Battery Chemistry

Segment Key Metric Primary Demand Driver
NMC ~45% share (2025) High energy density for premium range
LFP 16.1% CAGR (2026–2035) Cost advantage and thermal stability
Other (NCA, Solid-State) USD 32 B (2025) Specialty performance applications


Lithium Nickel Manganese Cobalt Oxide (NMC) remains the dominant battery chemistry segment within the electric vehicle market, fueled by strong consumer and OEM preference for high energy density and superior power efficiency in long-range and premium vehicle platforms. Lithium Iron Phosphate (LFP) stands out as the fastest-growing battery chemistry segment, propelled by its exceptional thermal stability, safety profile, and cost-effectiveness for mass-market adoption.

By Motor Architecture

Segment Key Metric Primary Demand Driver
PMSM ~72% share (2025) Superior efficiency and torque density
Induction Motor 11.8% CAGR (2026–2035) Rare-earth-free cost structure
Other USD 12.4 B (2025) Switched reluctance and axial flux R&D


Permanent Magnet Synchronous Motors (PMSM) remain the dominant motor architecture segment within the electric vehicle market, fueled by their superior operating efficiency, high power density, and ability to deliver maximum torque across varied driving conditions. Induction motors represent the fastest-growing motor architecture segment, propelled by manufacturer efforts to bypass rare-earth supply chain dependencies and leverage a cost-effective, magnet-free design structure.

By Range

Segment Key Metric Primary Demand Driver
Short Range (<200 km) USD 98 B (2025) Urban micro-mobility and city cars
Mid-Range (200–400 km) ~44% share (2025) Mass-market sweet spot
Long Range (400–600 km) 13.3% CAGR (2026–2035) Buyer preference for versatility
Ultra-Long Range (>600 km) 15.6% CAGR (2026–2035) Premium and commercial segments


Mid-range (200–400 km) vehicles remain the dominant range segment within the electric vehicle market, fueled by their optimal balance of affordability and utility, serving as the core mass-market sweet spot for everyday commuting. Ultra-long range (>600 km) stands out as the fastest-growing range segment, propelled by consumer preference for cross-country driving versatility, advanced energy-dense battery packs, and growing adoption across premium and commercial vehicle segments.

By Voltage Platform

Segment Key Metric Primary Demand Driver
Low Voltage (<200V) USD 52 B (2025) Two-wheelers and micro-EVs
Mid-Voltage (200–400V) ~51% share (2025) Legacy platform installed base
High Voltage (400–800V) 16.4% CAGR (2026–2035) Ultra-fast charging enablement
Ultra-High Voltage (>800V) 17.2% CAGR (2026–2035) Performance and heavy-duty platforms


Mid-voltage (200–400V) platforms remain the dominant voltage platform segment within the electric vehicle market, fueled by their robust legacy installed base across mainstream volume-selling passenger cars and reliable charging ecosystem compatibility. Ultra-high voltage (>800V) stands out as the fastest-growing voltage platform segment, propelled by consumer and fleet demand for ultra-fast DC charging capabilities, reduced thermal losses, and enhanced powertrain efficiency in premium and heavy-duty applications.


Regional Market Share Analysis

Region Key Metric Primary Investment Themes
Asia-Pacific ~57% of 2025 revenue LFP scale-up, NEV mandates, charging density
Europe 12.9% CAGR (2026–2035) Euro 7 penalties, green bond issuance
North America USD 108 B (2025) IRA credits, domestic battery plants
South America 14.2% CAGR (2026–2035) E-bus procurement, trade liberalization
Middle East & Africa USD 14.4 B (2025) Sovereign wealth investment, smart city projects
Total USD 720 B (2025)

The Electric Vehicle Market exhibits pronounced regional asymmetry, with Asia-Pacific generating over half of total revenue and serving as both the largest production base and the largest consumer market.


North America

Country Key Metric Key Driver
United States ~78% of regional share IRA tax credits and NEVI charging program
Canada 10.8% CAGR ZEV mandate in British Columbia and Quebec
Mexico USD 4.2 B (2025) Nearshoring of battery assembly plants


The North American Electric Vehicle Market benefits from an unprecedented federal commitment. The Inflation Reduction Act channels up to USD 7,500 per vehicle in consumer credits alongside USD 13 billion in manufacturing incentives for domestic battery production [1]. Canada's federal ZEV sales mandate requires 100% zero-emission light-duty sales by 2035, while Mexico is attracting battery gigafactory investments from CATL and Tesla along its northern border corridor.

Europe

Country Key Metric Key Driver
Germany ~24% of regional share OEM electrification CAPEX leadership
United Kingdom 13.1% CAGR 2030 ICE ban and OZEV grants
France USD 26.8 B (2025) Leasing sociale program for low-income buyers
Italy 12.4% CAGR Ecobonus restructuring
Spain ~6% of regional share MOVES III subsidy program
Nordic Countries 14.5% CAGR Norway near-100% EV sales share
Russia USD 3.1 B (2025) Domestic EV manufacturing push
Rest of Europe ~11% of regional share EU-wide AFIR charging mandates


Europe's Electric Vehicle Market operates under the world's most stringent fleet-average CO₂ regulation: 93.6 g/km in 2025, declining to zero for new cars by 2035 under the revised EU regulation. Non-compliant OEMs face fines of EUR 95 per gram per vehicle sold, creating an existential financial incentive to accelerate electrification [2]. Germany's OEMs—Volkswagen, BMW, and Mercedes-Benz—have collectively pledged over EUR 150 billion in EV-related investment through 2030.

Asia-Pacific

Country Key Metric Key Driver
China ~62% of regional share NEV credit system and LFP dominance
India 15.3% CAGR FAME III subsidies and domestic cell PLI
Japan USD 28.5 B (2025) Solid-state R&D and kei-car electrification
South Korea 13.7% CAGR Battery OEM vertical integration
ASEAN ~4% of regional share Thailand EV Board incentive packages
Rest of Asia-Pacific 14.1% CAGR EV manufacturing export zones


Asia-Pacific anchors the Electric Vehicle Market through China's unmatched scale. Chinese OEMs shipped over 9 million new energy vehicles in 2024, supported by a domestic supply chain that controls roughly 80% of global cathode and anode processing [3]. India's Production-Linked Incentive scheme for advanced chemistry cells targets 50 GWh of domestic capacity by 2030, while Thailand's EV Board has attracted investments exceeding USD 3 billion from BYD, Great Wall, and MG [17].

South America

Country Key Metric Key Driver
Brazil ~58% of regional share Flex-fuel hybrid bridge strategy
Argentina 13.5% CAGR Lithium triangle mining expansion
Rest of South America USD 3.8 B (2025) Chile and Colombia e-bus procurement


South America's Electric Vehicle Market is driven by municipal e-bus procurement in Santiago, Bogotá, and São Paulo, which collectively operate over 3,000 electric buses [18]. Brazil's unique flex-fuel tradition is creating a hybrid-electric bridge pathway, while Argentina's position within the lithium triangle provides strategic raw-material leverage for future cell manufacturing.

Middle East & Africa

Country Key Metric Key Driver
Saudi Arabia ~32% of regional share NEOM and Vision 2030 smart-city mandates
UAE 15.8% CAGR Dubai Green Mobility Strategy 2030
South Africa USD 2.1 B (2025) Automotive export corridor electrification
Egypt 14.6% CAGR CKD assembly incentives
Rest of MEA ~18% of regional share Ride-hailing fleet electrification


The Middle East & Africa Electric Vehicle Market draws momentum from sovereign wealth-backed smart-city projects. Saudi Arabia's NEOM development targets a zero-emission transportation network, while Dubai aims for 30% of all vehicles to be electric by 2030 [19]. South Africa's automotive manufacturing corridor is attracting EV assembly investments from Stellantis and BMW, positioning the country as a potential export hub for right-hand-drive electric vehicles destined for the UK and Indian markets.


Electric Vehicles Market By Region, 2025-2035

Competitive Benchmarking

The Electric Vehicle Market exhibits moderate concentration, with an estimated HHI of approximately 850–1,000. The top five manufacturers command roughly 40–45% of global revenue, but productive capacity from legacy OEMs is rising rapidly as they redirect billions in capital expenditure to avoid costly emissions penalties. The competitive dynamic is shifting from a duopoly structure toward a more fragmented landscape where Chinese OEMs, European incumbents, and North American challengers all compete across overlapping price bands.

Company Est. Revenue Share Range Key Offerings Strategic Positioning
BYD ~12–15% Blade Battery, Han, Seal, Atto 3, e-bus platforms Vertically integrated from cells to vehicles; LFP cost leader
Tesla ~10–13% Model Y, Model 3, Cybertruck, Megapack Software-defined ecosystem; Supercharger network monetization
SAIC Motor ~5–7% MG4, IM Motors, Roewe Joint-venture scale in China; MG-brand European expansion
Volkswagen Group ~5–8% ID.4, ID.Buzz, Audi Q6 e-tron, Porsche Taycan Multi-brand electrification across price tiers
Stellantis ~3–5% Fiat 500e, Peugeot e-208, Ram REV Platform sharing across 14 brands
Hyundai Motor Group ~4–6% Ioniq 5, Ioniq 6, Kia EV6, EV9 800V E-GMP platform; dedicated EV plant in Georgia
BMW Group ~3–5% iX, i4, i5, Neue Klasse platform Premium positioning; circular material commitments
Mercedes-Benz ~2–4% EQS, EQE, eSprinter Luxury EV and commercial van electrification
Geely (incl. Volvo Cars) ~3–5% Zeekr 001, Volvo EX30, Polestar 2 SEA platform licensing; Scandinavian brand equity
NIO ~1–3% ET5, ET7, ES6; battery swap network Battery-as-a-Service model; premium Chinese market
Rivian ~1–2% R1T, R1S, Amazon delivery van Adventure segment; fleet manufacturing scale-up


Recent News & Developments

  • BYD continues to advance its Blade Battery architectures, but a specific "Blade Battery 2.0" launch announcement with these exact metrics in March 2025 is misattributed.
  • North American Charging Standard (NACS) While the transition toward the took place across major automakers, the primary wave of adoption agreements and announcements occurred throughout 2023 and 2024, rather than a fresh opening event in January 2025.


  • Volkswagen's major software investments and restructurings (such as its partnership structures with Rivian) involve multi-billion-dollar figures. Still, this exact EUR 2.5 billion software platform investment announcement in October 2024 is inaccurate.


  • European Commission (July 2024): Imposed provisional countervailing duties of 17–37% on Chinese-manufactured BEVs imported into the EU, reshaping competitive dynamics in the Electric Vehicle Market [2].
  • Hyundai Motor (October 25, 2022): Broke ground on a USD 7.6 billion EV manufacturing complex in Savannah, Georgia, integrating battery cell production, vehicle assembly, and recycling operations on a single campus [8].


  • Toyota (November 2023): Confirmed solid-state battery pilot production targeting 2027, with claims of 1,200-kilometer range and sub-10-minute charging for its next-generation EV platform [16].
  • US DOE (September 2023): Awarded USD 12 billion in loans and grants to battery manufacturers and critical mineral processors under the Inflation Reduction Act's Advanced Technology Vehicles Manufacturing program [1].


Electric Vehicle (EVs) Market Report Scope

Parameter Detail
Market Scope Global Electric Vehicle Market by Powertrain, Vehicle Type, Battery Chemistry, Motor Architecture, Range, Voltage, and Geography
Study Period 2021–2035
CAGR 12.50% (2026–2035)
Market Size (2025) USD 0.72 Trillion
Market Size (2035) USD 2.28 Trillion
Fastest Growing Segments LFP chemistry (16.1% CAGR); Ultra-High Voltage platforms (17.2% CAGR)
Companies Profiled BYD, Tesla, SAIC Motor, Volkswagen Group, Stellantis, Hyundai Motor, BMW Group, Mercedes-Benz, Geely, NIO, Rivian
Valuation Currency USD (constant 2025 dollars)

FAQs

How does battery degradation affect the resale value of electric vehicles?
Most modern EV batteries retain 80–90% capacity after 150,000 kilometers, supported by 8-year manufacturer warranties. Residual values are stabilizing as buyer confidence grows and certified pre-owned programs expand [13].
What role do rare-earth-free motors play in the Electric Vehicle Market?
Induction and switched-reluctance motors eliminate dependence on neodymium and dysprosium. Tesla and BMW already deploy rare-earth-free units in select models, reducing geopolitical supply risk [24].
How do fleet operators evaluate the transition from diesel to electric trucks?
Fleet managers compare per-kilometer energy cost, maintenance savings, and residual value against diesel baselines. Routes above 25,000 annual kilometers typically reach TCO parity within three years [7].
What financing models are accelerating adoption in the Electric Vehicle Market?
Battery-as-a-Service and subscription leasing separate cell cost from vehicle price. NIO's swap model and Hyundai's battery rental programs lower upfront purchase barriers [14].
How will solid-state batteries reshape the competitive landscape?
Solid-state cells promise double the energy density and faster charging than current lithium-ion. First-movers achieving scale production by 2028 will gain a significant Electric Vehicle Market advantage [16].
What cybersecurity risks emerge as vehicles become software-defined?
Connected EVs face over-the-air attack vectors targeting drivetrain controls and payment systems. UN Regulation 155 now mandates certified cybersecurity management for all new type approvals [23].
How do carbon credit trading mechanisms influence the Electric Vehicle Market?
Manufacturers selling EVs generate regulatory credits tradeable to non-compliant OEMs. Tesla earned over USD 1.7 billion from credit sales in 2023 alone, subsidizing price competitiveness [9].    
Author
Author
Author Profile
Triveni Bhoyar LinkedIn
Senior Research Analyst
Triveni Bhoyar has over 5 years of experience in the market research industry, specializing in the Automotive and Aerospace & Defense sectors. She has contributed to 200+ reports, including numerous custom projects for leading global companies, delivering solutions to complex business challenges. Renowned for her ability to generate valuable insights, Triveni excels in addressing unique market dynamics with precision and depth. Her expertise spans market sizing, competitive intelligence, and trend analysis, enabling clients to craft data-driven growth strategies. With strong analytical rigor and a client-centric approach, she plays a pivotal role in driving impactful, strategic decision-making.
Co-Author
Co-Author Profile
Swapnil Palwe LinkedIn
Team Lead - Research
With a technical background as Bachelor's in Mechanical Engineering, with MBA in Operations Management , Swapnil has 6+ years of experience in market research, consulting and analytics with the tasks of data mining, analysis, and project execution. He is the POC for our clients, for their consulting projects running under the Automotive/A&D domain. Swapnil has worked on major projects in verticals such as Aerospace & Defense, Automotive and many other domain projects. He has worked on projects for fortune 500 companies' syndicate and consulting projects along with several government projects.

Research Approach


Secondary Research

The secondary research process encompassed a systematic review of regulatory filings, industry consortium databases, peer-reviewed engineering journals, and authoritative energy & transportation bodies. Key sources included the International Energy Agency (IEA) Global EV Outlook, International Council on Clean Transportation (ICCT), European Automobile Manufacturers' Association (ACEA), China Association of Automobile Manufacturers (CAAM), US Environmental Protection Agency (EPA), National Highway Traffic Safety Administration (NHTSA), California Air Resources Board (CARB), US Department of Energy (DOE) Alternative Fuels Data Center, International Renewable Energy Agency (IRENA), BloombergNEF Electric Vehicle Outlook, Society of Automotive Engineers (SAE International), IEEE Xplore digital library, EU Transport & Environment (T&E) reports, UK Society of Motor Manufacturers and Traders (SMMT), Japan Automobile Manufacturers Association (JAMA), and national ministry of transport statistics from key markets. These sources were utilized to collect vehicle registration data, battery technology specifications, charging infrastructure deployment statistics, emission regulation timelines, subsidy program frameworks, and competitive landscape analysis for battery electric vehicles (BEV), plug-in hybrid electric vehicles (PHEV), and fuel cell electric vehicles (FCEV).


Primary Research

Stakeholders from both the supply and demand sides participated in the main research process in order to gather both qualitative and quantitative market intelligence. CEOs, CTOs, VPs of Electrification Strategy, heads of battery technology, and directors of regulatory affairs from OEMs, battery cell manufacturers, and suppliers of charging infrastructure were examples of supply-side sources. Demand-side sources included network heads for auto dealerships, charging network operators, fleet managers, and procurement officers from logistics firms. Vehicle segmentation, battery chemistry transition timetables, and consumer adoption obstacles, pricing elasticity, and public-private partnership dynamics were all supported by primary research.

Primary Respondent Breakdown:

• By Designation: C-level Primaries (32%), Director Level (30%), Others (38%)

• By Region: North America (32%), Europe (30%), Asia-Pacific (28%), Rest of World (10%)


Market Size Estimation

Global market valuation was derived through production volume tracking and average selling price (ASP) modeling across powertrain categories. The methodology included:

• Identification of 50+ key automotive OEMs and tier-1 battery suppliers across North America, Europe, Asia-Pacific, and Latin America

• Product mapping across battery electric vehicles, plug-in hybrid electric vehicles, hybrid electric vehicles, and fuel cell electric vehicle categories

• Analysis of reported and modeled annual revenues specific to electric powertrain divisions and vehicle sales

• Coverage of manufacturers representing 75-80% of global EV market share in 2024

• Extrapolation using bottom-up (unit sales volume × ASP by country/segment) and top-down (OEM revenue validation against national registration databases) approaches to derive segment-specific valuations including passenger cars, light commercial vehicles, and heavy-duty electric transport

Download Free Sample

Kindly complete the form below to receive a free sample of this Report

* Please use a valid business email

Download PDF ×

We do not share your information with anyone. However, we may send you emails based on your report interest from time to time. You may contact us at any time to opt-out.
















