Electric Three Wheelers Market (2026 - 2035)

Electric Rickshaw Market Research Report By End Use (Passenger Carrier, Goods Carrier), By Battery Type (Lead-Acid, Lithium-Ion), By Power Output (Less Than 2 kW, 2–4 kW, 4–6 kW, Above 6 kW), By Charging Model (Fixed (Plug-In) Charging, Battery Swapping) and By Regional (North America, Europe, South America, Asia Pacific, Middle East and Africa) - Industry Forecast to 2035
ID: MRFR/AT/6669-CR
125 Pages
Shubham Munde, Swapnil Palwe
Last Updated: July 01, 2026
Electric Three Wheelers Market
Market Size
Forecast Period2026-2035
CAGR (2026-2035)14.0%
2025 Market SizeUSD 3.90 Billion
2035 Market SizeUSD 14.65 Billion
Key Players
Mahindra Electric Mobility
Piaggio Vehicles Pvt. Ltd.
Bajaj Auto Limited
Kinetic Green Energy
Lohia Auto Industries
Atul Auto Limited
Opportunities
  • Goods-Carrier Electrification for E-Commerce Logistics
  • Battery-as-a-Service and Subscription Models
  • African and Latin American Market Entry

Electric Three Wheelers Market Summary

The Electric Three Wheeler Market was valued at USD 3.90 Billion in 2025, with the forecast period beginning at USD 4.50 Billion in 2026 and projected to reach USD 14.65 Billion by 2035, registering a CAGR of 14.0% from 2026 to 2035. India's PM E-DRIVE scheme and the proposed FAME-III programme, combined with the EU Fit-for-55 package and US Inflation Reduction Act commercial credits, have created a global policy environment that actively tilts fleet economics toward zero-emission three-wheelers [1]. These regulatory levers are accelerating adoption faster than organic demand alone would allow.

A structural technology shift is reshaping the Electric Three Wheeler Market from the inside out. Legacy lead-acid-powered vehicles — long the backbone of South Asian last-mile transport — are giving way to lithium-ion-powered platforms as pack-level prices dropped roughly 12% year-over-year through 2024 [2]. Battery swapping networks have also matured rapidly; one major Indian operator has completed over 50 million swaps across 1,400 stations, cutting commercial driver downtime from hours to minutes [3]. This infrastructure buildout is a critical enabler for fleet-scale electrification.

Asia-Pacific commands the Electric Three Wheeler Market with approximately 77% revenue share in 2025, anchored by India and China's massive installed fleets. The Middle East & Africa region is advancing at the fastest clip with a projected CAGR of 21.0%, driven by urbanization in sub-Saharan cities and new import incentives in the Gulf states [4]. Europe holds the second-largest share at around 8%, supported by L-category vehicle regulations and municipal zero-emission zones. As total-cost-of-ownership parity strengthens across regions, the coming decade will see electric three-wheelers transition from a niche product to a mainstream commercial vehicle platform.

Key Report Takeaways

• By End Use

  • Passenger carriers held a dominant position in the Electric Three Wheeler Market with approximately 76% revenue share in 2025, driven by high-utilization urban commuter fleets across South and Southeast Asia.
  • Goods carriers represent the fastest-expanding end-use segment, projected to grow at a CAGR of 20.0% through 2035 as last-mile logistics operators electrify delivery fleets.


• By Battery Type

  • Lithium-ion battery systems are growing at a CAGR of 22.5%, steadily displacing lead-acid packs as cell-level costs decline and energy density improves.

• By Power Output

  • The 2–4 kW power output segment accounted for approximately 47% of the Electric Three Wheeler Market in 2025, reflecting the predominance of low-speed urban passenger vehicles.


• By Charging Model

  • Battery swapping as a charging model is projected to expand at a 25.8% CAGR, though fixed plug-in charging still holds roughly 82% share.

• By Region

  • Asia-Pacific captured roughly 77% of the global Electric Three Wheeler Market revenue in 2025, with India and China as the two largest national markets.
  • The Middle East & Africa region leads growth projections at a 21.0% CAGR, while Europe is expanding through regulatory incentives for L-category electric vehicles.

Market Size and Forecast (2021–2035)

Market Research Future's estimates for the Electric Three Wheeler Market draw on primary interviews with fleet operators, OEM shipment disclosures, battery import records, and government registration databases across 32 countries. Historical figures (2021–2024) use verified shipment and revenue data, while the forecast (2026–2035) applies a bottom-up model calibrated against policy timelines and lithium-ion cost curves.
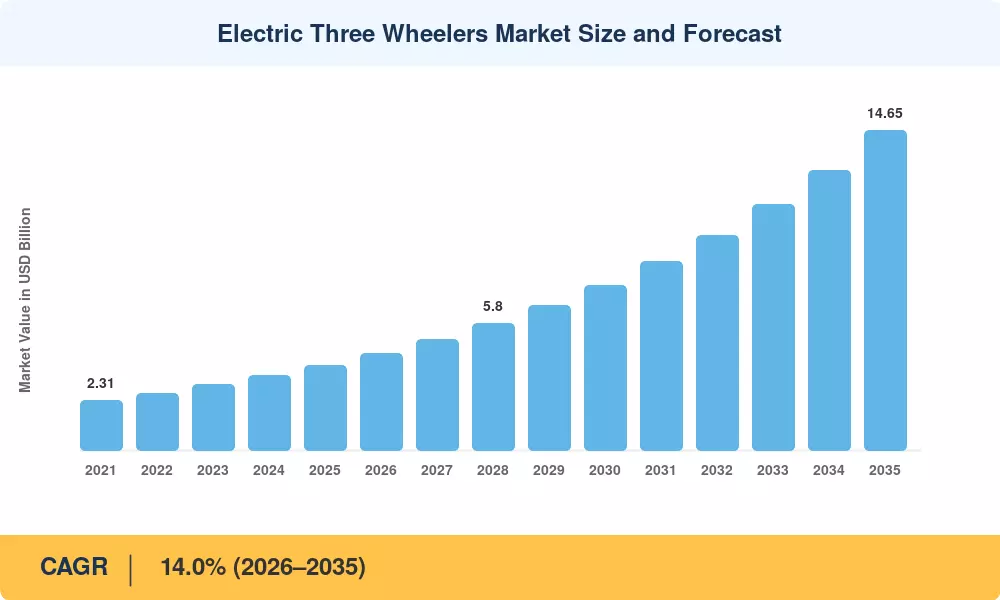
Electric Three Wheelers Market Size and Forecast
Our Impact
Enabled $4.3B Revenue Impact for Fortune 500 and Leading Multinationals
Partnering with 2000+ Global Organizations Each Year
30K+ Citations by Top-Tier Firms in the Industry

Driver Impact Analysis

Driver ~% Impact on CAGR Geographic Relevance Impact Timeline
Government subsidy & incentive programmes ~25% India, EU, US Short-term (≤2 yr)
Lithium-ion battery cost reduction ~20% Global Medium-term (2–4 yr)
Battery swapping infrastructure expansion ~15% India, Southeast Asia Short-term (≤2 yr)
Urbanization & last-mile logistics demand ~15% Asia-Pacific, MEA Long-term (≥4 yr)
Zero-emission zone regulations ~10% Europe, China Medium-term (2–4 yr)
Fleet financing & leasing innovation ~10% India, Africa Medium-term (2–4 yr)
Rising fuel prices & diesel bans ~5% Global Long-term (≥4 yr)


Government Subsidy and Incentive Programmes

By allocating roughly INR 10,900 crore (USD 1.3 billion) for demand-side incentives for electric two- and three-wheelers until 2027, India's PM E-DRIVE initiative directly lowers buyer-side price premiums by 15–20% per vehicle [1]. Meanwhile, the EU's Fit-for-55 package forces European OEMs to create compliant electric three-wheeler platforms by linking CO2 fleet-average targets to L-category cars for the first time. Electric three-wheelers are feasible for campus and warehouse uses in the US thanks to IRA Section 45W credits, which grant up to USD 7,500 per eligible commercial clean vehicle [6]. Prior to 2024, the electric three-wheeler market had not had a synchronized demand pull due to these overlapping regulatory cycles.


Lithium-Ion Battery Cost Decline

This results in a battery module cost of less than USD 1,000 for three-wheelers with 4–8 kWh packs, reducing the acquisition gap with lead-acid cars to less than USD 300 in important markets. Cost stability and cycle life both improve as cathode chemistry moves toward lithium-iron-phosphate (LFP) cells, which currently make up more than 40% of the world's cell manufacturing, supporting the transition to the electric three-wheeler market.


Battery Swapping Infrastructure

Swapping networks removes the single largest operational friction point for commercial three-wheeler drivers: charging downtime. Battery Smart, India's largest swapping network, operates 1,400 stations and has processed over 50 million swaps, delivering a sub-two-minute turnaround time per vehicle [3]. Sun Mobility and Gogoro's partnership extends modular swapping architecture into Southeast Asian markets. The infrastructure effect is self-reinforcing — higher station density improves driver confidence, which raises utilization rates and attracts fleet operators into the Electric Three Wheeler Market.

Urbanization and Last-Mile Logistics

The United Nations projects that 68% of the global population will live in urban areas by 2050, with the steepest growth in Sub-Saharan Africa and South Asia [14]. Congested inner-city corridors are ideally suited for compact three-wheelers that can navigate narrow streets while meeting payload requirements for e-commerce parcels under 200 kg. India's e-commerce sector alone is expected to surpass USD 160 billion by 2028, and electric three-wheelers are increasingly the vehicle of choice for last-mile fulfillment centres operated by Amazon, Flipkart, and regional logistics startups [8].

Restraints Impact Analysis

Restraint ~% Impact on CAGR Geographic Relevance Impact Timeline
High upfront vehicle acquisition cost ~−20% Africa, South America Short-term (≤2 yr)
Inadequate charging infrastructure ~−20% MEA, Southeast Asia Medium-term (2–4 yr)
Lead-acid technology inertia ~−15% India, Bangladesh Short-term (≤2 yr)
Battery raw material supply volatility ~−10% Global Long-term (≥4 yr)
Fragmented safety & homologation standards ~−10% Africa, ASEAN Medium-term (2–4 yr)


High Upfront Acquisition Cost

In markets without subsidies, electric three-wheelers are still 25–40% more expensive than their internal combustion engine (ICE) counterparts, despite declining battery costs [16]. This premium continues to be a major deterrent to adoption and limits the electric three-wheeler market in areas with otherwise robust demand fundamentals, such as Sub-Saharan Africa and portions of South America, where per-capita income is low, and consumer financing infrastructure is weak.


Inadequate Charging Infrastructure

Light electric vehicle public and commercial charging infrastructure is still lacking outside of China and India. Due to the lack of designated three-wheeler charging corridors in the majority of Middle Eastern and African towns, operators are forced to rely on home outlets with 8–10 hour charge cycles [18]. Fleet uptime declines, and the economic case for potential entrants into the electric three-wheeler market weakens in the absence of concurrent investment in grid-connected fast chargers or modular swapping stations.


Lead-Acid Technology Inertia

An estimated 59% of the global electric three-wheeler fleet still runs on lead-acid batteries, which are cheaper at the point of purchase but deliver lower range, shorter cycle life, and heavier curb weight [19]. In price-sensitive Indian and Bangladeshi markets, unorganized assemblers continue to produce low-cost lead-acid vehicles that undercut branded OEMs, fragmenting quality standards and slowing the fleet-wide migration to lithium-ion platforms.

Electric Three Wheelers Market Opportunities

Goods-Carrier Electrification for E-Commerce Logistics

The goods-carrier segment is projected to grow at a 20.0% CAGR through 2035, outpacing passenger carriers by a wide margin. E-commerce fulfilment operators across India, Southeast Asia, and the Gulf states are actively converting last-mile delivery fleets to electric three-wheelers to meet both cost targets and corporate sustainability pledges. Companies like Euler Motors have already secured multi-thousand-unit orders from Amazon India and BigBasket, establishing a template for fleet-scale procurement [8].

Battery-as-a-Service and Subscription Models

Decoupling battery ownership from vehicle ownership through Battery-as-a-Service (BaaS) models lowers the effective purchase price by 30–40% and shifts battery degradation risk to the service provider [3]. This financing innovation directly addresses the upfront cost barrier and opens the Electric Three Wheeler Market to owner-operators who would otherwise be unable to secure traditional vehicle loans. Sun Mobility's energy-as-a-service model and Battery Smart's pay-per-swap pricing are early proof points.

African and Latin American Market Entry

Urbanization rates above 4% per year in cities like Lagos, Nairobi, and Dar es Salaam are creating acute demand for affordable, low-emission intra-city transport [14]. Electric three-wheelers offer a viable alternative to aging motorcycle-taxi fleets, particularly where governments introduce fuel-subsidy phase-outs. Kenya's 2024 exemption of electric vehicles from import duty signals the policy direction. Latin American markets, including Colombia and Peru, are beginning to pilot electric cargo trikes for narrow-street logistics.

Connected Fleet Platforms and Data Monetization

Telematics-enabled electric three-wheelers generate real-time data on route efficiency, battery state-of-health, and driver behaviour. Fleet management platforms can monetize this data through usage-based insurance partnerships, predictive maintenance subscriptions, and city-level mobility analytics sold to municipal planners [10]. As the Electric Three Wheeler Market matures, software-layer revenue will become a meaningful margin contributor for OEMs and fleet operators alike.

Vehicle-to-Grid and Energy Arbitrage

Parked three-wheeler fleets represent distributed energy storage assets. In markets with time-of-use electricity tariffs, operators can charge during off-peak hours and sell stored energy back during peak demand through vehicle-to-grid (V2G) protocols [12]. India's Bureau of Energy Efficiency has initiated V2G pilot programmes in Delhi and Bangalore, and a successful scale-up could add an ancillary revenue stream to the Electric Three Wheeler Market ecosystem.

Electric Three Wheelers Market Future Outlook

Autonomous and Connected Operations

Autonomous three-wheeler corridors are moving from concept to controlled pilots. Several Indian OEMs have partnered with ADAS-technology providers to test Level 2+ autonomy on fixed intra-campus routes, with commercial deployment expected by 2029 [11]. Connected telematics — already standard on premium models — will expand into mid-range vehicles, feeding fleet-management dashboards with real-time battery, route, and driver-performance data. The Electric Three Wheeler Market will increasingly resemble a mobility-software ecosystem rather than a pure hardware industry.

Platform Economics and Ride-Hailing Integration

Ride-hailing platforms such as Uber, Ola, and Grab are integrating electric three-wheelers into their driver-partner networks, offering dedicated EV ride categories in cities like Delhi, Bangkok, and Cairo. Platform-driven demand creates predictable utilization rates that improve financing terms and battery payback periods. By 2030, platform-attached three-wheelers could account for 20–25% of new registrations in the Electric Three Wheeler Market across Asia and Africa [10].

Circular Battery Economy

Second-life battery applications and end-of-life recycling infrastructure will become essential as the first large cohorts of lithium-ion three-wheeler packs reach retirement around 2029–2031. The International Energy Agency projects that recycled cathode materials could supply 10–15% of new cell production by 2035 [12]. OEMs and battery service companies that establish closed-loop collection and refurbishment programmes will capture both cost savings and ESG reporting advantages within the Electric Three Wheeler Market.

ESG Reporting and Carbon-Credit Integration

Fleet electrification generates quantifiable Scope 1 and Scope 3 emission reductions that corporate logistics operators can report under frameworks such as the GHG Protocol and CSRD. Voluntary carbon credit programmes tied to verified electric vehicle kilometres — already piloted by Gold Standard in East Africa — add a revenue layer that improves fleet operator margins [13]. As ESG disclosure moves from voluntary to mandatory in major markets, the Electric Three Wheeler Market will benefit from procurement mandates embedded in corporate sustainability strategies.

Electric Three Wheelers Market Segmentation

By End Use

Segment Key Metric Primary Demand Driver
Passenger Carrier ~76% share (2025) Urban commuter auto-rickshaw fleets
Goods Carrier 20.0% CAGR (2026–2035) E-commerce last-mile delivery


Passenger carriers dominate the Electric Three Wheeler Market, reflecting the enormous installed base of auto-rickshaws across India, Bangladesh, and Southeast Asia. These vehicles typically operate 80–120 km per day in dense urban corridors, a duty cycle ideally matched to current battery capacities. Goods carriers, though a smaller share today, are growing at nearly double the market-average CAGR as logistics operators convert from ICE delivery vehicles. Fleet procurement contracts from Amazon, Flipkart, and regional e-grocery platforms are the primary volume accelerant for this segment [8].

By Battery Type

Segment Key Metric Primary Demand Driver
Lead-Acid ~59% share (2025) Low acquisition cost in price-sensitive markets
Lithium-Ion 22.5% CAGR (2026–2035) TCO parity, higher energy density, longer cycle life


Lead-acid systems still hold the majority of the electric three-wheeler market by installed base, particularly among unbranded and semi-organized assemblers in India's Tier-2 and Tier-3 cities. Lithium-ion is closing the gap rapidly — pack prices below USD 120/kWh make the total-cost-of-ownership argument compelling for any vehicle running more than 60 km per day [2]. OEMs, including Mahindra, Piaggio, and Kinetic Green, now default to lithium-ion across their flagship electric three-wheeler ranges, accelerating the technology shift from the supply side.

By Power Output

Segment Key Metric Primary Demand Driver
Less Than 2 kW USD 0.42 Billion (2025) Low-speed neighbourhood vehicles
2–4 kW ~47% share (2025) Standard urban passenger three-wheelers
4–6 kW 17.2% CAGR (2026–2035) Higher-payload goods carriers
Above 6 kW USD 0.22 Billion (2025) Highway-rated and heavy-duty models


The 2–4 kW segment is the backbone of the Electric Three Wheeler Market, covering the majority of urban passenger vehicles that operate at speeds of 25–40 km/h. The 4–6 kW segment is growing fastest as goods-carrier platforms and premium passenger models require greater power to handle heavier payloads and faster duty cycles. Above-6-kW models remain a niche but are gaining traction for inter-city and highway-rated three-wheelers in markets that allow higher top speeds.

By Charging Model

Segment Key Metric Primary Demand Driver
Fixed (Plug-In) Charging ~82% share (2025) Low infrastructure cost, home/depot charging
Battery Swapping 25.8% CAGR (2026–2035) Zero downtime for high-utilization fleets


Fixed plug-in charging dominates the Electric Three Wheeler Market because it requires minimal infrastructure — drivers charge overnight at home or at fleet depots using standard outlets. Battery swapping, however, is the faster-growing model and a transformative force for fleet operators who cannot afford multi-hour midday charging breaks. The interoperability challenge — standardizing pack form factors across OEMs — remains the primary barrier to scaling swapping beyond proprietary networks [3].

Regional Market Share Analysis

Region Key Metric Primary Investment Themes
Asia-Pacific ~77% share (2025) Subsidy programmes, swapping networks, OEM competition
Europe ~8% share (2025) L-category ZEV mandates, municipal green zones
Middle East & Africa 21.0% CAGR Urbanization, import duty exemptions
North America USD 0.20 Billion (2025) Campus/warehouse fleet electrification
South America USD 0.16 Billion (2025) Urban cargo pilots, fuel subsidy reform
Total USD 3.90 Billion (2025)

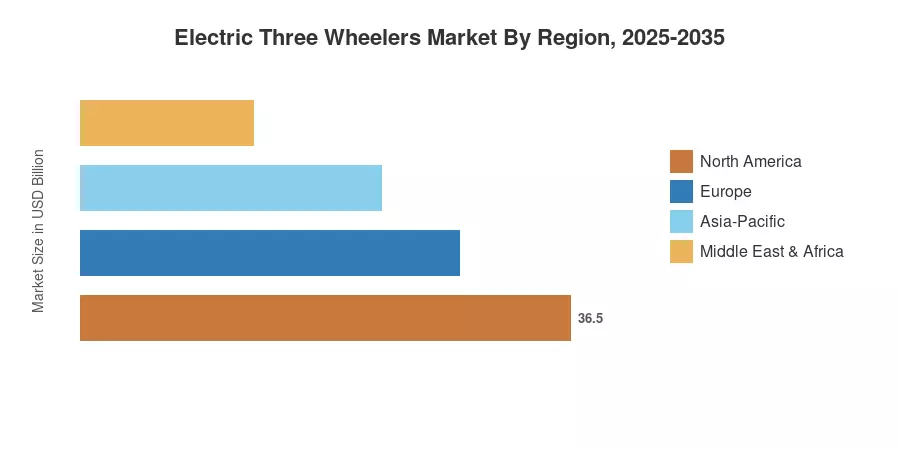
The Electric Three Wheeler Market displays a pronounced regional asymmetry, with Asia-Pacific dominating in both installed fleet and new registrations, while emerging regions post the highest growth rates.


North America

Country Key Metric Key Driver
US ~62% of regional share IRA Section 45W commercial credits
Canada 14.5% CAGR Provincial fleet electrification mandates
Mexico USD 0.04 Billion Industrial campus logistics demand


North America remains a nascent but accelerating portion of the Electric Three Wheeler Market, with demand concentrated in closed-campus logistics, warehouse complexes, and airport ground-support operations. The US accounts for the largest share within the region, supported by IRA commercial clean vehicle credits of up to USD 7,500 per unit [6]. Canada's federal ZEV mandate and British Columbia's fleet electrification targets are pushing municipal and campus operators to evaluate three-wheeler platforms for short-range cargo movement.

Europe

Country Key Metric Key Driver
Germany ~24% of regional share Urban micro-mobility regulations
UK 16.8% CAGR ULEZ expansion and L-category incentives
France USD 0.05 Billion Municipal zero-emission delivery zones
Italy ~15% of regional share Piaggio's home-market advantage
Spain 15.2% CAGR Tourism-sector electric tuk-tuk adoption
Nordic Countries USD 0.02 Billion Cold-climate battery R&D initiatives
Russia ~3% of regional share Limited regulatory support
Rest of Europe USD 0.03 Billion Fragmented but emerging interest


The European Electric Three Wheeler Market benefits from stringent L-category CO₂ standards under EU Regulation 168/2013 and expanding urban low-emission zones. Germany and Italy together represent nearly 40% of regional revenue, with Piaggio's Apé E-City holding strong brand recognition in Southern European cities [15]. The UK's Ultra Low Emission Zone (ULEZ) expansion into outer London boroughs has created immediate demand for electric last-mile delivery vehicles, accelerating fleet trials by operators like DPD and Evri.

Asia-Pacific

Country Key Metric Key Driver
China ~35% of regional share Provincial NEV mandates, domestic OEM scale
India 17.5% CAGR PM E-DRIVE, FAME-III pipeline, swapping infra
Japan USD 0.08 Billion Aging-society mobility solutions
South Korea 14.3% CAGR Urban logistics electrification incentives
ASEAN ~12% of regional share Bangkok, Jakarta congestion policies
Rest of Asia-Pacific USD 0.10 Billion Bangladesh, Nepal, and Sri Lanka growth corridors


Asia-Pacific is the gravitational centre of the Electric Three Wheeler Market. China's provincial NEV mandates have pushed domestic manufacturers to scale production, while India's PM E-DRIVE programme and expanding battery swapping infrastructure have created the world's largest addressable base of electric auto-rickshaws [1][3]. ASEAN markets — particularly Thailand and Indonesia — are transitioning urban tuk-tuk fleets to electric powertrains under municipal congestion-reduction programmes, adding a second growth tier to the region.

South America

Country Key Metric Key Driver
Brazil ~52% of regional share Urban cargo trike pilots in São Paulo
Argentina 13.8% CAGR Provincial EV import incentives
Rest of South America USD 0.04 Billion Colombia, Peru, and narrow-street logistics pilots


South America's Electric Three Wheeler Market is at an early stage but gathering momentum. Brazil dominates regional revenue, with São Paulo and Rio de Janeiro piloting electric cargo trikes for last-mile delivery in congested historic centres. Argentina's provincial governments have introduced import duty reductions for electric light vehicles, though macroeconomic volatility tempers near-term growth expectations [16].

Middle East & Africa

Country Key Metric Key Driver
Saudi Arabia ~22% of regional share Vision 2030 transport diversification
UAE 18.5% CAGR Smart-city fleet procurement
South Africa USD 0.03 Billion Minibus-taxi electrification studies
Egypt 22.0% CAGR Cairo congestion, CNG-to-electric transition
Rest of MEA ~35% of regional share Kenya, Nigeria, Tanzania, urbanization-driven demand


The Middle East & Africa represents the fastest-growing region for the Electric Three Wheeler Market, projected at a 21.0% CAGR through 2035. East African cities such as Nairobi and Dar es Salaam are witnessing grassroots adoption of imported Chinese electric three-wheelers as motorcycle-taxi alternatives. Kenya's 2024 import-duty exemption for electric vehicles and Nigeria's NADDC electric vehicle roadmap are creating nascent but directionally strong policy support [4]. In the Gulf states, smart-city developments in Riyadh and Dubai are incorporating electric three-wheelers for gated-community and mixed-use-district mobility.

Electric Three Wheelers Market By Region, 2025-2035

Competitive Benchmarking

The Electric Three Wheeler Market exhibits medium concentration, with the top five players accounting for an estimated 35–45% of global revenue. The remaining market is fragmented across dozens of regional assemblers, particularly in India, where semi-organized manufacturers serve Tier-2 and Tier-3 cities. Competition is intensifying as established automotive groups enter the segment alongside EV-native startups, and differentiation increasingly hinges on battery partnerships, swapping-network access, and fleet-management software.

Company Est. Revenue Share Range Key Offerings Strategic Positioning
Mahindra Electric Mobility ~8–12% Treo, Treo Zor (passenger & cargo) Vertically integrated, strong dealer network
Piaggio Vehicles Pvt. Ltd. ~6–9% Apé E-City, Apé E-Xtra European heritage, brand trust in Southern Europe & India
Bajaj Auto Limited ~5–8% RE EV (pilot programme) Scale manufacturing, export-oriented
Kinetic Green Energy ~4–7% Safar, Kinetic Zing Aggressive pricing, wide rural distribution
Lohia Auto Industries ~3–6% Comfort, Narain series Budget segment, lead-acid stronghold
Atul Auto Limited ~3–5% Elit series Gujarat-based, CNG-to-EV transition portfolio
Terra Motors Corporation ~2–4% Y4A, delivery three-wheelers Japan-engineered, Southeast Asia focus
Omega Seiki Mobility ~2–4% Rage+, Stream Cargo-first strategy, fleet partnerships
Euler Motors ~2–3% HiLoad EV Purpose-built cargo, Amazon India supplier
YC Electric Vehicle ~2–3% Urban passenger & cargo models Chinese volume producer, Africa/ASEAN export


Recent News & Developments


  • Kenya Revenue Authority (June 2024): Exempted all fully electric vehicles, including three-wheelers, from import duty — the first such blanket exemption in East Africa [4].


  • EU Commission (February 2024): Published revised CO₂ fleet standards under Regulation 168/2013, setting a 2030 pathway for zero-emission L-category vehicles, including three-wheelers [15].
  • Sun Mobility (November 2023): Partnered with Gogoro to develop interoperable battery swapping standards for three-wheelers across India and Southeast Asia [3].

Electric Three Wheelers Market Report Scope

Parameter Detail
Market Scope Global Electric Three Wheeler Market — passenger carrier, goods carrier, all battery types, all power outputs, all charging models
Study Period 2021–2035
CAGR (Forecast) 14.0% (2026–2035)
Base Year Market Size USD 3.90 Billion (2025)
Forecast Endpoint USD 14.65 Billion (2035)
Fastest Growing Segment Battery Swapping (25.8% CAGR)
Companies Profiled 10 (Mahindra, Piaggio, Bajaj, Kinetic Green, Lohia, Atul, Terra Motors, Omega Seiki, Euler Motors, YC Electric Vehicle)
Valuation Currency USD Billion


FAQs

How do electric three-wheeler residual values compare to ICE equivalents after five years of fleet operation?
Electric three-wheelers retain 25–35% of their original value after five years, versus 15–20% for ICE equivalents, largely because electric drivetrains have fewer wear components. Battery condition is the primary variable affecting resale pricing [9].
What safety certification gaps exist for electric three-wheelers sold in African markets?
Most African nations lack dedicated homologation standards for L-category electric vehicles, forcing importers to rely on Indian AIS-156 or EU Regulation 168/2013 certifications. This regulatory vacuum allows uncertified vehicles into circulation [21].
How does monsoon-season flooding in South Asia affect battery durability and warranty claims?
IP67-rated lithium-ion packs withstand shallow submersion, but extended flood exposure voids most OEM warranties. Fleet operators in flood-prone cities like Dhaka and Patna increasingly demand IP68-rated enclosures [19].
What financing structures are most effective for first-time owner-operators in Tier-3 Indian cities?
Microfinance-backed hire-purchase plans with daily repayment schedules aligned to fare collection have the lowest default rates, typically under 4%. NBFCs like Shriram Transport Finance are expanding dedicated EV loan products [16].
Can electric three-wheelers operate viably in cold climates below −10°C?
Lithium-ion range drops 20–30% at sustained sub-zero temperatures due to increased internal resistance. Thermal management systems add USD 150–200 per vehicle but are essential for Nordic or high-altitude deployments [12].
How do interoperability challenges affect battery swapping scalability across OEM brands?
No universal pack standard exists today; most swapping networks operate with proprietary form factors tied to one or two OEM partners. Industry-led standardization efforts remain in early consultation phases [3].
What role do electric three-wheelers play in corporate Scope 3 emission reduction strategies?
Logistics companies using electric three-wheelers for last-mile delivery can report verified Scope 3 reductions under the GHG Protocol. Each converted vehicle eliminates approximately 3–4 tonnes of CO₂ annually [13].    
Author
Author
Author Profile
Shubham Munde LinkedIn
Team Lead - Research
Shubham brings over 7 years of expertise in Market Intelligence and Strategic Consulting, with a strong focus on the Automotive, Aerospace, and Defense sectors. Backed by a solid foundation in semiconductors, electronics, and software, he has successfully delivered high-impact syndicated and custom research on a global scale. His core strengths include market sizing, forecasting, competitive intelligence, consumer insights, and supply chain mapping. Widely recognized for developing scalable growth strategies, Shubham empowers clients to navigate complex markets and achieve a lasting competitive edge. Trusted by start-ups and Fortune 500 companies alike, he consistently converts challenges into strategic opportunities that drive sustainable growth.
Co-Author
Co-Author Profile
Swapnil Palwe LinkedIn
Team Lead - Research
With a technical background as Bachelor's in Mechanical Engineering, with MBA in Operations Management , Swapnil has 6+ years of experience in market research, consulting and analytics with the tasks of data mining, analysis, and project execution. He is the POC for our clients, for their consulting projects running under the Automotive/A&D domain. Swapnil has worked on major projects in verticals such as Aerospace & Defense, Automotive and many other domain projects. He has worked on projects for fortune 500 companies' syndicate and consulting projects along with several government projects.

Research Approach

Research Methodology on Electric Three-Wheelers Market

The research methodology applied in this report is based on a thorough analysis of the electric three-wheelers market. This report is conducted using both primary and secondary research methods, in order to provide the most accurate analysis possible.

Primary Research

The primary research methodology used for this report includes a thorough analysis of the various market participants and their activities in the electric three-wheelers market. This includes in-depth interviews with key stakeholders in the industry, such as manufacturers, distributors, and retailers. Additionally, a survey is also conducted to gain insight into the current level of industry knowledge and the overall market sentiment.

Secondary Research

The secondary research methodology involves conducting a detailed analysis of existing data sources, such as trade journals, reports, whitepapers, and company websites. Additionally, industry-specific databases and statistical software tools are used to compile and analyze the existing market data. This includes analyzing the industry trends and developments, as well as the overall competitive dynamics in the electric three-wheelers market.

Data Triangulation

In addition to the primary and secondary research, the research methodology involves analyzing the market data with the help of data triangulation methods. This is done to cross-check the market information gathered through the primary and secondary research methods and to ensure the accuracy of the data.

Market Estimation and Forecasting Model

The market estimation and forecasting model used in this report is based on a combination of top-down and bottom-up approaches. The top-down approach is used to estimate the global electric three-wheelers market size, while the bottom-up approach is used to estimate the market size of the various industry segments.

Population and Sample Selection

The population and sample selection process for this report includes a detailed analysis of various companies operating in the electric three-wheelers market. A stratified sampling method is used to select the sample size for this report, based on the size, scope, and type of company.

Data Collection

The data collection process for this report includes detailed surveys, interviews and conferences with key stakeholders in the industry. Additionally, the necessary market information is also collected from various primary and secondary sources, such as industry associations, government sources, and trade journals.

Download Free Sample

Kindly complete the form below to receive a free sample of this Report

Download PDF ×

We do not share your information with anyone. However, we may send you emails based on your report interest from time to time. You may contact us at any time to opt-out.
















