Energy as a Service Market

Energy as a Service (EaaS) Market Size, Share and Research Report: By Service Type (Energy Management Services, Demand Response Services, Distributed Energy Resource Management Services, Energy Supply Services), By End User (Residential, Commercial, Industrial, Government), By Energy Source (Renewable Energy, Conventional Energy, Hybrid Energy), By Solution Type (Software Solutions, Hardware Solutions, Integrated Solutions) and By Regional (North America, Europe, South America, Asia Pacific, Middle East and Africa) - Industry Forecast to 2035
ID: MRFR/ICT/5146-HCR
200 Pages
Nirmit Biswas, Aarti Dhapte
Last Updated: May 25, 2026
 

Market Summary

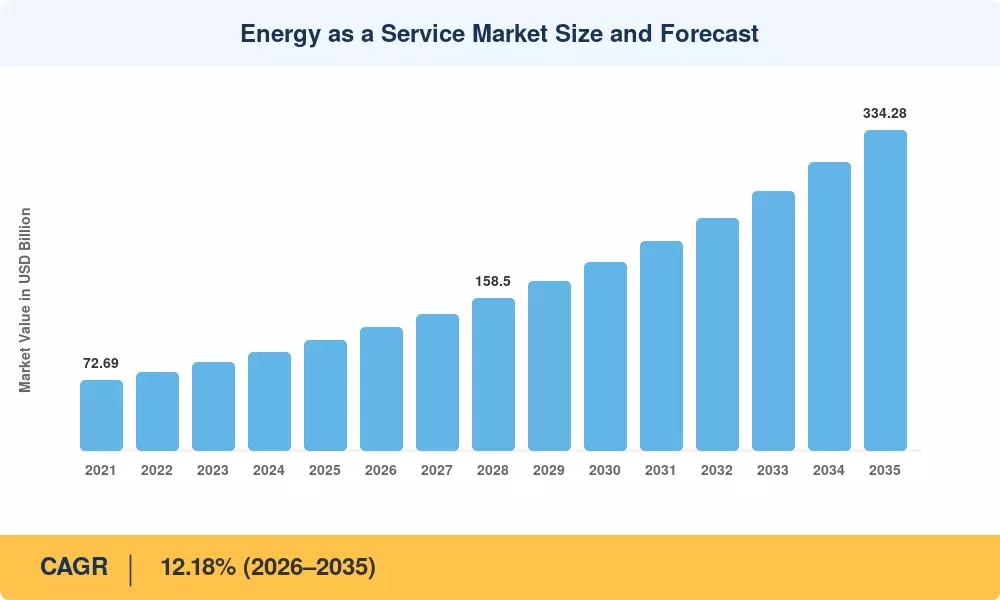
The Energy as a Service Market reached USD 115.12 Billion in 2025 and is projected to expand from USD 128.24 Billion in 2026 to USD 334.28 Billion by 2035, registering a CAGR of 12.18% across the forecast window. Corporate decarbonization pledges and the financial logic of converting capital expenditures into predictable operating costs are propelling demand for managed energy-as-a-service for commercial buildings. The Inflation Reduction Act alone unlocked over USD 369 Billion in clean-energy incentives, directly improving the unit economics of power-purchase agreements via EaaS providers and on-site solar and storage as a service contracts [2].

A structural technology shift is redefining how organizations procure and consume electricity. Legacy utility procurement—dominated by fixed tariffs and siloed asset ownership—is giving way to bundled subscription contracts that combine distributed generation, battery storage, intelligent load control, and real-time analytics. BloombergNEF estimates that global corporate clean-energy procurement surpassed 50 GW annually by 2024, with EaaS for renewable energy procurement accounting for a growing share of that volume [3]. Energy efficiency financing through EaaS models allows mid-market tenants to access upgrades previously limited to investment-grade portfolios.

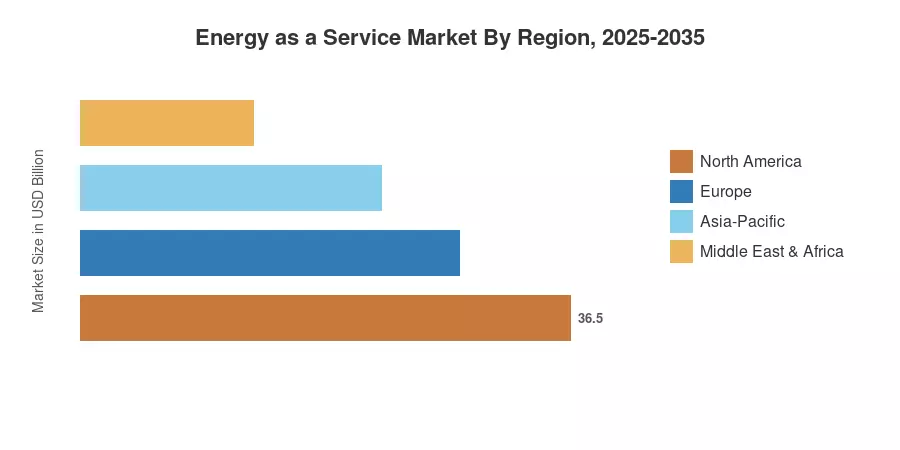
North America commanded roughly 45.1% of the Energy as a Service Market in 2025, underpinned by favorable tax-credit stacking and aggressive state-level renewable portfolio standards Asia-Pacific recorded the fastest regional CAGR at 17.62%, fueled by India's Production-Linked Incentive schemes and China's carbon-trading mandates. Europe held the second-largest share at approximately 26.3%, supported by the EU Energy Performance of Buildings Directive. The decade ahead will be defined by how quickly EaaS platforms scale AI-driven optimization and cross-border service delivery.

Key Report Takeaways

• By Service Type

  • Energy Supply Services captured the largest segment of the Energy as a Service Market in 2025, accounting for 41.8% of global revenue
  • Microgrid-as-a-Service is set to grow at a 15.2% CAGR through 2035, driven by resilience-focused procurement from hospital networks and data-center operators
  • Energy Infrastructure Services generated approximately USD 27.4 Billion in 2025

• By Service-Delivery Model

  • Pay-for-Service held 42.3% of the Energy as a Service Market share in 2025, reflecting enterprise preference for outcome-based contracts
  • Leasing and Rental models are advancing at a 19.5% CAGR, making on-site solar and storage as a service accessible to smaller commercial tenants

• By Technology

  • Distributed Generation represented 38.6% of the Energy as a Service Market in 2025
  • EV-Charging Infrastructure is expanding at a 21.3% CAGR through 2035, as fleet electrification accelerates managed energy-as-a-service for commercial buildings

• By End User

  • Commercial facilities accounted for 67.2% of 2025 revenue in the Energy as a Service Market
  • Industrial customers are forecast to grow at a 14.8% CAGR to 2035

• By Region

  • North America led the Energy as a Service Market with a 45.1% share in 2025
  • Asia-Pacific registered the fastest CAGR at 17.62% through 2035
  • --

MRFR's sizing methodology triangulates top-down revenue analysis (utility and vendor filings), bottom-up project-level aggregation, and secondary validation against IEA and BloombergNEF benchmarks[3]. Historical figures reflect actual contract values; forecast values incorporate policy-adjusted demand curves and technology cost-decline trajectories.

Market Size Chart
Our Impact
Enabled $4.3B Revenue Impact for Fortune 500 and Leading Multinationals
Partnering with 2000+ Global Organizations Each Year
30K+ Citations by Top-Tier Firms in the Industry
 

Driver Impact Analysis

Driver ~% Impact on CAGR Geographic Relevance Impact Timeline
Corporate net-zero mandates ~18% Global Short-term (≤2 yr)
Tax-credit stacking (IRA, EU Green Deal) ~16% North America, Europe Short-term (≤2 yr)
Battery storage cost decline ~14% Global Medium-term (2–4 yr)
Grid-reliability and resilience concerns ~13% North America, Asia-Pacific Medium-term (2–4 yr)
AI-driven energy analytics adoption ~12% Global Long-term (≥4 yr)
Fleet electrification and EV-charging demand ~11% Europe, Asia-Pacific Medium-term (2–4 yr)
Emerging-market urbanization ~9% Asia-Pacific, MEA Long-term (≥4 yr)


Corporate Net-Zero Mandates

Over 6,000 companies worldwide have committed to Science-Based Targets, and their Scope 2 emissions reductions increasingly hinge on power-purchase agreements via EaaS providers rather than unbundled renewable energy certificates [9]. The RE100 initiative alone represents more than 400 TWh of annual clean-electricity demand, creating a built-in customer base for energy efficiency financing through EaaS models. This driver exerts the strongest near-term pull on the Energy as a Service Market because procurement timelines for corporate PPAs typically range from 12 to 24 months.

Tax-Credit Stacking Under the IRA and EU Green Deal

The Inflation Reduction Act's direct-pay and transferability provisions allow tax-exempt entities—universities, hospitals, municipalities—to monetize investment tax credits for the first time, enlarging the addressable base for managed energy-as-a-service for commercial buildings [2]. In parallel, the EU's REPowerEU program earmarked EUR 210 Billion for accelerated renewables deployment, with concessional financing that improves returns for EaaS for renewable energy procurement projects. Combined, these policy mechanisms compress payback periods to under five years for on-site solar and storage as a service installations.

Battery Storage Cost Decline

BloombergNEF's 2024 Battery Price Survey placed lithium-ion pack prices at USD 115/kWh, down 14% year-over-year [5]. Falling storage costs directly expand the economic envelope for distributed generation bundled into EaaS contracts because behind-the-meter batteries unlock demand-charge management and ancillary-service revenues. By 2028, MRFR expects pack prices to cross the USD 80/kWh threshold, making four-hour-duration systems economically viable for mid-size commercial tenants.

Grid-Reliability and Resilience Concerns

Extreme-weather events caused over USD 90 Billion in insured losses in 2023 alone, and aging transmission infrastructure in the United States faces a USD 2.5 Trillion upgrade bill through 2035 according to DOE estimates [10]. Managed energy-as-a-service for commercial buildings that incorporate microgrid islanding and backup storage address a tangible risk that traditional grid-only procurement cannot mitigate. This resilience premium is a powerful differentiator for EaaS providers competing against commodity retail electricity contracts.


Restraints Impact Analysis

Restraint ~% Negative Impact on CAGR Geographic Relevance Impact Timeline
Complex multi-party contract structures ~−4% Global Short-term
Utility-franchise and regulatory barriers ~−3% North America, Europe Medium-term
Counterparty credit risk for long-term PPAs ~−3% Global Medium-term
Interconnection queue delays ~−2% North America Short-term
Technology performance uncertainty in nascent solutions ~−2% Global Long-term


Complex Multi-Party Contract Structures

EaaS agreements often layer equipment leases, energy-supply contracts, performance guarantees, and maintenance obligations across three to five counterparties. Negotiation cycles can stretch to 18 months, deterring mid-market commercial tenants who lack in-house energy counsel [12]. Standardized contract templates from organizations like NREL's Better Buildings initiative are emerging but remain voluntary, limiting their impact on the Energy as a Service Market in the near term.

Utility-Franchise and Regulatory Barriers

In roughly half of U.S. states, utility franchise rules restrict third-party ownership of generation assets connected to the distribution grid, constraining on-site solar and storage as a service deployment [13]. Similar restrictions exist under EU unbundling directives for vertically integrated utilities. These regulatory frictions slow project pipelines and increase legal costs, particularly for power-purchase agreements via EaaS providers operating across multiple jurisdictions.

Interconnection Queue Delays

The Lawrence Berkeley National Laboratory reported that the U.S. interconnection queue held over 2,600 GW of proposed projects at year-end 2023, with average wait times exceeding 4.5 years [10]. Queue congestion delays revenue recognition for distributed generation projects within EaaS portfolios and increases developer carrying costs.


Opportunities

AI-Optimized Energy Management Platforms

Machine-learning algorithms that forecast load, price, and weather simultaneously can boost behind-the-meter asset utilization by 15–25%, according to EPRI modeling [7]. EaaS providers that embed these capabilities into subscription contracts gain a differentiation layer that pure-play equipment lessors cannot replicate, expanding margins while deepening managed energy-as-a-service for commercial buildings relationships

Emerging-Market Electrification via EaaS

Sub-Saharan Africa and South Asia remain home to roughly 760 million people without reliable electricity access [8]. Mini-grid-as-a-service models—financed through blended capital structures involving DFIs, commercial lenders, and impact funds—can bypass centralized grid buildout altogether. The Energy as a Service Market stands to capture a multi-billion-dollar addressable opportunity as development banks scale concessional lending for distributed energy resources

Data Monetization and Carbon-Credit Aggregation

Every EaaS contract generates granular consumption, generation, and carbon-intensity data. Aggregating this data into verified carbon credits—tradeable on voluntary markets—creates a secondary revenue stream for EaaS for renewable energy procurement providers With voluntary carbon-credit prices projected to rise above USD 50/tonne by 2030, data monetization could add 200–400 basis points to provider gross margins [15].

Fleet Electrification and Charging-as-a-Service

Commercial fleets transitioning to battery-electric vehicles require depot-level charging infrastructure, demand-management software, and grid-interaction capabilities that align naturally with energy efficiency financing through EaaS models [11]. This convergence between transport electrification and building energy management is opening a greenfield segment within the Energy as a Service Market

Resilience-as-a-Service for Critical Infrastructure

Hospitals, water-treatment plants, and telecommunications towers face escalating climate-related outage risks. Microgrid-based resilience packages—bundled into long-term service contracts—allow facility operators to guarantee uptime without balance-sheet exposure FERC Order 2222, which enables distributed-energy aggregation in wholesale markets, further improves the revenue stack for these deployments [13].


Future Outlook

AI-Autonomous Energy Optimization

By 2030, EPRI projects that AI-driven grid-edge controllers will manage over 40% of commercial building energy loads in developed markets [7]. Autonomous demand-response orchestration—where algorithms bid behind-the-meter flexibility into wholesale markets in real time—will transform managed energy-as-a-service for commercial buildings from a cost-savings play into a profit center. The Energy as a Service Market will increasingly reward providers that own proprietary optimization stacks.

Platform Economics and Ecosystem Aggregation

The EaaS sector is converging toward platform models where single providers aggregate generation, storage, EV charging, and carbon accounting into unified dashboards. Power-purchase agreements via EaaS providers will evolve into multi-commodity contracts covering electricity, thermal energy, and carbon offsets, mirroring the platform bundling seen in SaaS. MRFR expects the top five platforms to capture over 30% of the Energy as a Service Market by 2032.

Electrification Supercycle and Sector Coupling

The IEA's Net Zero Emissions Scenario calls for global electricity demand to double by 2050, driven by heat-pump adoption, EV penetration, and industrial electrification [3]. On-site solar and storage as a service will expand beyond buildings into industrial process heating and hydrogen production, adding new verticals to the Energy as a Service Market. Sector-coupling platforms that simultaneously manage electrical and thermal loads represent a USD 40 Billion incremental opportunity by 2035.

ESG Reporting and Verified Carbon Disclosure

The EU's Corporate Sustainability Reporting Directive and the SEC's climate-disclosure rule (pending finalization) require auditable Scope 2 emissions data tied to specific generation assets [15]. EaaS for renewable energy procurement contracts that embed 24/7 carbon-free energy matching provide the data granularity these regulations demand. Energy efficiency financing through EaaS models thus becomes a compliance infrastructure—not just a cost play—for multinational corporations navigating divergent reporting regimes.


Market Segmentation

By Service Type

Segment Metric Primary Demand Driver
Energy Supply Services 41.8% share (2025) Corporate PPA volumes and renewable procurement targets
Microgrid-as-a-Service 15.2% CAGR (2026–2035) Resilience demand from healthcare and data centers
Energy Infrastructure Services USD 27.4 Billion (2025) Building-envelope and HVAC upgrade financing
Other Service Types 8.7% share (2025) Consulting, energy auditing, and advisory services


Energy Supply Services dominate the Energy as a Service Market because they address the largest single line item on commercial energy budgets—electricity procurement. Power-purchase agreements via EaaS providers have become the default instrument for Fortune 500 companies pursuing Scope 2 reductions without balance-sheet encumbrance. Microgrid-as-a-Service is the fastest-growing service type, driven by hospitals, military installations, and hyperscale data centers seeking guaranteed uptime through islanding-capable distributed generation paired with battery storage.

By Service-Delivery Model

Segment Metric Primary Demand Driver
Pay-for-Service 42.3% share (2025) Outcome-based pricing preferences among large enterprises
Leasing and Rental Models 19.5% CAGR (2026–2035) Capex-avoidance needs of mid-market commercial tenants
Other Models USD 11.62 Billion (2025) Shared-savings and performance contracting


Pay-for-Service contracts lead the Energy as a Service Market because they align provider incentives with customer outcomes—energy cost reduction, emissions abatement, or uptime guarantees. Leasing and Rental models are scaling rapidly as on-site solar and storage as a service offerings extend to tenants who cannot modify building infrastructure under triple-net lease arrangements. Energy efficiency financing through EaaS models within shared-savings structures is gaining traction in the public sector, where procurement rules favor operational expenditure.

By Technology

Segment Metric Primary Demand Driver
Distributed Generation 38.6% share (2025) Rooftop and carport solar economics
EV-Charging Infrastructure 21.3% CAGR (2026–2035) Fleet electrification mandates
Other Technologies USD 18.37 Billion (2025) Energy storage, demand response, smart controls


Distributed Generation anchors the technology mix of the Energy as a Service Market, with rooftop solar PV installations representing the most mature and bankable asset class within EaaS portfolios. EV-Charging Infrastructure is the fastest-expanding technology segment, as fleet operators bundle depot-level chargers with energy management software through managed energy-as-a-service for commercial buildings contracts that guarantee per-mile electricity costs.

By End User

Segment Metric Primary Demand Driver
Commercial 67.2% share (2025) Office, retail, and healthcare facility energy procurement
Industrial 14.8% CAGR (2026–2035) Process-heat electrification and carbon-intensity reduction


Commercial end users dominate the Energy as a Service Market because multi-tenant office buildings, retail portfolios, and healthcare campuses face immediate regulatory and reputational pressure to decarbonize. Industrial customers are the faster-growing end-user segment, as heavy manufacturers explore EaaS for renewable energy procurement to replace fossil-fired process heat and comply with emerging carbon border adjustment mechanisms


Regional Market Share Analysis

Region Metric Primary Investment Themes
North America 45.1% share (2025) IRA tax credits; grid resilience; corporate PPAs
Europe 26.3% share (2025) EU Green Deal; EPBD renovation wave; offshore wind PPAs
Asia-Pacific 17.62% CAGR (2026–2035) India PLI; China carbon trading; ASEAN grid interconnection
South America USD 4.72 Billion (2025) Brazil distributed generation; Chilean green hydrogen
Middle East & Africa 14.9% CAGR (2026–2035) Saudi Vision 2030; UAE net-zero 2050; mini-grid electrification
Total USD 115.12 Billion (2025)

The Energy as a Service Market exhibits pronounced regional variation driven by regulatory frameworks, grid maturity, and corporate sustainability ambitions. North America remains the dominant geography, while Asia-Pacific is accelerating fastest, and Europe holds a strong second position, anchored by aggressive EU decarbonization policy.


North America

Country Metric Key Driver
United States 78.4% of regional revenue IRA direct-pay; state RPS mandates [2]
Canada 13.14% CAGR Federal Clean Electricity Standard [16]
Mexico USD 3.18 Billion (2025) CFE reform and behind-the-meter DG growth [17]


The United States underpins North America's dominance in the Energy as a Service Market, with IRA-enabled tax-credit transferability channeling institutional capital into power-purchase agreements via EaaS providers. Canada's Clean Electricity Standard, targeting a net-zero grid by 2035, is catalyzing managed energy-as-a-service for commercial buildings across provinces with coal-dependent generation mixes. Mexico's 2024 regulatory reforms opened distributed generation to private investment, unlocking latent demand for on-site solar and storage as a service among industrial parks in Monterrey and Guadalajara [17].

Europe

Country Metric Key Driver
Germany 23.7% of regional revenue Energiewende; Gebäudeenergiegesetz building code [4]
United Kingdom 15.42% CAGR Contracts for Difference Round 6 [18]
France USD 4.12 Billion (2025) Nuclear-solar hybrid EaaS models [19]
Italy 11.8% of regional revenue Superbonus 110% renovation incentive [4]
Spain 14.6% CAGR Self-consumption royal decree [20]
Nordic Countries USD 2.95 Billion (2025) District heating modernization
Russia 3.1% of regional revenue Limited EaaS penetration due to state energy control
Rest of Europe 12.8% CAGR EU cohesion fund-backed projects


Europe's Energy as a Service Market benefits from the EU Energy Performance of Buildings Directive, which mandates near-zero-energy standards for new construction starting 2030 and energy efficiency financing through EaaS models for deep retrofits [4]. The UK's Contracts for Difference framework continues to de-risk EaaS for renewable energy procurement by guaranteeing long-term price floors for generation assets bundled into service contracts.

Asia-Pacific

Country Metric Key Driver
China 36.5% of regional revenue Carbon ETS expansion; distributed solar mandates [6]
India 21.8% CAGR PLI scheme; PM-KUSUM rooftop solar programme [6]
Japan USD 3.87 Billion (2025) GX Transition Bonds; corporate RE100 commitments [21]
South Korea 16.3% CAGR 10th Basic Energy Plan targets [21]
ASEAN USD 2.54 Billion (2025) ADB Energy Transition Mechanism [8]
Rest of Asia-Pacific 15.1% CAGR Grid-modernization investments


Asia-Pacific is the fastest-growing region within the Energy as a Service Market, propelled by India's aggressive distributed-solar targets and China's expanding carbon-emission trading scheme. Japan's GX Transition Bonds, worth over JPY 20 Trillion, are channelling public-private capital into on-site solar and storage as a service projects at scale [21]. ASEAN's Energy Transition Mechanism, supported by the Asian Development Bank, is creating bankable frameworks for managed energy-as-a-service for commercial buildings across the Philippines, Indonesia, and Vietnam.

South America

Country Metric Key Driver
Brazil 62.3% of regional revenue Net-metering resolution 482/2012 expansion [22]
Argentina 13.6% CAGR RenovAr auctions for renewables [22]
Rest of South America USD 0.98 Billion (2025) Chile green-hydrogen corridor development


Brazil dominates South America's Energy as a Service Market segment, with net-metering regulations driving explosive growth in distributed solar installations exceeding 30 GW cumulative capacity by 2025. Chile's emerging green-hydrogen export strategy is layering new demand for industrial-scale EaaS for renewable energy procurement contracts tied to electrolyzer operations [22].

Middle East & Africa

Country Metric Key Driver
Saudi Arabia 31.4% of regional revenue Vision 2030 renewable targets [23]
UAE 17.1% CAGR Net-zero 2050 strategy; DEWA programmes [23]
South Africa USD 0.84 Billion (2025) Load-shedding-driven behind-the-meter demand [8]
Egypt 14.2% CAGR NREA feed-in tariff programme
Rest of MEA USD 0.67 Billion (2025) Mini-grid electrification programmes


The Middle East & Africa region exhibits bifurcated dynamics within the Energy as a Service Market. Gulf states are pursuing utility-scale solar PPAs under sovereign sustainability mandates, while Sub-Saharan African nations are deploying pay-as-you-go mini-grid models that align perfectly with energy efficiency financing through EaaS models for off-grid communities [23].


Regional Market Share
 

Competitive Benchmarking

The Energy as a Service Market exhibits medium concentration, with a top-five combined share estimated at 28–34% and a Herfindahl-Hirschman Index below 1,000, indicating a fragmented competitive field. Providers differentiate along technology breadth, geographic coverage, and the sophistication of their analytics and energy efficiency financing through EaaS models platforms.

Company Est. Revenue Share Range Key Offerings Strategic Positioning
Schneider Electric ~6–9% EcoStruxure platform; microgrid design; sustainability consulting Integrated energy management across building and grid-edge
Enel X (Enel Group) ~5–8% Distributed generation; demand response; EV charging Global utility-backed platform with distributed energy scale
ENGIE Impact ~4–7% Sustainability advisory; on-site generation; power-purchase agreements via EaaS providers Full-stack decarbonization for multinational corporates
Honeywell ~4–6% Building automation; battery storage; grid-edge analytics Deep building-controls integration
Siemens Energy ~3–6% Distributed energy; microgrid controls; smart-grid software Industrial-grade infrastructure and digital-twin capabilities
Centrica Business Solutions ~3–5% On-site solar and storage as a service; CHP; flexibility services UK/Europe-focused mid-market specialist
Ameresco ~2–4% Energy-efficiency retrofits; performance contracting; DG U.S. federal and municipal project expertise
Budderfly ~1–3% End-to-end EaaS for QSR and retail chains Niche vertical focus with turnkey efficiency solutions
GridPoint ~1–3% AI-driven building energy management; IoT controls Software-first managed energy-as-a-service for commercial buildings
Sparkfund ~1–2% Equipment-as-a-service financing; technology orchestration FinTech-meets-energy subscription model


Recent News & Developments

  • Schneider Electric (October 2024): Launched AlphaStruxure, a joint venture with Carlyle Group, to offer fully financed microgrids combining on-site solar and storage as a service for commercial real estate portfolios [24].
  • Enel X (July 2024): Expanded its North American demand-response platform to aggregate 6 GW of flexible capacity, strengthening its position in the Energy as a Service Market [25].
  • U.S. Department of Energy (March 2024): Released updated interconnection-reform guidance under FERC Order 2023, aiming to reduce queue processing times for distributed generation projects feeding EaaS portfolios [10].
  • ENGIE Impact (January 2024): Signed a 15-year managed energy-as-a-service for commercial buildings agreement with a Fortune 100 retailer covering 2,000 U.S. stores, the largest single EaaS commercial contract to date [25].
  • Honeywell (September 2023): Acquired SCADAFarm to strengthen AI-driven predictive analytics for EaaS for renewable energy procurement and behind-the-meter asset optimization [7].
  • Centrica Business Solutions (June 2023): Deployed a 50 MWh battery-storage portfolio across UK commercial sites under performance-based energy efficiency financing through EaaS models [18].
  • European Commission (April 2023): Adopted the revised Energy Performance of Buildings Directive, requiring all new buildings to be zero-emission by 2030, accelerating demand within the Energy as a Service Market [4].
 

Report Scope

Parameter Detail
Market Scope Global Energy as a Service Market covering supply services, infrastructure, microgrids, and associated delivery models
Study Period 2021–2035
CAGR 12.18% (2026–2035)
Market Size (2025) USD 115.12 Billion
Market Size (2035) USD 334.28 Billion
Fastest Growing Segment EV-Charging Infrastructure (by technology); Asia-Pacific (by region)
Companies Profiled 10 (Schneider Electric, Enel X, ENGIE Impact, Honeywell, Siemens Energy, Centrica, Ameresco, Budderfly, GridPoint, Sparkfund)
Valuation Currency USD Billion


FAQs

How do EaaS contract durations typically compare with traditional utility agreements?

EaaS contracts generally span 10–25 years, significantly longer than standard 1–3-year retail electricity agreements, because providers must amortize on-site asset investments over extended periods [12]. Longer terms lock in pricing certainty but require robust termination and buy-out clauses.

What credit-rating threshold do EaaS providers typically require from commercial customers?

Most providers target investment-grade counterparties (BBB− or higher), though emerging credit-enhancement structures—such as green-bond-backed guarantees—are extending energy efficiency financing through EaaS models to sub-investment-grade tenants.

How does the Energy as a Service Market address cybersecurity risks in connected building systems?

Providers increasingly embed SOC 2-compliant monitoring and zero-trust architectures into their IoT-enabled energy platforms [7]. Third-party penetration testing and segmented operational-technology networks are becoming baseline contractual requirements.

Can EaaS models integrate green hydrogen production at the building level?

Pilot projects in Japan and Germany are coupling rooftop solar with small-scale electrolyzers under on-site solar and storage as a service frameworks [21]. Commercial viability depends on electrolyzer costs falling below USD 300/kW, expected by 2029.

What role does the Energy as a Service Market play in meeting Scope 3 reporting obligations?

EaaS providers that offer 24/7 carbon-free energy matching generate the granular, time-stamped data Scope 3 auditors require for upstream electricity accounting [15]. This positions EaaS as a compliance tool beyond basic cost management.

How do insurance considerations affect EaaS project structuring in the Energy as a Service Market?

Insurers now require performance-warranty backstops and equipment-failure coverage embedded within EaaS service agreements, adding 50–100 basis points to annual contract costs. Standardized insurance products specific to distributed energy remain underdeveloped.

What distinguishes managed energy-as-a-service for commercial buildings from traditional ESCO performance contracts?

EaaS bundles generation, storage, and analytics ownership on the provider's balance sheet, while ESCOs typically implement retrofits that the customer owns post-installation [12]. The EaaS model eliminates residual-value risk for the customer.

Author
Author
Author Profile
Nirmit Biswas LinkedIn
Senior Research Analyst
With 5+ years of expertise in Market Intelligence and Strategic Research, Nirmit Biswas specializes in ICT, Semiconductors, and BFSI. Backed by an MBA in Financial Services and a Computer Science foundation, Nirmit blends technical depth with business acumen. He has successfully led 100+ projects for global enterprises and startups, including Amazon, Cisco, L&T and Huawei, delivering market estimations, competitive benchmarking, and GTM strategies. His focus lies in transforming complex data into clear, actionable insights that drive growth, innovation, and investment decisions. Recognized for bridging engineering innovation with executive strategy, Nirmit helps businesses navigate dynamic markets with confidence.
Co-Author
Co-Author Profile
Aarti Dhapte LinkedIn
AVP - Research
A consulting professional focused on helping businesses navigate complex markets through structured research and strategic insights. I partner with clients to solve high-impact business problems across market entry strategy, competitive intelligence, and opportunity assessment. Over the course of my experience, I have led and contributed to 100+ market research and consulting engagements, delivering insights across multiple industries and geographies, and supporting strategic decisions linked to $500M+ market opportunities. My core expertise lies in building robust market sizing, forecasting, and commercial models (top-down and bottom-up), alongside deep-dive competitive and industry analysis. I have played a key role in shaping go-to-market strategies, investment cases, and growth roadmaps, enabling clients to make confident, data-backed decisions in dynamic markets.

Research Approach


Secondary Research

The secondary research process involved comprehensive analysis of regulatory databases, peer-reviewed energy journals, policy publications, and authoritative energy organizations. Key sources included the International Energy Agency (IEA), U.S. Energy Information Administration (EIA), International Renewable Energy Agency (IRENA), Federal Energy Regulatory Commission (FERC), European Environment Agency (EEA), National Institute of Standards and Technology (NIST), Institute of Electrical and Electronics Engineers (IEEE), National Association of Energy Service Companies (NAESCO), Electric Power Research Institute (EPRI), International Electrotechnical Commission (IEC), World Energy Council (WEC), National Renewable Energy Laboratory (NREL), U.S. Department of Energy (DOE), European Commission Energy Directorate-General, Eurostat Energy Database, American Council for an Energy-Efficient Economy (ACEEE), Lawrence Berkeley National Laboratory (LBNL), International Energy Forum (IEF), Organisation for Economic Co-operation and Development (OECD) Energy Statistics, and regional energy regulatory commission reports from key markets.

In order to compile energy consumption statistics, service deployment data, regulatory policy frameworks, smart grid adoption trends, demand response program metrics, distributed energy resource (DER) integration rates, and market landscape analysis for energy management services, demand response services, distributed energy resource management services, and energy supply services across residential, commercial, industrial, and government end-use segments, these sources were employed.


Primary Research

Qualitative and quantitative insights were obtained by interviewing supply-side and demand-side stakeholders during the primary research process. CEOs, VPs of Business Development, Chief Sustainability Officers, regulatory affairs chiefs, and commercial directors from EaaS providers, ESCOs (Energy Service Companies), utility companies, technology OEMs, and energy management software vendors comprised the supply-side sources. Facility managers, energy directors, procurement leaders, and sustainability officers from commercial real estate firms, manufacturing plants, government institutions, healthcare facilities, educational institutions, and residential property management companies comprised demand-side sources. The primary research validated market segmentation across service types (energy management, demand response, DER management, energy supply), confirmed platform deployment timelines, and gathered insights on technology adoption patterns, pricing models (subscription vs. performance-based), contract structuring preferences, and regulatory compliance dynamics.

Primary Respondent Breakdown:

By Designation: C-level Primaries (38%), Director Level (25%), Others (37%)

By Region: North America (31%), Europe (32%), Asia-Pacific (29%), Rest of World (8%)

By Stakeholder Type: EaaS Providers/ESCOs (40%), End-User Enterprises (35%), Technology Vendors (15%), Utilities/Grid Operators (10%)


Market Size Estimation

Revenue mapping and service deployment volume analysis were employed to determine the global market valuation. The methodology comprised the following:

Identification of over 50 significant EaaS providers and ESCOs in North America, Europe, Asia-Pacific, Latin America, and the Middle East and Africa

Service mapping for energy supply services, demand response services, distributed energy resource management services, and energy management services

Integrated comprehensive solutions, hardware integration (smart meters, sensors, control systems), and technology stack analysis across software platforms (AI-driven energy optimization, IoT-enabled monitoring, predictive analytics)

An analysis of energy source segmentation that encompasses renewable energy (solar-as-a-service, wind contracts), conventional energy (natural gas, utility electricity), and hybrid energy configurations

End-user vertical analysis that encompasses the residential (smart home energy management), commercial (office structures, retail), industrial (manufacturing, data centers), and government (municipal, federal) sectors

Examination of annual revenues that are specific to energy savings performance contracts (ESPCs) and EaaS portfolios, as reported and modeled

In 2024, the coverage of service providers will account for 72-78% of the global market share.

Extrapolation is employed to generate segment-specific valuations by combining bottom-up (deployed capacity × contract value by country/segment) and top-down (provider revenue validation) methodologies.

Download Free Sample

Kindly complete the form below to receive a free sample of this Report

Download PDF ×

We do not share your information with anyone. However, we may send you emails based on your report interest from time to time. You may contact us at any time to opt-out.