×
  • Cat-intel
  • MedIntelliX
  • Resources
  • About Us
  • Hero Background
    English
    Chinese
    French
    Japanese
    Korean
    German
    Spanish

    Geothermal Power Market Trends

    ID: MRFR/EnP/7259-HCR
    200 Pages
    Chitranshi Jaiswal
    October 2025

    Geothermal Power Market Research Report By Technology (Flash Steam, Binary Cycle, Dry Steam, Geothermal Heat Pumps), By Application (Electricity Generation, Direct Use Applications, District Heating), By End Use (Residential, Commercial, Industrial), By Resource Type (Hydrothermal, Enhanced Geothermal Systems, Hot Dry Rock) and By Regional (North America, Europe, South America, Asia Pacific, Mi...

    Share:
    Download PDF ×

    We do not share your information with anyone. However, we may send you emails based on your report interest from time to time. You may contact us at any time to opt-out.

    Geothermal Power Market Infographic
    Purchase Options

    Market Trends

    Key Emerging Trends in the Geothermal Power Market

    The geothermal power sector is expected to grow from USD 4.31 billion in 2022 to USD 6.17 billion in 2030, a CAGR of 5.26%. The global geothermal power industry is driven by the growing demand for green electricity. Additionally, governments worldwide have implemented geothermal power promotion programs. This should essentially fuel market growth throughout the figure period. However, high initial investment costs in geothermal projects limit the global geothermal power industry.

    In the unique energy sector, the Geothermal Power Market has been using market share positioning tactics to grow and position itself. Companies use differentiation to stand out from competitors by delivering unique and creative solutions. Geothermal power companies invest in innovation to enhance efficiency, reduce costs, and gain a competitive edge. This attracts environmentally conscious customers and promotes companies as energy pioneers.

    Geothermal power companies must focus on market invasion. This involves increasing geothermal energy use in current markets to increase market share. To do this, firms may invest in marketing, encourage customers and organizations to switch to geothermal power, and improve geothermal framework integration. Organizations want to gain market share and unlimited acceptance by engaging with partners and highlighting geothermal energy's benefits.

    Despite market infiltration, geothermal power companies use augmentation to mitigate risks and capitalize on opportunities. Enhancing geothermal energy entails exploring new locations or uses beyond power generation. Organizations may research geothermal energy for heating and cooling, contemporary cycles, or direct use applications. This widening provides additional revenue sources and flexibility against market and administrative changes.

    Manageability and corporate social responsibility are also crucial to geothermal power market share positioning. As global demand for optimal and sustainable electricity rises, companies that prioritize environmental responsibility and social impact will gain favor with customers, investors, and regulators. Geothermal power enterprises improve their reputation, attract moral investors, and contribute to a greener, more practical energy landscape by tailoring their activities to manageable goals.

    Overall, the geothermal power industry uses a variety of strategies to gain market share. Separation via mechanical development, key organizations, market infiltration, expansion, and a commitment to maintainability boosts firm growth and flexibility. Geothermal power companies will likely refine and alter their processes to meet market challenges as the energy sector grows.

    Author
    Chitranshi Jaiswal
    Research Analyst Level I

    In her 3 years of experience in the market research field, she has handled critical cross-domain projects. She has an in-depth knowledge of market estimation & analysis, problem-solving, primary as well as secondary research, and team management.She holds an engineering degree and is an MBA professional from a well-known university, capable of evaluating the market and competitive conditions. An exceptional strategist with excellent communication skills and a passion for delivering cutting-edge & practical insights for the market. Proficient in multi-tasking, and can successfully deal with competing demands, while maintaining complete confidentiality. Generated business through active client and project development, networking, and high-quality responses. Her knowledge and skills have helped in making solid business decisions, securing funding from investors, and avoiding business failures.

    Leave a Comment

    FAQs

    What is the current valuation of the Geothermal Power Market as of 2024?

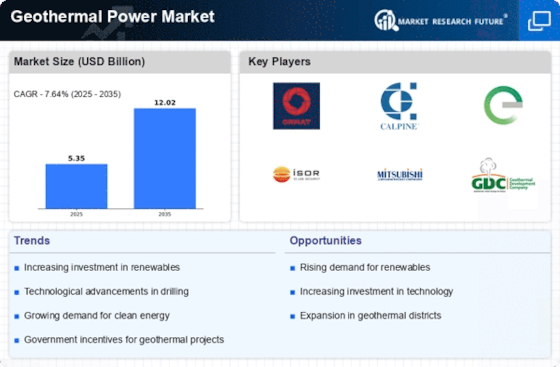
    <p>The Geothermal Power Market was valued at 5.35 USD Billion in 2024.</p>

    What is the projected market size for the Geothermal Power Market in 2035?

    <p>The market is projected to reach 12.02 USD Billion by 2035.</p>

    What is the expected CAGR for the Geothermal Power Market during the forecast period 2025 - 2035?

    <p>The expected CAGR for the Geothermal Power Market during 2025 - 2035 is 7.64%.</p>

    Which technology segments are included in the Geothermal Power Market?

    <p>Key technology segments include Flash Steam, Binary Cycle, Dry Steam, and Geothermal Heat Pumps.</p>

    What are the projected valuations for the Flash Steam technology segment by 2035?

    <p>The Flash Steam technology segment is projected to reach between 1.5 and 3.5 USD Billion by 2035.</p>

    How does the Direct Use Applications segment perform in the Geothermal Power Market?

    <p>The Direct Use Applications segment is expected to grow to between 1.5 and 3.5 USD Billion by 2035.</p>

    What are the anticipated valuations for the Industrial end-use segment by 2035?

    <p>The Industrial end-use segment is projected to reach between 2.65 and 5.72 USD Billion by 2035.</p>

    Which companies are considered key players in the Geothermal Power Market?

    <p>Key players include Ormat Technologies, Calpine Corporation, Enel Green Power, and Mitsubishi Materials Corporation.</p>

    What resource types are included in the Geothermal Power Market analysis?

    <p>Resource types include Hydrothermal, Enhanced Geothermal Systems, and Hot Dry Rock.</p>

    What is the projected valuation for the Hydrothermal resource type by 2035?

    <p>The Hydrothermal resource type is projected to reach between 2.68 and 6.05 USD Billion by 2035.</p>

    Market Summary

    As per MRFR analysis, the Geothermal Power Market Size was estimated at 5.35 USD Billion in 2024. The Geothermal Power industry is projected to grow from 5.758 USD Billion in 2025 to 12.02 USD Billion by 2035, exhibiting a compound annual growth rate (CAGR) of 7.64 during the forecast period 2025 - 2035.

    Key Market Trends & Highlights

    The Geothermal Power Market is poised for robust growth driven by technological advancements and increasing investments.

    • North America remains the largest market for geothermal power, showcasing a strong commitment to renewable energy sources.
    • The Asia-Pacific region is emerging as the fastest-growing market, fueled by rising energy demands and supportive government policies.
    • Flash steam technology dominates the market, while binary cycle systems are rapidly gaining traction due to their efficiency and lower environmental impact.
    • Key market drivers include the rising demand for renewable energy and government incentives that promote infrastructure investment.

    Market Size & Forecast

    2024 Market Size 5.35 (USD Billion)
    2035 Market Size 12.02 (USD Billion)
    CAGR (2025 - 2035) 7.64%
    Largest Regional Market Share in 2024 Asia Pacific

    Major Players

    <p>Ormat Technologies (US), Calpine Corporation (US), Enel Green Power (IT), Iceland GeoSurvey (IS), Mitsubishi Materials Corporation (JP), Geothermal Development Company (KE), Contact Energy (NZ), Cyrq Energy (US), Toshiba Corporation (JP)</p>

    Market Trends

    The Geothermal Power Market is currently experiencing a notable transformation, driven by an increasing global emphasis on sustainable energy sources. This shift appears to be influenced by a growing awareness of climate change and the need for cleaner alternatives to fossil fuels. As nations strive to meet their energy demands while minimizing environmental impact, geothermal energy emerges as a viable solution. The technology harnesses heat from the Earth, providing a consistent and reliable energy source that can complement other renewable options. Furthermore, advancements in drilling techniques and plant efficiency are likely to enhance the attractiveness of geothermal projects, potentially leading to expanded investments in this sector. In addition to technological improvements, regulatory frameworks are evolving to support the Geothermal Power Market. Governments worldwide seem to recognize the importance of incentivizing renewable energy development, which may include tax breaks, grants, and streamlined permitting processes. This supportive environment could encourage private sector participation and foster innovation within the industry. As the market matures, collaboration between public and private entities appears essential for overcoming challenges related to resource exploration and project financing. Overall, the Geothermal Power Market is poised for growth, driven by a combination of technological advancements and favorable policy landscapes.

    Technological Advancements

    Recent innovations in drilling and resource assessment technologies are enhancing the efficiency and feasibility of geothermal projects. These advancements may lead to reduced costs and improved energy output, making geothermal energy more competitive with other renewable sources.

    Regulatory Support

    Governments are increasingly implementing policies that favor renewable energy development, including geothermal power. This regulatory support could manifest in various forms, such as financial incentives and streamlined processes, which may encourage investment and project initiation.

    Increased Investment

    There appears to be a growing interest from both public and private sectors in financing geothermal projects. This trend may be driven by the need for sustainable energy solutions and the potential for long-term returns, suggesting a robust future for the Geothermal Power Market.

    Geothermal Power Market Market Drivers

    Technological Innovations

    Technological advancements play a crucial role in shaping the Geothermal Power Market. Innovations in drilling techniques, such as enhanced geothermal systems, have significantly reduced costs and improved efficiency. For instance, the introduction of advanced drilling technologies has enabled deeper and more efficient extraction of geothermal resources. In 2023, the average cost of geothermal electricity generation decreased by approximately 10% due to these innovations. Additionally, the integration of digital technologies, such as data analytics and remote monitoring, enhances operational efficiency and reduces maintenance costs. As these technologies continue to evolve, they are likely to attract further investment and interest in the Geothermal Power Market, fostering growth and expansion in various regions.

    Government Incentives and Policies

    Supportive government policies and incentives are pivotal in driving the Geothermal Power Market. Many countries have implemented favorable regulatory frameworks, including feed-in tariffs and tax credits, to encourage the development of geothermal projects. In 2023, several nations reported an increase in geothermal project approvals, attributed to these supportive measures. For example, the introduction of streamlined permitting processes has reduced the time required to bring geothermal projects online. This regulatory environment not only boosts investor confidence but also stimulates job creation in the sector. As governments continue to prioritize renewable energy, the Geothermal Power Market is expected to experience sustained growth, with an increasing number of projects coming to fruition.

    Rising Demand for Renewable Energy

    The increasing The Geothermal Power Industry. As nations strive to meet climate goals and reduce greenhouse gas emissions, geothermal energy emerges as a viable alternative. In 2023, the total installed geothermal capacity reached approximately 15 gigawatts, reflecting a growing recognition of its potential. This trend is likely to continue, as countries seek to diversify their energy portfolios and enhance energy security. The Geothermal Power Market stands to benefit from this shift, as it offers a stable and sustainable energy source that can complement intermittent renewables like solar and wind. Furthermore, the long-term operational efficiency of geothermal plants positions them favorably in the energy mix, potentially leading to increased investments and development in this sector.

    Growing Awareness of Energy Security

    The rising awareness of energy security concerns is influencing the Geothermal Power Market. As geopolitical tensions and supply chain disruptions become more prevalent, countries are seeking to reduce their dependence on fossil fuels and diversify their energy sources. Geothermal energy, with its ability to provide baseload power, offers a reliable solution to these challenges. In 2023, several nations reported a strategic shift towards renewable energy, with geothermal being a key component of their energy strategies. This trend is likely to continue, as energy security becomes a priority for governments and businesses alike. The Geothermal Power Market stands to gain from this shift, as it provides a stable and indigenous energy source that can enhance national energy resilience.

    Increased Investment in Infrastructure

    Investment in geothermal infrastructure is a significant driver for the Geothermal Power Market. As the demand for renewable energy grows, there is a corresponding need for enhanced geothermal facilities and supporting infrastructure. In 2023, global investments in geothermal projects reached an estimated USD 1.5 billion, reflecting a robust interest in expanding capacity. This influx of capital is likely to facilitate the development of new geothermal plants and the upgrading of existing facilities. Furthermore, partnerships between public and private sectors are emerging to finance these projects, indicating a collaborative approach to harnessing geothermal resources. As infrastructure improves, the Geothermal Power Market is expected to expand, providing more opportunities for energy generation and job creation.

    Market Segment Insights

    By Technology: Flash Steam (Largest) vs. Binary Cycle (Fastest-Growing)

    <p>The Geothermal Power Market showcases a diverse array of technologies, wherein Flash Steam dominates with a substantial market share. This technology harnesses high-pressure steam from geothermal reservoirs, leading to high efficiency in energy conversion. Following closely is the emerging Binary Cycle technology, which is gaining traction due to its ability to utilize lower temperature geothermal resources and lower environmental impact, thus showcasing a promising market share next to Flash Steam. Growth trends in the Geothermal Power Market indicate that while Flash Steam remains a cornerstone for geothermal energy production, the Binary Cycle's rapid adoption is driven by increasing investments in renewable energy technologies and government incentives. As countries ramp up their commitment to sustainable energy solutions, the demand for efficient systems like Binary Cycle is expected to grow, positioning it as a key player in future geothermal developments.</p>

    <p>Technology: Flash Steam (Dominant) vs. Binary Cycle (Emerging)</p>

    <p>Flash Steam technology is a well-established method in the geothermal power sector, facilitating efficient energy production from high-temperature geothermal resources. Its ability to convert geothermal energy into electricity efficiently cements its position as the dominant technology in this segment. In contrast, Binary Cycle technology is emerging as a viable alternative, particularly in regions with lower geothermal temperatures. It operates by using a secondary fluid with a lower boiling point, allowing for energy production from less traditional geothermal sources. This adaptability makes Binary Cycle increasingly attractive in the global shift towards renewable energy, highlighting its potential to carve out a significant market share.</p>

    By Application: Electricity Generation (Largest) vs. Direct Use Applications (Fastest-Growing)

    <p>In the Geothermal Power Market, the application segment showcases a diverse distribution of functionalities, primarily encompassing Electricity Generation, Direct Use Applications, and District Heating. Electricity Generation holds the largest share, being a fundamental output of geothermal plants, whereas Direct Use Applications and District Heating are gaining traction, reflecting a balance in market preferences. This segmentation illuminates the crucial roles these applications play in catering to varied energy needs across different sectors.</p>

    <p>Electricity Generation (Dominant) vs. Direct Use Applications (Emerging)</p>

    <p>Electricity Generation stands as the most dominant application in the Geothermal Power Market, serving as the cornerstone for renewable energy initiatives. It harnesses geothermal resources to produce sustainable electricity, benefiting from existing infrastructure and technology advancements. On the other hand, Direct Use Applications represent an emerging segment, utilizing geothermal heat for residential heating, industrial processes, and agricultural developments. This segment is rapidly expanding due to increasing energy efficiency demands and environmental sustainability trends. District Heating, although significant, is seen as a supportive application that complements these two by redistributing geothermal energy for communal use.</p>

    By End Use: Residential (Largest) vs. Commercial (Fastest-Growing)

    <p>In the Geothermal Power Market, the end-use segments are primarily divided into Residential, Commercial, and Industrial. Among these, Residential applications dominate, accounting for a significant share as they leverage geothermal systems for heating and cooling in homes. This segment benefits from an increasing trend towards sustainable living and energy efficiency. Meanwhile, the Commercial segment is emerging rapidly, particularly in sectors like hospitality and office buildings, where there is a growing emphasis on reducing carbon footprints and operational costs connected with energy consumption.</p>

    <p>Residential (Dominant) vs. Commercial (Emerging)</p>

    <p>The Residential segment holds a dominant position in the Geothermal Power Market, capitalizing on technological advancements in geothermal heat pumps that provide cost-effective heating and cooling solutions for homes. With incentives from governmental policies supporting sustainable energy usage, homeowners are increasingly adopting these systems. Conversely, the Commercial segment is classified as emerging, experiencing faster growth due to the rising adoption of geothermal solutions in commercial buildings. Businesses are becoming more aware of the long-term cost savings and environmental benefits associated with geothermal energy, thus driving installation rates. This segment is expected to continue its growth trajectory as more companies commit to sustainability goals.</p>

    By Resource Type: Hydrothermal (Largest) vs. Enhanced Geothermal Systems (Fastest-Growing)

    <p>In the Geothermal Power Market, Hydrothermal resources account for the largest share, harnessing steam or hot water from beneath the Earth's surface for energy generation. This proven technology includes both conventional and modified resources that provide reliable baseload power. Enhanced Geothermal Systems (EGS), while currently smaller in market share, are emerging rapidly as a revolutionary method for stimulating heat extraction from dry and hot rock formations, expanding the geographic reach of geothermal energy.</p>

    <p>Hydrothermal (Dominant) vs. Enhanced Geothermal Systems (Emerging)</p>

    <p>Hydrothermal resources are the backbone of the geothermal power sector, leveraging existing hot water reserves for efficient energy production. This segment has extensive infrastructure and operational histories, ensuring consistent energy outputs. In contrast, Enhanced Geothermal Systems (EGS) are recognized as a transformative technology that enhances the potential for geothermal energy beyond traditional locations. By artificially augmenting reservoir permeability, EGS can tap into previously inaccessible heat sources, positioning itself as an emerging player poised for significant growth as technological advancements continue to lower costs and improve efficiency.</p>

    Get more detailed insights about Geothermal Power Market Research Report - Global Forecast till 2035

    Regional Insights

    The Geothermal Power Market demonstrates a robust framework with its regional segmentation revealing varied growth dynamics.

    In 2024, North America stands prominent with a valuation of 1.3 USD Billion, projected to rise to 3.0 USD billion by 2035, solidifying its status as a major holding in the geothermal landscape.

    Europe follows closely with a market value of 1.1 USD Billion in 2024, expecting a notable growth to 2.5 USD billion by 2035, benefitting from stringent renewable energy policies.

    The Asia Pacific region, valued at 1.8 USD Billion in 2024 and anticipated to expand to 4.0 USD billion by 2035, serves as a significant hub due to its vast geothermal resources and ongoing investments in sustainable energy.

    In contrast, South America, with a valuation of 0.6 USD Billion initially, and a rise to 1.5 USD billion, displays a slower growth pace but holds considerable potential for harnessing geothermal energy.

    The Middle East and Africa represent the smallest segment, starting at 0.54 USD billion in 2024 and growing to 1.0 USD billion, driven by ongoing efforts to diversify energy sources.

    Overall, the geographical distribution and unique growth patterns across these regions play a critical role in shaping the Geothermal Power Market revenue and segmentation outlook.

    Geothermal Power Market Regional Insights

    Source: Primary Research, Secondary Research, Market Research Future Database, and Analyst Review

    Key Players and Competitive Insights

    The Geothermal Power Market has been experiencing significant growth due to the increasing need for sustainable and renewable energy sources.

    Competitive insights in this market reveal a landscape characterized by innovation, technological advancements, and a strong commitment to reducing carbon emissions.

    Companies worldwide are focusing on harnessing geothermal energy as a reliable and environmentally friendly alternative to fossil fuels.

    This segment offers opportunities for businesses to capitalize on the global shift towards sustainability, with various players striving to enhance their portfolio through partnerships, strategic expansions, and investments in research and development.

    The dynamic nature of the market indicates that companies must remain agile and responsive to emerging trends, regulatory frameworks, and consumer preferences to maintain a competitive edge.

    Enel Green Power has established itself as a prominent player in the Geothermal Power Market, showcasing significant strengths that contribute to its competitive positioning.

    The company's extensive experience in the renewable energy sector allows it to leverage its expertise in geothermal technologies, resulting in efficient and sustainable energy production.

    Enel Green Power's strong presence in key geothermal hotspots globally enhances its capacity to capitalize on untapped resources.

    The company has a robust portfolio of geothermal plants, reflecting its commitment to scaling up production while adhering to environmental regulations and maintaining a low carbon footprint.

    Enel Green Power’s advanced operational techniques and strong customer relationship management enhance its ability to provide reliable geothermal solutions, positioning it as a trusted partner in the renewable energy landscape.

    Toshiba Energy Systems & Solutions Corporation plays a crucial role in the Geothermal Power Market, with a focus on innovation and advanced technology solutions.

    The company offers a range of products and services tailored to optimize geothermal energy generation, including cutting-edge turbine systems and integrated thermal energy solutions.

    Toshiba Energy Systems & Solutions Corporation has a well-established market presence, beneficially leveraging its technological prowess to design and implement customized geothermal power solutions for various regions.

    The company's strengths lie in its research and development capabilities, consistently delivering high-efficiency systems that cater to diverse energy demands.

    In addition to organic growth, Toshiba Energy Systems & Solutions Corporation has pursued strategic mergers and acquisitions to enhance its market share and technological foundation, resulting in a more comprehensive offering in the global geothermal arena.

    These strategic endeavors position the company favorably as it addresses the growing demand for renewable energy.

    Key Companies in the Geothermal Power Market market include

    Industry Developments

    Recent developments in the Geothermal Power Market showcase a growing focus on sustainability and clean energy. Companies such as Enel Green Power are expanding their geothermal operations, and Fervo Energy has initiated projects that utilize advanced technology to enhance efficiency.

    Ormat Technologies, in collaboration with PT Medco Power Indonesia, launched the initial phase of its Ijen geothermal plant in February 2025, which contributed 35 MW to the grid of Java. The initiative is a critical component of a long-term power purchase agreement (PPA) that aims to establish a 110-MW capacity.

    April 2025 - Two Ormat Energy Converter units have been installed, and the Geothermal Power Company of Dominica is making steady progress on its 10 MW facility at Laudat. Major equipment has been installed on the site. Commercial operations are anticipated to commence in December 2025.

    In 2024, GreenEco Energy effectively commissioned the initial 24.5 MW unit of its GPP-7 geothermal plant in Denizli, Turkey. The facility will generate approximately 49 MWe cumulatively once it is fully operational.

    Future Outlook

    Geothermal Power Market Future Outlook

    <p>The Geothermal Power Market is projected to grow at a 7.64% CAGR from 2024 to 2035, driven by increasing energy demand, technological advancements, and supportive government policies.</p>

    New opportunities lie in:

    • <p>Development of enhanced geothermal systems for broader resource access.</p>
    • <p>Investment in geothermal district heating networks for urban areas.</p>
    • <p>Partnerships with tech firms for geothermal energy storage solutions.</p>

    <p>By 2035, the geothermal power sector is poised for robust growth and increased market penetration.</p>

    Market Segmentation

    Geothermal Power Market End Use Outlook

    • Residential
    • Commercial
    • Industrial

    Geothermal Power Market Technology Outlook

    • Flash Steam
    • Binary Cycle
    • Dry Steam
    • Geothermal Heat Pumps

    Geothermal Power Market Application Outlook

    • Electricity Generation
    • Direct Use Applications
    • District Heating

    Geothermal Power Market Resource Type Outlook

    • Hydrothermal
    • Enhanced Geothermal Systems
    • Hot Dry Rock

    Report Scope

    MARKET SIZE 20245.35(USD Billion)
    MARKET SIZE 20255.758(USD Billion)
    MARKET SIZE 203512.02(USD Billion)
    COMPOUND ANNUAL GROWTH RATE (CAGR)7.64% (2024 - 2035)
    REPORT COVERAGERevenue Forecast, Competitive Landscape, Growth Factors, and Trends
    BASE YEAR2024
    Market Forecast Period2025 - 2035
    Historical Data2019 - 2024
    Market Forecast UnitsUSD Billion
    Key Companies ProfiledMarket analysis in progress
    Segments CoveredMarket segmentation analysis in progress
    Key Market OpportunitiesExpansion of geothermal district heating systems in urban areas presents a substantial opportunity in the Geothermal Power Market.
    Key Market DynamicsRising investments in geothermal technology drive market growth amid increasing demand for renewable energy solutions.
    Countries CoveredNorth America, Europe, APAC, South America, MEA

    FAQs

    What is the current valuation of the Geothermal Power Market as of 2024?

    <p>The Geothermal Power Market was valued at 5.35 USD Billion in 2024.</p>

    What is the projected market size for the Geothermal Power Market in 2035?

    <p>The market is projected to reach 12.02 USD Billion by 2035.</p>

    What is the expected CAGR for the Geothermal Power Market during the forecast period 2025 - 2035?

    <p>The expected CAGR for the Geothermal Power Market during 2025 - 2035 is 7.64%.</p>

    Which technology segments are included in the Geothermal Power Market?

    <p>Key technology segments include Flash Steam, Binary Cycle, Dry Steam, and Geothermal Heat Pumps.</p>

    What are the projected valuations for the Flash Steam technology segment by 2035?

    <p>The Flash Steam technology segment is projected to reach between 1.5 and 3.5 USD Billion by 2035.</p>

    How does the Direct Use Applications segment perform in the Geothermal Power Market?

    <p>The Direct Use Applications segment is expected to grow to between 1.5 and 3.5 USD Billion by 2035.</p>

    What are the anticipated valuations for the Industrial end-use segment by 2035?

    <p>The Industrial end-use segment is projected to reach between 2.65 and 5.72 USD Billion by 2035.</p>

    Which companies are considered key players in the Geothermal Power Market?

    <p>Key players include Ormat Technologies, Calpine Corporation, Enel Green Power, and Mitsubishi Materials Corporation.</p>

    What resource types are included in the Geothermal Power Market analysis?

    <p>Resource types include Hydrothermal, Enhanced Geothermal Systems, and Hot Dry Rock.</p>

    What is the projected valuation for the Hydrothermal resource type by 2035?

    <p>The Hydrothermal resource type is projected to reach between 2.68 and 6.05 USD Billion by 2035.</p>

    1. SECTION I: EXECUTIVE SUMMARY AND KEY HIGHLIGHTS
      1. | 1.1 EXECUTIVE SUMMARY
      2. | | 1.1.1 Market Overview
      3. | | 1.1.2 Key Findings
      4. | | 1.1.3 Market Segmentation
      5. | | 1.1.4 Competitive Landscape
      6. | | 1.1.5 Challenges and Opportunities
      7. | | 1.1.6 Future Outlook
    2. SECTION II: SCOPING, METHODOLOGY AND MARKET STRUCTURE
      1. | 2.1 MARKET INTRODUCTION
      2. | | 2.1.1 Definition
      3. | | 2.1.2 Scope of the study
      4. | | | 2.1.2.1 Research Objective
      5. | | | 2.1.2.2 Assumption
      6. | | | 2.1.2.3 Limitations
      7. | 2.2 RESEARCH METHODOLOGY
      8. | | 2.2.1 Overview
      9. | | 2.2.2 Data Mining
      10. | | 2.2.3 Secondary Research
      11. | | 2.2.4 Primary Research
      12. | | | 2.2.4.1 Primary Interviews and Information Gathering Process
      13. | | | 2.2.4.2 Breakdown of Primary Respondents
      14. | | 2.2.5 Forecasting Model
      15. | | 2.2.6 Market Size Estimation
      16. | | | 2.2.6.1 Bottom-Up Approach
      17. | | | 2.2.6.2 Top-Down Approach
      18. | | 2.2.7 Data Triangulation
      19. | | 2.2.8 Validation
    3. SECTION III: QUALITATIVE ANALYSIS
      1. | 3.1 MARKET DYNAMICS
      2. | | 3.1.1 Overview
      3. | | 3.1.2 Drivers
      4. | | 3.1.3 Restraints
      5. | | 3.1.4 Opportunities
      6. | 3.2 MARKET FACTOR ANALYSIS
      7. | | 3.2.1 Value chain Analysis
      8. | | 3.2.2 Porter's Five Forces Analysis
      9. | | | 3.2.2.1 Bargaining Power of Suppliers
      10. | | | 3.2.2.2 Bargaining Power of Buyers
      11. | | | 3.2.2.3 Threat of New Entrants
      12. | | | 3.2.2.4 Threat of Substitutes
      13. | | | 3.2.2.5 Intensity of Rivalry
      14. | | 3.2.3 COVID-19 Impact Analysis
      15. | | | 3.2.3.1 Market Impact Analysis
      16. | | | 3.2.3.2 Regional Impact
      17. | | | 3.2.3.3 Opportunity and Threat Analysis
    4. SECTION IV: QUANTITATIVE ANALYSIS
      1. | 4.1 Energy & Power, BY Technology (USD Billion)
      2. | | 4.1.1 Flash Steam
      3. | | 4.1.2 Binary Cycle
      4. | | 4.1.3 Dry Steam
      5. | | 4.1.4 Geothermal Heat Pumps
      6. | 4.2 Energy & Power, BY Application (USD Billion)
      7. | | 4.2.1 Electricity Generation
      8. | | 4.2.2 Direct Use Applications
      9. | | 4.2.3 District Heating
      10. | 4.3 Energy & Power, BY End Use (USD Billion)
      11. | | 4.3.1 Residential
      12. | | 4.3.2 Commercial
      13. | | 4.3.3 Industrial
      14. | 4.4 Energy & Power, BY Resource Type (USD Billion)
      15. | | 4.4.1 Hydrothermal
      16. | | 4.4.2 Enhanced Geothermal Systems
      17. | | 4.4.3 Hot Dry Rock
      18. | 4.5 Energy & Power, BY Region (USD Billion)
      19. | | 4.5.1 North America
      20. | | | 4.5.1.1 US
      21. | | | 4.5.1.2 Canada
      22. | | 4.5.2 Europe
      23. | | | 4.5.2.1 Germany
      24. | | | 4.5.2.2 UK
      25. | | | 4.5.2.3 France
      26. | | | 4.5.2.4 Russia
      27. | | | 4.5.2.5 Italy
      28. | | | 4.5.2.6 Spain
      29. | | | 4.5.2.7 Rest of Europe
      30. | | 4.5.3 APAC
      31. | | | 4.5.3.1 China
      32. | | | 4.5.3.2 India
      33. | | | 4.5.3.3 Japan
      34. | | | 4.5.3.4 South Korea
      35. | | | 4.5.3.5 Malaysia
      36. | | | 4.5.3.6 Thailand
      37. | | | 4.5.3.7 Indonesia
      38. | | | 4.5.3.8 Rest of APAC
      39. | | 4.5.4 South America
      40. | | | 4.5.4.1 Brazil
      41. | | | 4.5.4.2 Mexico
      42. | | | 4.5.4.3 Argentina
      43. | | | 4.5.4.4 Rest of South America
      44. | | 4.5.5 MEA
      45. | | | 4.5.5.1 GCC Countries
      46. | | | 4.5.5.2 South Africa
      47. | | | 4.5.5.3 Rest of MEA
    5. SECTION V: COMPETITIVE ANALYSIS
      1. | 5.1 Competitive Landscape
      2. | | 5.1.1 Overview
      3. | | 5.1.2 Competitive Analysis
      4. | | 5.1.3 Market share Analysis
      5. | | 5.1.4 Major Growth Strategy in the Energy & Power
      6. | | 5.1.5 Competitive Benchmarking
      7. | | 5.1.6 Leading Players in Terms of Number of Developments in the Energy & Power
      8. | | 5.1.7 Key developments and growth strategies
      9. | | | 5.1.7.1 New Product Launch/Service Deployment
      10. | | | 5.1.7.2 Merger & Acquisitions
      11. | | | 5.1.7.3 Joint Ventures
      12. | | 5.1.8 Major Players Financial Matrix
      13. | | | 5.1.8.1 Sales and Operating Income
      14. | | | 5.1.8.2 Major Players R&D Expenditure. 2023
      15. | 5.2 Company Profiles
      16. | | 5.2.1 Ormat Technologies (US)
      17. | | | 5.2.1.1 Financial Overview
      18. | | | 5.2.1.2 Products Offered
      19. | | | 5.2.1.3 Key Developments
      20. | | | 5.2.1.4 SWOT Analysis
      21. | | | 5.2.1.5 Key Strategies
      22. | | 5.2.2 Calpine Corporation (US)
      23. | | | 5.2.2.1 Financial Overview
      24. | | | 5.2.2.2 Products Offered
      25. | | | 5.2.2.3 Key Developments
      26. | | | 5.2.2.4 SWOT Analysis
      27. | | | 5.2.2.5 Key Strategies
      28. | | 5.2.3 Enel Green Power (IT)
      29. | | | 5.2.3.1 Financial Overview
      30. | | | 5.2.3.2 Products Offered
      31. | | | 5.2.3.3 Key Developments
      32. | | | 5.2.3.4 SWOT Analysis
      33. | | | 5.2.3.5 Key Strategies
      34. | | 5.2.4 Iceland GeoSurvey (IS)
      35. | | | 5.2.4.1 Financial Overview
      36. | | | 5.2.4.2 Products Offered
      37. | | | 5.2.4.3 Key Developments
      38. | | | 5.2.4.4 SWOT Analysis
      39. | | | 5.2.4.5 Key Strategies
      40. | | 5.2.5 Mitsubishi Materials Corporation (JP)
      41. | | | 5.2.5.1 Financial Overview
      42. | | | 5.2.5.2 Products Offered
      43. | | | 5.2.5.3 Key Developments
      44. | | | 5.2.5.4 SWOT Analysis
      45. | | | 5.2.5.5 Key Strategies
      46. | | 5.2.6 Geothermal Development Company (KE)
      47. | | | 5.2.6.1 Financial Overview
      48. | | | 5.2.6.2 Products Offered
      49. | | | 5.2.6.3 Key Developments
      50. | | | 5.2.6.4 SWOT Analysis
      51. | | | 5.2.6.5 Key Strategies
      52. | | 5.2.7 Contact Energy (NZ)
      53. | | | 5.2.7.1 Financial Overview
      54. | | | 5.2.7.2 Products Offered
      55. | | | 5.2.7.3 Key Developments
      56. | | | 5.2.7.4 SWOT Analysis
      57. | | | 5.2.7.5 Key Strategies
      58. | | 5.2.8 Cyrq Energy (US)
      59. | | | 5.2.8.1 Financial Overview
      60. | | | 5.2.8.2 Products Offered
      61. | | | 5.2.8.3 Key Developments
      62. | | | 5.2.8.4 SWOT Analysis
      63. | | | 5.2.8.5 Key Strategies
      64. | | 5.2.9 Toshiba Corporation (JP)
      65. | | | 5.2.9.1 Financial Overview
      66. | | | 5.2.9.2 Products Offered
      67. | | | 5.2.9.3 Key Developments
      68. | | | 5.2.9.4 SWOT Analysis
      69. | | | 5.2.9.5 Key Strategies
      70. | 5.3 Appendix
      71. | | 5.3.1 References
      72. | | 5.3.2 Related Reports
    6. LIST OF FIGURES
      1. | 6.1 MARKET SYNOPSIS
      2. | 6.2 NORTH AMERICA MARKET ANALYSIS
      3. | 6.3 US MARKET ANALYSIS BY TECHNOLOGY
      4. | 6.4 US MARKET ANALYSIS BY APPLICATION
      5. | 6.5 US MARKET ANALYSIS BY END USE
      6. | 6.6 US MARKET ANALYSIS BY RESOURCE TYPE
      7. | 6.7 CANADA MARKET ANALYSIS BY TECHNOLOGY
      8. | 6.8 CANADA MARKET ANALYSIS BY APPLICATION
      9. | 6.9 CANADA MARKET ANALYSIS BY END USE
      10. | 6.10 CANADA MARKET ANALYSIS BY RESOURCE TYPE
      11. | 6.11 EUROPE MARKET ANALYSIS
      12. | 6.12 GERMANY MARKET ANALYSIS BY TECHNOLOGY
      13. | 6.13 GERMANY MARKET ANALYSIS BY APPLICATION
      14. | 6.14 GERMANY MARKET ANALYSIS BY END USE
      15. | 6.15 GERMANY MARKET ANALYSIS BY RESOURCE TYPE
      16. | 6.16 UK MARKET ANALYSIS BY TECHNOLOGY
      17. | 6.17 UK MARKET ANALYSIS BY APPLICATION
      18. | 6.18 UK MARKET ANALYSIS BY END USE
      19. | 6.19 UK MARKET ANALYSIS BY RESOURCE TYPE
      20. | 6.20 FRANCE MARKET ANALYSIS BY TECHNOLOGY
      21. | 6.21 FRANCE MARKET ANALYSIS BY APPLICATION
      22. | 6.22 FRANCE MARKET ANALYSIS BY END USE
      23. | 6.23 FRANCE MARKET ANALYSIS BY RESOURCE TYPE
      24. | 6.24 RUSSIA MARKET ANALYSIS BY TECHNOLOGY
      25. | 6.25 RUSSIA MARKET ANALYSIS BY APPLICATION
      26. | 6.26 RUSSIA MARKET ANALYSIS BY END USE
      27. | 6.27 RUSSIA MARKET ANALYSIS BY RESOURCE TYPE
      28. | 6.28 ITALY MARKET ANALYSIS BY TECHNOLOGY
      29. | 6.29 ITALY MARKET ANALYSIS BY APPLICATION
      30. | 6.30 ITALY MARKET ANALYSIS BY END USE
      31. | 6.31 ITALY MARKET ANALYSIS BY RESOURCE TYPE
      32. | 6.32 SPAIN MARKET ANALYSIS BY TECHNOLOGY
      33. | 6.33 SPAIN MARKET ANALYSIS BY APPLICATION
      34. | 6.34 SPAIN MARKET ANALYSIS BY END USE
      35. | 6.35 SPAIN MARKET ANALYSIS BY RESOURCE TYPE
      36. | 6.36 REST OF EUROPE MARKET ANALYSIS BY TECHNOLOGY
      37. | 6.37 REST OF EUROPE MARKET ANALYSIS BY APPLICATION
      38. | 6.38 REST OF EUROPE MARKET ANALYSIS BY END USE
      39. | 6.39 REST OF EUROPE MARKET ANALYSIS BY RESOURCE TYPE
      40. | 6.40 APAC MARKET ANALYSIS
      41. | 6.41 CHINA MARKET ANALYSIS BY TECHNOLOGY
      42. | 6.42 CHINA MARKET ANALYSIS BY APPLICATION
      43. | 6.43 CHINA MARKET ANALYSIS BY END USE
      44. | 6.44 CHINA MARKET ANALYSIS BY RESOURCE TYPE
      45. | 6.45 INDIA MARKET ANALYSIS BY TECHNOLOGY
      46. | 6.46 INDIA MARKET ANALYSIS BY APPLICATION
      47. | 6.47 INDIA MARKET ANALYSIS BY END USE
      48. | 6.48 INDIA MARKET ANALYSIS BY RESOURCE TYPE
      49. | 6.49 JAPAN MARKET ANALYSIS BY TECHNOLOGY
      50. | 6.50 JAPAN MARKET ANALYSIS BY APPLICATION
      51. | 6.51 JAPAN MARKET ANALYSIS BY END USE
      52. | 6.52 JAPAN MARKET ANALYSIS BY RESOURCE TYPE
      53. | 6.53 SOUTH KOREA MARKET ANALYSIS BY TECHNOLOGY
      54. | 6.54 SOUTH KOREA MARKET ANALYSIS BY APPLICATION
      55. | 6.55 SOUTH KOREA MARKET ANALYSIS BY END USE
      56. | 6.56 SOUTH KOREA MARKET ANALYSIS BY RESOURCE TYPE
      57. | 6.57 MALAYSIA MARKET ANALYSIS BY TECHNOLOGY
      58. | 6.58 MALAYSIA MARKET ANALYSIS BY APPLICATION
      59. | 6.59 MALAYSIA MARKET ANALYSIS BY END USE
      60. | 6.60 MALAYSIA MARKET ANALYSIS BY RESOURCE TYPE
      61. | 6.61 THAILAND MARKET ANALYSIS BY TECHNOLOGY
      62. | 6.62 THAILAND MARKET ANALYSIS BY APPLICATION
      63. | 6.63 THAILAND MARKET ANALYSIS BY END USE
      64. | 6.64 THAILAND MARKET ANALYSIS BY RESOURCE TYPE
      65. | 6.65 INDONESIA MARKET ANALYSIS BY TECHNOLOGY
      66. | 6.66 INDONESIA MARKET ANALYSIS BY APPLICATION
      67. | 6.67 INDONESIA MARKET ANALYSIS BY END USE
      68. | 6.68 INDONESIA MARKET ANALYSIS BY RESOURCE TYPE
      69. | 6.69 REST OF APAC MARKET ANALYSIS BY TECHNOLOGY
      70. | 6.70 REST OF APAC MARKET ANALYSIS BY APPLICATION
      71. | 6.71 REST OF APAC MARKET ANALYSIS BY END USE
      72. | 6.72 REST OF APAC MARKET ANALYSIS BY RESOURCE TYPE
      73. | 6.73 SOUTH AMERICA MARKET ANALYSIS
      74. | 6.74 BRAZIL MARKET ANALYSIS BY TECHNOLOGY
      75. | 6.75 BRAZIL MARKET ANALYSIS BY APPLICATION
      76. | 6.76 BRAZIL MARKET ANALYSIS BY END USE
      77. | 6.77 BRAZIL MARKET ANALYSIS BY RESOURCE TYPE
      78. | 6.78 MEXICO MARKET ANALYSIS BY TECHNOLOGY
      79. | 6.79 MEXICO MARKET ANALYSIS BY APPLICATION
      80. | 6.80 MEXICO MARKET ANALYSIS BY END USE
      81. | 6.81 MEXICO MARKET ANALYSIS BY RESOURCE TYPE
      82. | 6.82 ARGENTINA MARKET ANALYSIS BY TECHNOLOGY
      83. | 6.83 ARGENTINA MARKET ANALYSIS BY APPLICATION
      84. | 6.84 ARGENTINA MARKET ANALYSIS BY END USE
      85. | 6.85 ARGENTINA MARKET ANALYSIS BY RESOURCE TYPE
      86. | 6.86 REST OF SOUTH AMERICA MARKET ANALYSIS BY TECHNOLOGY
      87. | 6.87 REST OF SOUTH AMERICA MARKET ANALYSIS BY APPLICATION
      88. | 6.88 REST OF SOUTH AMERICA MARKET ANALYSIS BY END USE
      89. | 6.89 REST OF SOUTH AMERICA MARKET ANALYSIS BY RESOURCE TYPE
      90. | 6.90 MEA MARKET ANALYSIS
      91. | 6.91 GCC COUNTRIES MARKET ANALYSIS BY TECHNOLOGY
      92. | 6.92 GCC COUNTRIES MARKET ANALYSIS BY APPLICATION
      93. | 6.93 GCC COUNTRIES MARKET ANALYSIS BY END USE
      94. | 6.94 GCC COUNTRIES MARKET ANALYSIS BY RESOURCE TYPE
      95. | 6.95 SOUTH AFRICA MARKET ANALYSIS BY TECHNOLOGY
      96. | 6.96 SOUTH AFRICA MARKET ANALYSIS BY APPLICATION
      97. | 6.97 SOUTH AFRICA MARKET ANALYSIS BY END USE
      98. | 6.98 SOUTH AFRICA MARKET ANALYSIS BY RESOURCE TYPE
      99. | 6.99 REST OF MEA MARKET ANALYSIS BY TECHNOLOGY
      100. | 6.100 REST OF MEA MARKET ANALYSIS BY APPLICATION
      101. | 6.101 REST OF MEA MARKET ANALYSIS BY END USE
      102. | 6.102 REST OF MEA MARKET ANALYSIS BY RESOURCE TYPE
      103. | 6.103 KEY BUYING CRITERIA OF ENERGY & POWER
      104. | 6.104 RESEARCH PROCESS OF MRFR
      105. | 6.105 DRO ANALYSIS OF ENERGY & POWER
      106. | 6.106 DRIVERS IMPACT ANALYSIS: ENERGY & POWER
      107. | 6.107 RESTRAINTS IMPACT ANALYSIS: ENERGY & POWER
      108. | 6.108 SUPPLY / VALUE CHAIN: ENERGY & POWER
      109. | 6.109 ENERGY & POWER, BY TECHNOLOGY, 2024 (% SHARE)
      110. | 6.110 ENERGY & POWER, BY TECHNOLOGY, 2024 TO 2035 (USD Billion)
      111. | 6.111 ENERGY & POWER, BY APPLICATION, 2024 (% SHARE)
      112. | 6.112 ENERGY & POWER, BY APPLICATION, 2024 TO 2035 (USD Billion)
      113. | 6.113 ENERGY & POWER, BY END USE, 2024 (% SHARE)
      114. | 6.114 ENERGY & POWER, BY END USE, 2024 TO 2035 (USD Billion)
      115. | 6.115 ENERGY & POWER, BY RESOURCE TYPE, 2024 (% SHARE)
      116. | 6.116 ENERGY & POWER, BY RESOURCE TYPE, 2024 TO 2035 (USD Billion)
      117. | 6.117 BENCHMARKING OF MAJOR COMPETITORS
    7. LIST OF TABLES
      1. | 7.1 LIST OF ASSUMPTIONS
      2. | | 7.1.1
      3. | 7.2 North America MARKET SIZE ESTIMATES; FORECAST
      4. | | 7.2.1 BY TECHNOLOGY, 2025-2035 (USD Billion)
      5. | | 7.2.2 BY APPLICATION, 2025-2035 (USD Billion)
      6. | | 7.2.3 BY END USE, 2025-2035 (USD Billion)
      7. | | 7.2.4 BY RESOURCE TYPE, 2025-2035 (USD Billion)
      8. | 7.3 US MARKET SIZE ESTIMATES; FORECAST
      9. | | 7.3.1 BY TECHNOLOGY, 2025-2035 (USD Billion)
      10. | | 7.3.2 BY APPLICATION, 2025-2035 (USD Billion)
      11. | | 7.3.3 BY END USE, 2025-2035 (USD Billion)
      12. | | 7.3.4 BY RESOURCE TYPE, 2025-2035 (USD Billion)
      13. | 7.4 Canada MARKET SIZE ESTIMATES; FORECAST
      14. | | 7.4.1 BY TECHNOLOGY, 2025-2035 (USD Billion)
      15. | | 7.4.2 BY APPLICATION, 2025-2035 (USD Billion)
      16. | | 7.4.3 BY END USE, 2025-2035 (USD Billion)
      17. | | 7.4.4 BY RESOURCE TYPE, 2025-2035 (USD Billion)
      18. | 7.5 Europe MARKET SIZE ESTIMATES; FORECAST
      19. | | 7.5.1 BY TECHNOLOGY, 2025-2035 (USD Billion)
      20. | | 7.5.2 BY APPLICATION, 2025-2035 (USD Billion)
      21. | | 7.5.3 BY END USE, 2025-2035 (USD Billion)
      22. | | 7.5.4 BY RESOURCE TYPE, 2025-2035 (USD Billion)
      23. | 7.6 Germany MARKET SIZE ESTIMATES; FORECAST
      24. | | 7.6.1 BY TECHNOLOGY, 2025-2035 (USD Billion)
      25. | | 7.6.2 BY APPLICATION, 2025-2035 (USD Billion)
      26. | | 7.6.3 BY END USE, 2025-2035 (USD Billion)
      27. | | 7.6.4 BY RESOURCE TYPE, 2025-2035 (USD Billion)
      28. | 7.7 UK MARKET SIZE ESTIMATES; FORECAST
      29. | | 7.7.1 BY TECHNOLOGY, 2025-2035 (USD Billion)
      30. | | 7.7.2 BY APPLICATION, 2025-2035 (USD Billion)
      31. | | 7.7.3 BY END USE, 2025-2035 (USD Billion)
      32. | | 7.7.4 BY RESOURCE TYPE, 2025-2035 (USD Billion)
      33. | 7.8 France MARKET SIZE ESTIMATES; FORECAST
      34. | | 7.8.1 BY TECHNOLOGY, 2025-2035 (USD Billion)
      35. | | 7.8.2 BY APPLICATION, 2025-2035 (USD Billion)
      36. | | 7.8.3 BY END USE, 2025-2035 (USD Billion)
      37. | | 7.8.4 BY RESOURCE TYPE, 2025-2035 (USD Billion)
      38. | 7.9 Russia MARKET SIZE ESTIMATES; FORECAST
      39. | | 7.9.1 BY TECHNOLOGY, 2025-2035 (USD Billion)
      40. | | 7.9.2 BY APPLICATION, 2025-2035 (USD Billion)
      41. | | 7.9.3 BY END USE, 2025-2035 (USD Billion)
      42. | | 7.9.4 BY RESOURCE TYPE, 2025-2035 (USD Billion)
      43. | 7.10 Italy MARKET SIZE ESTIMATES; FORECAST
      44. | | 7.10.1 BY TECHNOLOGY, 2025-2035 (USD Billion)
      45. | | 7.10.2 BY APPLICATION, 2025-2035 (USD Billion)
      46. | | 7.10.3 BY END USE, 2025-2035 (USD Billion)
      47. | | 7.10.4 BY RESOURCE TYPE, 2025-2035 (USD Billion)
      48. | 7.11 Spain MARKET SIZE ESTIMATES; FORECAST
      49. | | 7.11.1 BY TECHNOLOGY, 2025-2035 (USD Billion)
      50. | | 7.11.2 BY APPLICATION, 2025-2035 (USD Billion)
      51. | | 7.11.3 BY END USE, 2025-2035 (USD Billion)
      52. | | 7.11.4 BY RESOURCE TYPE, 2025-2035 (USD Billion)
      53. | 7.12 Rest of Europe MARKET SIZE ESTIMATES; FORECAST
      54. | | 7.12.1 BY TECHNOLOGY, 2025-2035 (USD Billion)
      55. | | 7.12.2 BY APPLICATION, 2025-2035 (USD Billion)
      56. | | 7.12.3 BY END USE, 2025-2035 (USD Billion)
      57. | | 7.12.4 BY RESOURCE TYPE, 2025-2035 (USD Billion)
      58. | 7.13 APAC MARKET SIZE ESTIMATES; FORECAST
      59. | | 7.13.1 BY TECHNOLOGY, 2025-2035 (USD Billion)
      60. | | 7.13.2 BY APPLICATION, 2025-2035 (USD Billion)
      61. | | 7.13.3 BY END USE, 2025-2035 (USD Billion)
      62. | | 7.13.4 BY RESOURCE TYPE, 2025-2035 (USD Billion)
      63. | 7.14 China MARKET SIZE ESTIMATES; FORECAST
      64. | | 7.14.1 BY TECHNOLOGY, 2025-2035 (USD Billion)
      65. | | 7.14.2 BY APPLICATION, 2025-2035 (USD Billion)
      66. | | 7.14.3 BY END USE, 2025-2035 (USD Billion)
      67. | | 7.14.4 BY RESOURCE TYPE, 2025-2035 (USD Billion)
      68. | 7.15 India MARKET SIZE ESTIMATES; FORECAST
      69. | | 7.15.1 BY TECHNOLOGY, 2025-2035 (USD Billion)
      70. | | 7.15.2 BY APPLICATION, 2025-2035 (USD Billion)
      71. | | 7.15.3 BY END USE, 2025-2035 (USD Billion)
      72. | | 7.15.4 BY RESOURCE TYPE, 2025-2035 (USD Billion)
      73. | 7.16 Japan MARKET SIZE ESTIMATES; FORECAST
      74. | | 7.16.1 BY TECHNOLOGY, 2025-2035 (USD Billion)
      75. | | 7.16.2 BY APPLICATION, 2025-2035 (USD Billion)
      76. | | 7.16.3 BY END USE, 2025-2035 (USD Billion)
      77. | | 7.16.4 BY RESOURCE TYPE, 2025-2035 (USD Billion)
      78. | 7.17 South Korea MARKET SIZE ESTIMATES; FORECAST
      79. | | 7.17.1 BY TECHNOLOGY, 2025-2035 (USD Billion)
      80. | | 7.17.2 BY APPLICATION, 2025-2035 (USD Billion)
      81. | | 7.17.3 BY END USE, 2025-2035 (USD Billion)
      82. | | 7.17.4 BY RESOURCE TYPE, 2025-2035 (USD Billion)
      83. | 7.18 Malaysia MARKET SIZE ESTIMATES; FORECAST
      84. | | 7.18.1 BY TECHNOLOGY, 2025-2035 (USD Billion)
      85. | | 7.18.2 BY APPLICATION, 2025-2035 (USD Billion)
      86. | | 7.18.3 BY END USE, 2025-2035 (USD Billion)
      87. | | 7.18.4 BY RESOURCE TYPE, 2025-2035 (USD Billion)
      88. | 7.19 Thailand MARKET SIZE ESTIMATES; FORECAST
      89. | | 7.19.1 BY TECHNOLOGY, 2025-2035 (USD Billion)
      90. | | 7.19.2 BY APPLICATION, 2025-2035 (USD Billion)
      91. | | 7.19.3 BY END USE, 2025-2035 (USD Billion)
      92. | | 7.19.4 BY RESOURCE TYPE, 2025-2035 (USD Billion)
      93. | 7.20 Indonesia MARKET SIZE ESTIMATES; FORECAST
      94. | | 7.20.1 BY TECHNOLOGY, 2025-2035 (USD Billion)
      95. | | 7.20.2 BY APPLICATION, 2025-2035 (USD Billion)
      96. | | 7.20.3 BY END USE, 2025-2035 (USD Billion)
      97. | | 7.20.4 BY RESOURCE TYPE, 2025-2035 (USD Billion)
      98. | 7.21 Rest of APAC MARKET SIZE ESTIMATES; FORECAST
      99. | | 7.21.1 BY TECHNOLOGY, 2025-2035 (USD Billion)
      100. | | 7.21.2 BY APPLICATION, 2025-2035 (USD Billion)
      101. | | 7.21.3 BY END USE, 2025-2035 (USD Billion)
      102. | | 7.21.4 BY RESOURCE TYPE, 2025-2035 (USD Billion)
      103. | 7.22 South America MARKET SIZE ESTIMATES; FORECAST
      104. | | 7.22.1 BY TECHNOLOGY, 2025-2035 (USD Billion)
      105. | | 7.22.2 BY APPLICATION, 2025-2035 (USD Billion)
      106. | | 7.22.3 BY END USE, 2025-2035 (USD Billion)
      107. | | 7.22.4 BY RESOURCE TYPE, 2025-2035 (USD Billion)
      108. | 7.23 Brazil MARKET SIZE ESTIMATES; FORECAST
      109. | | 7.23.1 BY TECHNOLOGY, 2025-2035 (USD Billion)
      110. | | 7.23.2 BY APPLICATION, 2025-2035 (USD Billion)
      111. | | 7.23.3 BY END USE, 2025-2035 (USD Billion)
      112. | | 7.23.4 BY RESOURCE TYPE, 2025-2035 (USD Billion)
      113. | 7.24 Mexico MARKET SIZE ESTIMATES; FORECAST
      114. | | 7.24.1 BY TECHNOLOGY, 2025-2035 (USD Billion)
      115. | | 7.24.2 BY APPLICATION, 2025-2035 (USD Billion)
      116. | | 7.24.3 BY END USE, 2025-2035 (USD Billion)
      117. | | 7.24.4 BY RESOURCE TYPE, 2025-2035 (USD Billion)
      118. | 7.25 Argentina MARKET SIZE ESTIMATES; FORECAST
      119. | | 7.25.1 BY TECHNOLOGY, 2025-2035 (USD Billion)
      120. | | 7.25.2 BY APPLICATION, 2025-2035 (USD Billion)
      121. | | 7.25.3 BY END USE, 2025-2035 (USD Billion)
      122. | | 7.25.4 BY RESOURCE TYPE, 2025-2035 (USD Billion)
      123. | 7.26 Rest of South America MARKET SIZE ESTIMATES; FORECAST
      124. | | 7.26.1 BY TECHNOLOGY, 2025-2035 (USD Billion)
      125. | | 7.26.2 BY APPLICATION, 2025-2035 (USD Billion)
      126. | | 7.26.3 BY END USE, 2025-2035 (USD Billion)
      127. | | 7.26.4 BY RESOURCE TYPE, 2025-2035 (USD Billion)
      128. | 7.27 MEA MARKET SIZE ESTIMATES; FORECAST
      129. | | 7.27.1 BY TECHNOLOGY, 2025-2035 (USD Billion)
      130. | | 7.27.2 BY APPLICATION, 2025-2035 (USD Billion)
      131. | | 7.27.3 BY END USE, 2025-2035 (USD Billion)
      132. | | 7.27.4 BY RESOURCE TYPE, 2025-2035 (USD Billion)
      133. | 7.28 GCC Countries MARKET SIZE ESTIMATES; FORECAST
      134. | | 7.28.1 BY TECHNOLOGY, 2025-2035 (USD Billion)
      135. | | 7.28.2 BY APPLICATION, 2025-2035 (USD Billion)
      136. | | 7.28.3 BY END USE, 2025-2035 (USD Billion)
      137. | | 7.28.4 BY RESOURCE TYPE, 2025-2035 (USD Billion)
      138. | 7.29 South Africa MARKET SIZE ESTIMATES; FORECAST
      139. | | 7.29.1 BY TECHNOLOGY, 2025-2035 (USD Billion)
      140. | | 7.29.2 BY APPLICATION, 2025-2035 (USD Billion)
      141. | | 7.29.3 BY END USE, 2025-2035 (USD Billion)
      142. | | 7.29.4 BY RESOURCE TYPE, 2025-2035 (USD Billion)
      143. | 7.30 Rest of MEA MARKET SIZE ESTIMATES; FORECAST
      144. | | 7.30.1 BY TECHNOLOGY, 2025-2035 (USD Billion)
      145. | | 7.30.2 BY APPLICATION, 2025-2035 (USD Billion)
      146. | | 7.30.3 BY END USE, 2025-2035 (USD Billion)
      147. | | 7.30.4 BY RESOURCE TYPE, 2025-2035 (USD Billion)
      148. | 7.31 PRODUCT LAUNCH/PRODUCT DEVELOPMENT/APPROVAL
      149. | | 7.31.1
      150. | 7.32 ACQUISITION/PARTNERSHIP
      151. | | 7.32.1

    Geothermal Power Market Segmentation

    Geothermal Power Market By Technology (USD Billion, 2019-2035)

    Flash Steam

    Binary Cycle

    Dry Steam

    Geothermal Heat Pumps


    Geothermal Power Market By Application (USD Billion, 2019-2035)

    Electricity Generation

    Direct Use Applications

    District Heating


    Geothermal Power Market By End Use (USD Billion, 2019-2035)

    Residential

    Commercial

    Industrial


    Geothermal Power Market By Resource Type (USD Billion, 2019-2035)

    Hydrothermal

    Enhanced Geothermal Systems

    Hot Dry Rock


    Geothermal Power Market By Regional (USD Billion, 2019-2035)

    North America

    Europe

    South America

    Asia Pacific

    Middle East and Africa


    Geothermal Power Market Regional Outlook (USD Billion, 2019-2035)


    North America Outlook (USD Billion, 2019-2035)

    North America Geothermal Power Market by Technology Type

    Flash Steam

    Binary Cycle

    Dry Steam

    Geothermal Heat Pumps

    North America Geothermal Power Market by Application Type

    Electricity Generation

    Direct Use Applications

    District Heating

    North America Geothermal Power Market by End Use Type

    Residential

    Commercial

    Industrial

    North America Geothermal Power Market by Resource Type

    Hydrothermal

    Enhanced Geothermal Systems

    Hot Dry Rock

    North America Geothermal Power Market by Regional Type

    US

    Canada

    US Outlook (USD Billion, 2019-2035)

    US Geothermal Power Market by Technology Type

    Flash Steam

    Binary Cycle

    Dry Steam

    Geothermal Heat Pumps

    US Geothermal Power Market by Application Type

    Electricity Generation

    Direct Use Applications

    District Heating

    US Geothermal Power Market by End Use Type

    Residential

    Commercial

    Industrial

    US Geothermal Power Market by Resource Type

    Hydrothermal

    Enhanced Geothermal Systems

    Hot Dry Rock
    CANADA Outlook (USD Billion, 2019-2035)

    CANADA Geothermal Power Market by Technology Type

    Flash Steam

    Binary Cycle

    Dry Steam

    Geothermal Heat Pumps

    CANADA Geothermal Power Market by Application Type

    Electricity Generation

    Direct Use Applications

    District Heating

    CANADA Geothermal Power Market by End Use Type

    Residential

    Commercial

    Industrial

    CANADA Geothermal Power Market by Resource Type

    Hydrothermal

    Enhanced Geothermal Systems

    Hot Dry Rock

    Europe Outlook (USD Billion, 2019-2035)

    Europe Geothermal Power Market by Technology Type

    Flash Steam

    Binary Cycle

    Dry Steam

    Geothermal Heat Pumps

    Europe Geothermal Power Market by Application Type

    Electricity Generation

    Direct Use Applications

    District Heating

    Europe Geothermal Power Market by End Use Type

    Residential

    Commercial

    Industrial

    Europe Geothermal Power Market by Resource Type

    Hydrothermal

    Enhanced Geothermal Systems

    Hot Dry Rock

    Europe Geothermal Power Market by Regional Type

    Germany

    UK

    France

    Russia

    Italy

    Spain

    Rest of Europe

    GERMANY Outlook (USD Billion, 2019-2035)

    GERMANY Geothermal Power Market by Technology Type

    Flash Steam

    Binary Cycle

    Dry Steam

    Geothermal Heat Pumps

    GERMANY Geothermal Power Market by Application Type

    Electricity Generation

    Direct Use Applications

    District Heating

    GERMANY Geothermal Power Market by End Use Type

    Residential

    Commercial

    Industrial

    GERMANY Geothermal Power Market by Resource Type

    Hydrothermal

    Enhanced Geothermal Systems

    Hot Dry Rock

    UK Outlook (USD Billion, 2019-2035)

    UK Geothermal Power Market by Technology Type

    Flash Steam

    Binary Cycle

    Dry Steam

    Geothermal Heat Pumps

    UK Geothermal Power Market by Application Type

    Electricity Generation

    Direct Use Applications

    District Heating

    UK Geothermal Power Market by End Use Type

    Residential

    Commercial

    Industrial

    UK Geothermal Power Market by Resource Type

    Hydrothermal

    Enhanced Geothermal Systems

    Hot Dry Rock
    FRANCE Outlook (USD Billion, 2019-2035)

    FRANCE Geothermal Power Market by Technology Type

    Flash Steam

    Binary Cycle

    Dry Steam

    Geothermal Heat Pumps

    FRANCE Geothermal Power Market by Application Type

    Electricity Generation

    Direct Use Applications

    District Heating

    FRANCE Geothermal Power Market by End Use Type

    Residential

    Commercial

    Industrial

    FRANCE Geothermal Power Market by Resource Type

    Hydrothermal

    Enhanced Geothermal Systems

    Hot Dry Rock

    RUSSIA Outlook (USD Billion, 2019-2035)

    RUSSIA Geothermal Power Market by Technology Type

    Flash Steam

    Binary Cycle

    Dry Steam

    Geothermal Heat Pumps

    RUSSIA Geothermal Power Market by Application Type

    Electricity Generation

    Direct Use Applications

    District Heating

    RUSSIA Geothermal Power Market by End Use Type

    Residential

    Commercial

    Industrial

    RUSSIA Geothermal Power Market by Resource Type

    Hydrothermal

    Enhanced Geothermal Systems

    Hot Dry Rock

    ITALY Outlook (USD Billion, 2019-2035)

    ITALY Geothermal Power Market by Technology Type

    Flash Steam

    Binary Cycle

    Dry Steam

    Geothermal Heat Pumps

    ITALY Geothermal Power Market by Application Type

    Electricity Generation

    Direct Use Applications

    District Heating

    ITALY Geothermal Power Market by End Use Type

    Residential

    Commercial

    Industrial

    ITALY Geothermal Power Market by Resource Type

    Hydrothermal

    Enhanced Geothermal Systems

    Hot Dry Rock

    SPAIN Outlook (USD Billion, 2019-2035)

    SPAIN Geothermal Power Market by Technology Type

    Flash Steam

    Binary Cycle

    Dry Steam

    Geothermal Heat Pumps

    SPAIN Geothermal Power Market by Application Type

    Electricity Generation

    Direct Use Applications

    District Heating

    SPAIN Geothermal Power Market by End Use Type

    Residential

    Commercial

    Industrial

    SPAIN Geothermal Power Market by Resource Type

    Hydrothermal

    Enhanced Geothermal Systems

    Hot Dry Rock

    REST OF EUROPE Outlook (USD Billion, 2019-2035)

    REST OF EUROPE Geothermal Power Market by Technology Type

    Flash Steam

    Binary Cycle

    Dry Steam

    Geothermal Heat Pumps

    REST OF EUROPE Geothermal Power Market by Application Type

    Electricity Generation

    Direct Use Applications

    District Heating

    REST OF EUROPE Geothermal Power Market by End Use Type

    Residential

    Commercial

    Industrial

    REST OF EUROPE Geothermal Power Market by Resource Type

    Hydrothermal

    Enhanced Geothermal Systems

    Hot Dry Rock

    APAC Outlook (USD Billion, 2019-2035)

    APAC Geothermal Power Market by Technology Type

    Flash Steam

    Binary Cycle

    Dry Steam

    Geothermal Heat Pumps

    APAC Geothermal Power Market by Application Type

    Electricity Generation

    Direct Use Applications

    District Heating

    APAC Geothermal Power Market by End Use Type

    Residential

    Commercial

    Industrial

    APAC Geothermal Power Market by Resource Type

    Hydrothermal

    Enhanced Geothermal Systems

    Hot Dry Rock

    APAC Geothermal Power Market by Regional Type

    China

    India

    Japan

    South Korea

    Malaysia

    Thailand

    Indonesia

    Rest of APAC

    CHINA Outlook (USD Billion, 2019-2035)

    CHINA Geothermal Power Market by Technology Type

    Flash Steam

    Binary Cycle

    Dry Steam

    Geothermal Heat Pumps

    CHINA Geothermal Power Market by Application Type

    Electricity Generation

    Direct Use Applications

    District Heating

    CHINA Geothermal Power Market by End Use Type

    Residential

    Commercial

    Industrial

    CHINA Geothermal Power Market by Resource Type

    Hydrothermal

    Enhanced Geothermal Systems

    Hot Dry Rock

    INDIA Outlook (USD Billion, 2019-2035)

    INDIA Geothermal Power Market by Technology Type

    Flash Steam

    Binary Cycle

    Dry Steam

    Geothermal Heat Pumps

    INDIA Geothermal Power Market by Application Type

    Electricity Generation

    Direct Use Applications

    District Heating

    INDIA Geothermal Power Market by End Use Type

    Residential

    Commercial

    Industrial

    INDIA Geothermal Power Market by Resource Type

    Hydrothermal

    Enhanced Geothermal Systems

    Hot Dry Rock

    JAPAN Outlook (USD Billion, 2019-2035)

    JAPAN Geothermal Power Market by Technology Type

    Flash Steam

    Binary Cycle

    Dry Steam

    Geothermal Heat Pumps

    JAPAN Geothermal Power Market by Application Type

    Electricity Generation

    Direct Use Applications

    District Heating

    JAPAN Geothermal Power Market by End Use Type

    Residential

    Commercial

    Industrial

    JAPAN Geothermal Power Market by Resource Type

    Hydrothermal

    Enhanced Geothermal Systems

    Hot Dry Rock

    SOUTH KOREA Outlook (USD Billion, 2019-2035)

    SOUTH KOREA Geothermal Power Market by Technology Type

    Flash Steam

    Binary Cycle

    Dry Steam

    Geothermal Heat Pumps

    SOUTH KOREA Geothermal Power Market by Application Type

    Electricity Generation

    Direct Use Applications

    District Heating

    SOUTH KOREA Geothermal Power Market by End Use Type

    Residential

    Commercial

    Industrial

    SOUTH KOREA Geothermal Power Market by Resource Type

    Hydrothermal

    Enhanced Geothermal Systems

    Hot Dry Rock

    MALAYSIA Outlook (USD Billion, 2019-2035)

    MALAYSIA Geothermal Power Market by Technology Type

    Flash Steam

    Binary Cycle

    Dry Steam

    Geothermal Heat Pumps

    MALAYSIA Geothermal Power Market by Application Type

    Electricity Generation

    Direct Use Applications

    District Heating

    MALAYSIA Geothermal Power Market by End Use Type

    Residential

    Commercial

    Industrial

    MALAYSIA Geothermal Power Market by Resource Type

    Hydrothermal

    Enhanced Geothermal Systems

    Hot Dry Rock

    THAILAND Outlook (USD Billion, 2019-2035)

    THAILAND Geothermal Power Market by Technology Type

    Flash Steam

    Binary Cycle

    Dry Steam

    Geothermal Heat Pumps

    THAILAND Geothermal Power Market by Application Type

    Electricity Generation

    Direct Use Applications

    District Heating

    THAILAND Geothermal Power Market by End Use Type

    Residential

    Commercial

    Industrial

    THAILAND Geothermal Power Market by Resource Type

    Hydrothermal

    Enhanced Geothermal Systems

    Hot Dry Rock

    INDONESIA Outlook (USD Billion, 2019-2035)

    INDONESIA Geothermal Power Market by Technology Type

    Flash Steam

    Binary Cycle

    Dry Steam

    Geothermal Heat Pumps

    INDONESIA Geothermal Power Market by Application Type

    Electricity Generation

    Direct Use Applications

    District Heating

    INDONESIA Geothermal Power Market by End Use Type

    Residential

    Commercial

    Industrial

    INDONESIA Geothermal Power Market by Resource Type

    Hydrothermal

    Enhanced Geothermal Systems

    Hot Dry Rock

    REST OF APAC Outlook (USD Billion, 2019-2035)

    REST OF APAC Geothermal Power Market by Technology Type

    Flash Steam

    Binary Cycle

    Dry Steam

    Geothermal Heat Pumps

    REST OF APAC Geothermal Power Market by Application Type

    Electricity Generation

    Direct Use Applications

    District Heating

    REST OF APAC Geothermal Power Market by End Use Type

    Residential

    Commercial

    Industrial

    REST OF APAC Geothermal Power Market by Resource Type

    Hydrothermal

    Enhanced Geothermal Systems

    Hot Dry Rock

    South America Outlook (USD Billion, 2019-2035)

    South America Geothermal Power Market by Technology Type

    Flash Steam

    Binary Cycle

    Dry Steam

    Geothermal Heat Pumps

    South America Geothermal Power Market by Application Type

    Electricity Generation

    Direct Use Applications

    District Heating

    South America Geothermal Power Market by End Use Type

    Residential

    Commercial

    Industrial

    South America Geothermal Power Market by Resource Type

    Hydrothermal

    Enhanced Geothermal Systems

    Hot Dry Rock

    South America Geothermal Power Market by Regional Type

    Brazil

    Mexico

    Argentina

    Rest of South America

    BRAZIL Outlook (USD Billion, 2019-2035)

    BRAZIL Geothermal Power Market by Technology Type

    Flash Steam

    Binary Cycle

    Dry Steam

    Geothermal Heat Pumps

    BRAZIL Geothermal Power Market by Application Type

    Electricity Generation

    Direct Use Applications

    District Heating

    BRAZIL Geothermal Power Market by End Use Type

    Residential

    Commercial

    Industrial

    BRAZIL Geothermal Power Market by Resource Type

    Hydrothermal

    Enhanced Geothermal Systems

    Hot Dry Rock

    MEXICO Outlook (USD Billion, 2019-2035)

    MEXICO Geothermal Power Market by Technology Type

    Flash Steam

    Binary Cycle

    Dry Steam

    Geothermal Heat Pumps

    MEXICO Geothermal Power Market by Application Type

    Electricity Generation

    Direct Use Applications

    District Heating

    MEXICO Geothermal Power Market by End Use Type

    Residential

    Commercial

    Industrial

    MEXICO Geothermal Power Market by Resource Type

    Hydrothermal

    Enhanced Geothermal Systems

    Hot Dry Rock

    ARGENTINA Outlook (USD Billion, 2019-2035)

    ARGENTINA Geothermal Power Market by Technology Type

    Flash Steam

    Binary Cycle

    Dry Steam

    Geothermal Heat Pumps

    ARGENTINA Geothermal Power Market by Application Type

    Electricity Generation

    Direct Use Applications

    District Heating

    ARGENTINA Geothermal Power Market by End Use Type

    Residential

    Commercial

    Industrial

    ARGENTINA Geothermal Power Market by Resource Type

    Hydrothermal

    Enhanced Geothermal Systems

    Hot Dry Rock

    REST OF SOUTH AMERICA Outlook (USD Billion, 2019-2035)

    REST OF SOUTH AMERICA Geothermal Power Market by Technology Type

    Flash Steam

    Binary Cycle

    Dry Steam

    Geothermal Heat Pumps

    REST OF SOUTH AMERICA Geothermal Power Market by Application Type

    Electricity Generation

    Direct Use Applications

    District Heating

    REST OF SOUTH AMERICA Geothermal Power Market by End Use Type

    Residential

    Commercial

    Industrial

    REST OF SOUTH AMERICA Geothermal Power Market by Resource Type

    Hydrothermal

    Enhanced Geothermal Systems

    Hot Dry Rock

    MEA Outlook (USD Billion, 2019-2035)

    MEA Geothermal Power Market by Technology Type

    Flash Steam

    Binary Cycle

    Dry Steam

    Geothermal Heat Pumps

    MEA Geothermal Power Market by Application Type

    Electricity Generation

    Direct Use Applications

    District Heating

    MEA Geothermal Power Market by End Use Type

    Residential

    Commercial

    Industrial

    MEA Geothermal Power Market by Resource Type

    Hydrothermal

    Enhanced Geothermal Systems

    Hot Dry Rock

    MEA Geothermal Power Market by Regional Type

    GCC Countries

    South Africa

    Rest of MEA

    GCC COUNTRIES Outlook (USD Billion, 2019-2035)

    GCC COUNTRIES Geothermal Power Market by Technology Type

    Flash Steam

    Binary Cycle

    Dry Steam

    Geothermal Heat Pumps

    GCC COUNTRIES Geothermal Power Market by Application Type

    Electricity Generation

    Direct Use Applications

    District Heating

    GCC COUNTRIES Geothermal Power Market by End Use Type

    Residential

    Commercial

    Industrial

    GCC COUNTRIES Geothermal Power Market by Resource Type

    Hydrothermal

    Enhanced Geothermal Systems

    Hot Dry Rock

    SOUTH AFRICA Outlook (USD Billion, 2019-2035)

    SOUTH AFRICA Geothermal Power Market by Technology Type

    Flash Steam

    Binary Cycle

    Dry Steam

    Geothermal Heat Pumps

    SOUTH AFRICA Geothermal Power Market by Application Type

    Electricity Generation

    Direct Use Applications

    District Heating

    SOUTH AFRICA Geothermal Power Market by End Use Type

    Residential

    Commercial

    Industrial

    SOUTH AFRICA Geothermal Power Market by Resource Type

    Hydrothermal

    Enhanced Geothermal Systems

    Hot Dry Rock

    REST OF MEA Outlook (USD Billion, 2019-2035)

    REST OF MEA Geothermal Power Market by Technology Type

    Flash Steam

    Binary Cycle

    Dry Steam

    Geothermal Heat Pumps

    REST OF MEA Geothermal Power Market by Application Type

    Electricity Generation

    Direct Use Applications

    District Heating

    REST OF MEA Geothermal Power Market by End Use Type

    Residential

    Commercial

    Industrial

    REST OF MEA Geothermal Power Market by Resource Type

    Hydrothermal

    Enhanced Geothermal Systems

    Hot Dry Rock


    Infographic

    Free Sample Request

    Kindly complete the form below to receive a free sample of this Report

    Get Free Sample

    Customer Strories

    “I am very pleased with how market segments have been defined in a relevant way for my purposes (such as "Portable Freezers & refrigerators" and "last-mile"). In general the report is well structured. Thanks very much for your efforts.”

    Victoria Milne

    Founder
    Case Study
    Chemicals and Materials

    Compare Licence

    ×
    Features License Type
    Single User Multiuser License Enterprise User
    Price $4,950 $5,950 $7,250
    Maximum User Access Limit 1 User Upto 10 Users Unrestricted Access Throughout the Organization
    Free Customization
    Direct Access to Analyst
    Deliverable Format
    Platform Access
    Discount on Next Purchase 10% 15% 15%
    Printable Versions