• Cat-intel
  • MedIntelliX
  • Resources
  • About Us
  • Hero Background
    English
    Chinese
    French
    Japanese
    Korean
    German
    Spanish

    Global Lubricants Market Share

    ID: MRFR/CnM/4733-CR
    100 Pages
    Chitranshi Jaiswal
    July 2018

    ASEAN, GCC, India, Africa Lubricants Market Research Report Information: Base Oil (Mineral Oil) Application (Automotive) End-user (Energy) – Forecast Till 2035

    Share:
    Download PDF ×

    We do not share your information with anyone. However, we may send you emails based on your report interest from time to time. You may contact us at any time to opt-out.

    Global Lubricants Market Infographic
    $ 4,950.0
    $ 5,950.0
    $ 7,250.0

    Market Share

    Global Lubricants Market Share Analysis

    Across numerous African nations, the reliance on agriculture remains paramount. The agricultural sector stands as a robust contributor, generating up to 50% of the gross domestic product (GDP) and accounting for over 80% of trade value and 50% of raw materials for industries. Sub-Saharan African (SSA) countries heavily lean on this sector, providing employment for a majority of the population. The Farm Power and Mechanization Group, housed within the Food and Agriculture Organization of the United Nations, offers an expansive view, encompassing machinery, equipment, and manual tools in its definition of farm power sources. Over time, agricultural mechanization has seen incremental growth, particularly in the Southern African region since the 1950s.

    Presently, the agricultural landscape in Southern Africa predominantly relies on human and animal power, utilizing manually operated tools like hoes and other hand tools for various operations. Recent insights from the Farm Power and Mechanization Group highlight a noteworthy upsurge in the mechanization of agricultural tools and equipment, alongside increased usage of liquid fuel-based machinery.

    This surge in mechanization stems from significant shortcomings associated with reliance on animal and human power in agricultural production. Issues such as severe health implications and a rapidly changing demographic structure have led to a decline in their use. Consequently, there is a rising demand for tractors and other liquid fuel-based farm machinery. The decrease in human-powered agriculture has resulted in reduced cultivation areas, delayed cultivation periods, and limitations in cultivating labor-intensive crops. Collectively, this downward trend in food security, diminishing nutritional status, and declining productivity, all rooted in outdated agricultural practices, are anticipated to propel the adoption of agricultural machinery in the region. Consequently, this surge is expected to boost the demand for lubricants in African markets.

    The growing adoption of agricultural machinery signifies a pivotal shift in enhancing agricultural productivity and addressing prevalent challenges within the sector. The transition from labor-intensive manual operations to mechanized processes holds the promise of not only increasing efficiency but also improving overall output. The mechanization trend is poised to revolutionize agricultural practices, fostering sustainable growth and paving the way for heightened agricultural output across various African nations.

    Furthermore, this transformation in agricultural practices is expected to create new opportunities within the lubricants market in Africa. As machinery becomes the cornerstone of agricultural operations, the demand for lubricants, essential for the smooth functioning and maintenance of these machines, is set to witness a significant surge. Lubricants, playing a crucial role in ensuring the longevity and optimal performance of agricultural equipment, are poised to become an indispensable component of the evolving agricultural landscape in Africa.

    In essence, the burgeoning demand for agricultural equipment in Africa stands as a beacon of opportunity. It not only signifies a fundamental shift towards modernized and efficient agricultural practices but also underscores the imminent need for complementary products such as lubricants. This paradigm shift offers an enticing prospect for stakeholders in the lubricants industry to capitalize on the burgeoning demand and actively participate in the transformative journey of African agriculture.

    Market Summary

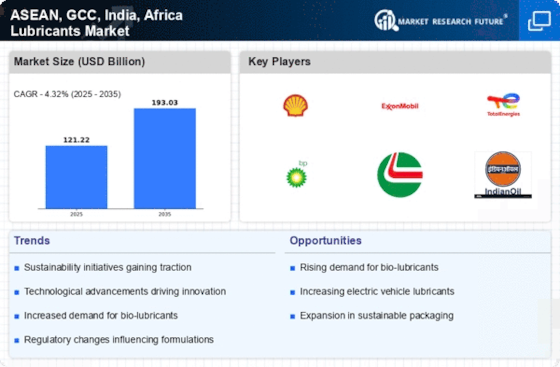
    The global lubricants market in ASEAN, GCC, India, and Africa is projected to grow steadily from 121.22 USD Billion in 2024 to 193.03 USD Billion by 2035.

    Key Market Trends & Highlights

    ASEAN, GCC, India, Africa Lubricants Key Trends and Highlights

    • The market is expected to achieve a compound annual growth rate (CAGR) of 2.52% from 2025 to 2035.
    • By 2035, the market valuation is anticipated to reach 159.5 USD Billion, reflecting a robust growth trajectory.
    • in 2024, the market is valued at 121.22 USD Billion, indicating a strong foundation for future expansion.
    • Growing adoption of advanced lubrication technologies due to increasing industrialization is a major market driver.

    Market Size & Forecast

    2024 Market Size 121.22 (USD Billion)
    2035 Market Size 193.03 (USD Billion)
    CAGR (2025-2035) 4.32%
    Largest Regional Market Share in 2024 latin_america)

    Major Players

    PetroChina Company Ltd., Morris Lubricants, Indian Oil Corporation Limited, Calumet Specialty Products Partners, L.P, Quaker Chemical Corporation, AMSOIL INC., Valvoline, Inc., Sinopec Corporation, Lucas Oil Products, Inc., Phillips 66 Company, Yushiro Chemical Industry, Chevron Corporation, BP Plc, Exxon Mobil Corporation, Lukoil, Petronas, Clariant, Fuchs Petrolub SE, Rock Valley Oil and Chemical Co., Gulf Oil India, Royal Dutch Shell Plc, Total S.A.

    Market Trends

    The lubricants market across ASEAN, GCC, India, and Africa is poised for robust growth, driven by increasing industrialization and rising automotive production, which collectively suggest a burgeoning demand for high-performance lubricants.

    ASEAN Economic Community (AEC) Report

    Global Lubricants Market Market Drivers

    Rising Automotive Production

    The Global ASEAN, GCC, India, Africa Lubricants Market Industry experiences a notable boost due to the increasing automotive production across these regions. In 2024, the automotive sector is projected to contribute significantly to the lubricant demand, driven by a growing middle-class population and urbanization. For instance, India is witnessing a surge in vehicle manufacturing, with production expected to reach 5 million units in 2024. This growth in automotive production correlates with an increased need for high-performance lubricants, thereby propelling the market value, which is anticipated to reach 121.2 USD Billion in 2024.

    Growing Demand for Renewable Energy

    The Global ASEAN, GCC, India, Africa Lubricants Market Industry is witnessing a shift towards renewable energy sources, which is likely to impact lubricant demand. As countries in these regions invest in renewable energy infrastructure, such as wind and solar power, the need for specialized lubricants for machinery and equipment used in these sectors is increasing. This trend may lead to a diversification of lubricant products, catering to the unique requirements of renewable energy applications, thereby expanding the market's scope and potential.

    Technological Advancements in Lubricants

    Technological advancements in lubricant formulations are significantly influencing the Global ASEAN, GCC, India, Africa Lubricants Market Industry. Innovations such as synthetic lubricants and bio-based alternatives are gaining traction, driven by the need for enhanced performance and environmental sustainability. For instance, the introduction of advanced additives improves the efficiency and longevity of lubricants, appealing to both automotive and industrial sectors. This shift towards high-tech lubricants is expected to support the market's growth trajectory, as consumers increasingly demand products that offer superior performance and lower environmental impact.

    Industrial Growth and Infrastructure Development

    The Global ASEAN, GCC, India, Africa Lubricants Market Industry is poised for expansion due to robust industrial growth and infrastructure development initiatives. Governments in these regions are investing heavily in infrastructure projects, which in turn drives the demand for industrial lubricants. For example, the GCC countries are focusing on diversifying their economies away from oil dependency, leading to increased manufacturing activities. This trend is likely to enhance the lubricant market, with projections indicating a market value of 159.5 USD Billion by 2035, reflecting a compound annual growth rate of 2.52% from 2025 to 2035.

    Regulatory Compliance and Environmental Standards

    The Global ASEAN, GCC, India, Africa Lubricants Market Industry is also shaped by stringent regulatory compliance and environmental standards. Governments are implementing regulations aimed at reducing emissions and promoting the use of eco-friendly lubricants. For example, the European Union's regulations on lubricants are influencing global standards, prompting manufacturers in ASEAN and GCC regions to adapt their products accordingly. This regulatory landscape encourages the development of environmentally friendly lubricants, which could potentially enhance market growth as companies strive to meet these evolving standards.

    Market Segment Insights

    Regional Insights

    Key Companies in the Global Lubricants Market market include

    Industry Developments

    Future Outlook

    Global Lubricants Market Future Outlook

    The ASEAN, GCC, India, Africa Lubricants Market is projected to grow at 4.30% CAGR from 2025 to 2035, driven by industrial expansion, automotive growth, and sustainability initiatives.

    New opportunities lie in:

    • Develop bio-based lubricants to meet rising environmental regulations.
    • Invest in advanced synthetic lubricants for high-performance applications.
    • Leverage digital technologies for predictive maintenance solutions in lubrication systems.

    By 2035, the market is expected to achieve robust growth, reflecting evolving consumer demands and technological advancements.

    Market Segmentation

    Report Overview

    Region
    • ASEAN; Vietnam, Malaysia, Thailand, Singapore, Indonesia, Rest of ASEAN
    • GCC; Saudi Arabia, UAE, Qatar, Oman, Kuwait, Bahrain
    • India;
    • Africa; South Africa, Nigeria, Tanzania, Kenya, Egypt, Ghana, Rest of Africa
    Base Oil
    • Mineral oil
    • Synthetic oil
    • Bio-based oil
    End-user
    • Food Processing
    • Construction & Mining
    • Metal Production
    • Cement Production
    • Textile
    • General Industrial Manufacturing
    • Chemical Manufacturing
    • Energy
    Application
    • {"Automotive"=>["Transmission Fluids", "Break Oil", "Greases", "Coolants", "Engine Oil", "Gear Oil"]}
    • {"Industrial"=>["Hydraulic oil", "Process oil", "Industrial engine oil", "Turbine oil", "Greases", "General industrial oil", "Compressor oil", "Metalworking fluids", "Others"]}
    Analysis Period
    • Base Year - 2020
    • Projection Period - From 2021 to 2030
    • Market Denomination - USD Million
    • Volume Unit - Kilotons
    • Conversion Rate - Considered as per the respective financial years
    Intended Audience
    • Associations
    • Government
    • Lubricants manufacturers
    • Suppliers and distributors
    • Potential investors
    • Raw material suppliers
    • End Use Industries

    Report Scope

    Report Attribute/Metric Details
    Market Size 2024 USD 121.22 Billion
    Market Size 2035 193.03 (Value (USD Billion))
    Compound Annual Growth Rate (CAGR) 4.32% (2025 - 2035)
    Base Year 2024
    Market Forecast Period 2025 - 2035
    Historical Data 2019 & 2020
    Market Forecast Units Value (USD Billion)
    Report Coverage   Revenue Forecast, Competitive Landscape, Growth Factors, and Trends
    Segments Covered Base Oil, Application, End-user
    Geographies Covered North America, Europe, Asia-Pacific, and Rest of the World (RoW)
    Countries Covered The US, Canada, Germany, France, the UK, Italy, Spain, China, Japan, India, Australia, South Korea, and Brazil
    Key Companies Profiled PetroChina Company Ltd., Morris Lubricants, Indian Oil Corporation Limited, Calumet Specialty Products Partners, L.P, Quaker Chemical Corporation, AMSOIL INC., Valvoline, Inc., Sinopec Corporation, Lucas Oil Products, Inc., Phillips 66 Company, Yushiro Chemical Industry, Chevron Corporation, BP Plc, Exxon Mobil Corporation, Lukoil, Petronas, Clariant, Fuchs Petrolub SE, Rock Valley Oil and Chemical Co., Gulf Oil India, Royal Dutch Shell Plc, Total S.A.,
    Key Market Opportunities New product launches and R&D Amongst major key Players
    Key Market Dynamics Massive demand of lubricants from the automotive sector
    Market Size 2025 126.46 (Value (USD Billion))

    Market Highlights

    Author

    Chitranshi Jaiswal
    Research Analyst Level I

    She holds an experience of about 6+ years in market research and business consulting, working under the spectrum of information communication technology, telecommunications and semiconductor domains. aarti conceptualizes and implements a scalable business strategy and provides strategic leadership to the clients. her expertise lies in market estimation, competitive intelligence, pipeline analysis, customer assessment, etc.

    Leave a Comment

    Latest Comments

    John Doe
    john@example.com

    This is a great article! Really helped me understand the topic better.

    Posted on July 23, 2025, 10:15 AM
    Jane Smith
    jane@domain.com

    Thanks for sharing this. I’ve bookmarked it for later reference.

    Posted on July 22, 2025, 7:45 PM

    FAQs

    What is the expected valuation of the ASEAN, GCC, India, Africa lubricants market?

    The ASEAN, GCC, India, Africa lubricants market is expected to touch USD 193.03 Billion by 2035.

    What is the expected growth rate of the ASEAN, GCC, India, Africa lubricants market?

    Lubricants Market is projected to grow at a CAGR of 4.32% during the forecast period, 2025-2035

    What are the drivers of the ASEAN, GCC, India, Africa lubricants market?

    Massive demand of lubricants from the automotive sector can drive the ASEAN, GCC, India, Africa lubricants market.

    What are major restraints of the ASEAN, GCC, India, Africa lubricants market?

    Disposal of lubricants and production of electric vehicles are threats for the ASEAN, GCC, India, Africa lubricants market.

    Which application within the ASEAN, GCC, India, Africa lubricants market can display a respectable growth rate?

    Lubricants Market is projected to register a CAGR of 4.32% from 2025-2035

    Who are the key players of the ASEAN, GCC, India, Africa lubricants market?

    Morris Lubricants, Valvoline, Inc., Sinopec Corporation, Lukoil, Calumet Specialty Products Partners, L.P, Chevron Corporation, Total S., Exxon Mobil Corporation, Fuchs Petrolub SE, Phillips 66 Company, Gulf Oil India, Lucas Oil Products, Inc., Yushiro Chemical Industry, Royal Dutch Shell Plc, AMSOIL INC., PetroChina Company Ltd., Clariant, BP Plc, Rock Valley Oil and Chemical Co., Quaker Chemical Corporation, Petronas, Indian Oil Corporation Limited are the key players in the ASEAN, GCC, India, Africa lubricants market.

    1. Report Prologue
      1. \r\n
      2. \r\n
      3. \r\n
      4. \r\n2
      5. Market Introduction
      6. \r\n
      7. \r\n2.1 Introduction
      8. \r\n
      9. \r\n2.2
      10. Assumptions & Limitations
      11. \r\n
      12. \r\n3 Research Methodology
      13. \r\n
      14. \r\n3.1
      15. Research Process
      16. \r\n
      17. \r\n3.2 Primary Research
      18. \r\n
      19. \r\n3.3
      20. Secondary Research
      21. \r\n
      22. \r\n3.4 Market Size Estimation
      23. \r\n
      24. \r\n4
      25. Market Dynamics
      26. \r\n
      27. \r\n4.1 Introduction
      28. \r\n
      29. \r\n4.2
      30. Drivers
      31. \r\n
      32. \r\n4.2.1 Increasing Demand From The Automotive Industry
      33. In ASEAN & South Africa
      34. \r\n
      35. \r\n4.2.2 Strong Performance
      36. Of Industrial Sector And Wide Application Scope Of Lubricants
      37. \r\n
      38. \r\n4.2.3
      39. Increasing Awareness Linked With Strict Governmental Regulations Surging The Sales
      40. Ofsynthetic Lubricants
      41. \r\n
      42. \r\n4.3 Restraints
      43. \r\n
      44. \r\n4.3.1
      45. Rising Environmental Concerns Regarding Usage, Disposal, And Recycling Of Lubricants
      46. \r\n
      47. \r\n4.3.2
      48. Increasing Prevalence Of Electric Vehicles Resulting In Declining Demand
      49. \r\n
      50. \r\n4.4
      51. Trends & Opportunities
      52. \r\n
      53. \r\n4.4.1 Significant FDI In The
      54. ASEAN Industrial Sector
      55. \r\n
      56. \r\n4.4.2 Sanguine Demand For Agricultural
      57. Equipment In African Region To Offer Lucrative Opportunities
      58. \r\n
      59. \r\n4.5
      60. Challenge
      61. \r\n
      62. \r\n4.5.1 High Cost Of Bio-Based Lubricants
      63. \r\n
      64. \r\n5
      65. Market Factor Analysis
      66. \r\n
      67. \r\n5.1 Supply Chain Analysis
      68. \r\n
      69. \r\n5.1.1
      70. Raw Material Suppliers
      71. \r\n
      72. \r\n5.1.2 Lubriacants Producers
      73. \r\n
      74. \r\n5.1.3
      75. Distributors
      76. \r\n
      77. \r\n5.1.4 End Use Industries
      78. \r\n
      79. \r\n5.2
      80. Porter’s Five Forces Model
      81. \r\n
      82. \r\n5.2.1 Bargaining Power
      83. Of Suppliers
      84. \r\n
      85. \r\n5.2.2 Bargaining Power Of Buyers
      86. \r\n
      87. \r\n5.2.3
      88. Threat Of New Entrants
      89. \r\n
      90. \r\n5.2.4 Threat Of Substitutes
      91. \r\n
      92. \r\n5.2.5
      93. Intensity Of Rivalry
      94. \r\n
      95. \r\n6 ASEAN, Africa, India, & G.C.C.
    2. Lubricants Market, By Base Oil
      1. \r\n
      2. \r\n6.1 Overview
      3. \r\n
      4. \r\n6.1.1
      5. Mineral Oil
      6. \r\n
      7. \r\n6.1.1.1 Market Estimates & Forecast,
      8. \r\n
      9. \r\n6.1.1.2 Market Estimates & Forecast By
      10. Region/Country, 2020-2027
      11. \r\n
      12. \r\n6.1.2 Synthetic Oil
      13. \r\n
      14. \r\n6.1.2.1
      15. Market Estimates & Forecast, 2020-2027
      16. \r\n
      17. \r\n6.1.2.2 Market
      18. Estimates & Forecast By Region/Country, 2020-2027
      19. \r\n
      20. \r\n6.1.3
      21. Bio Based Oil
      22. \r\n
      23. \r\n6.1.3.1 Market Estimates & Forecast,
      24. \r\n
      25. \r\n6.1.3.2 Market Estimates & Forecast By
      26. Region/Country, 2020-2027
      27. \r\n
      28. \r\n7 ASEAN, Africa, India, &
    3. G.C.C. Lubricants Market, By Application
      1. \r\n
      2. \r\n7.1 Overview
      3. \r\n
      4. \r\n7.1.1
      5. Automotive
      6. \r\n
      7. \r\n7.1.1.1 Market Estimates & Forecast, 2020-2027
      8. \r\n
      9. \r\n7.1.1.2
      10. Market Estimates & Forecast By Region/Country, 2020-2027
      11. \r\n
      12. \r\n7.1.1.3
      13. Engine Oil
      14. \r\n
      15. \r\n7.1.1.3.1 Market Estimates & Forecast,
      16. \r\n
      17. \r\n7.1.1.3.2 Market Estimates & Forecast By
      18. Region/Country, 2020-2027
      19. \r\n
      20. \r\n7.1.1.4 Gear Oil
      21. \r\n
      22. \r\n7.1.1.4.1
      23. Market Estimates & Forecast, 2020-2027
      24. \r\n
      25. \r\n7.1.1.4.2
      26. Market Estimates & Forecast By Region/Country, 2020-2027
      27. \r\n
      28. \r\n7.1.1.5
      29. Transmission Fluids
      30. \r\n
      31. \r\n7.1.1.5.1 Market Estimates &
      32. Forecast, 2020-2027
      33. \r\n
      34. \r\n7.1.1.5.2 Market Estimates &
      35. Forecast By Region/Country, 2020-2027
      36. \r\n
      37. \r\n7.1.1.6 Break Oil
      38. \r\n
      39. \r\n7.1.1.6.1
      40. Market Estimates & Forecast, 2020-2027
      41. \r\n
      42. \r\n7.1.1.6.2
      43. Market Estimates & Forecast By Region/Country, 2020-2027
      44. \r\n
      45. \r\n7.1.1.7
      46. Coolants
      47. \r\n
      48. \r\n7.1.1.7.1 Market Estimates & Forecast, 2020-2027
      49. \r\n
      50. \r\n7.1.1.7.2
      51. Market Estimates & Forecast By Region/Country, 2020-2027
      52. \r\n
      53. \r\n7.1.1.8
      54. Greases
      55. \r\n
      56. \r\n7.1.1.8.1 Market Estimates & Forecast, 2020-2027
      57. \r\n
      58. \r\n7.1.1.8.2
      59. Market Estimates & Forecast By Region/Country, 2020-2027
      60. \r\n
      61. \r\n7.1.2
      62. Industrial
      63. \r\n
      64. \r\n7.1.2.1 Market Estimates & Forecast, 2020-2027
      65. \r\n
      66. \r\n7.1.2.2
      67. Market Estimates & Forecast By Region/Country, 2020-2027
      68. \r\n
      69. \r\n7.1.2.3
      70. Process Oil
      71. \r\n
      72. \r\n7.1.2.3.1 Market Estimates & Forecast,
      73. \r\n
      74. \r\n7.1.2.3.2 Market Estimates & Forecast By
      75. Region/Country, 2020-2027
      76. \r\n
      77. \r\n7.1.2.4 General Industrial
      78. Oil
      79. \r\n
      80. \r\n7.1.2.4.1 Market Estimates & Forecast, 2020-2027
      81. \r\n
      82. \r\n7.1.2.4.2
      83. Market Estimates & Forecast By Region/Country, 2020-2027
      84. \r\n
      85. \r\n7.1.2.5
      86. Metal Working Fluids
      87. \r\n
      88. \r\n7.1.2.5.1 Market Estimates &
      89. Forecast, 2020-2027
      90. \r\n
      91. \r\n7.1.2.5.2 Market Estimates &
      92. Forecast By Region/Country, 2020-2027
      93. \r\n
      94. \r\n7.1.2.6 Industrial
      95. Engine Oil
      96. \r\n
      97. \r\n7.1.2.6.1 Market Estimates & Forecast,
      98. \r\n
      99. \r\n7.1.2.6.2 Market Estimates & Forecast By
      100. Region/Country, 2020-2027
      101. \r\n
      102. \r\n7.1.2.7 Compressor Oil
      103. \r\n
      104. \r\n7.1.2.7.1
      105. Market Estimates & Forecast, 2020-2027
      106. \r\n
      107. \r\n7.1.2.7.2
      108. Market Estimates & Forecast By Region/Country, 2020-2027
      109. \r\n
      110. \r\n7.1.2.8
      111. Greases
      112. \r\n
      113. \r\n7.1.2.8.1 Market Estimates & Forecast, 2020-2027
      114. \r\n
      115. \r\n7.1.2.8.2
      116. Market Estimates & Forecast By Region/Country, 2020-2027
      117. \r\n
      118. \r\n7.1.2.9
      119. Hydraulic Oil
      120. \r\n
      121. \r\n7.1.2.9.1 Market Estimates & Forecast,
      122. \r\n
      123. \r\n7.1.2.9.2 Market Estimates & Forecast By
      124. Region/Country, 2020-2027
      125. \r\n
      126. \r\n7.1.2.10 Turbine Oil
      127. \r\n
      128. \r\n7.1.2.10.1
      129. Market Estimates & Forecast, 2020-2027
      130. \r\n
      131. \r\n7.1.2.10.2
      132. Market Estimates & Forecast By Region/Country, 2020-2027
      133. \r\n
      134. \r\n7.1.2.11
      135. Others
      136. \r\n
      137. \r\n7.1.2.11.1 Market Estimates & Forecast, 2020-2027
      138. \r\n
      139. \r\n7.1.2.11.2
      140. Market Estimates & Forecast By Region/Country, 2020-2027
      141. \r\n
      142. \r\n7.1.3
      143. Marine
      144. \r\n
      145. \r\n7.1.3.1 Market Estimates & Forecast, 2020-2027
      146. \r\n
      147. \r\n7.1.3.2
      148. Market Estimates & Forecast By Region/Country, 2020-2027
      149. \r\n
      150. \r\n7.1.3.3
      151. Engine Oil
      152. \r\n
      153. \r\n7.1.3.3.1 Market Estimates & Forecast,
      154. \r\n
      155. \r\n7.1.3.3.2 Market Estimates & Forecast By
      156. Region/Country, 2020-2027
      157. \r\n
      158. \r\n7.1.3.4 Hydraulic Oil
      159. \r\n
      160. \r\n7.1.3.4.1
      161. Market Estimates & Forecast, 2020-2027
      162. \r\n
      163. \r\n7.1.3.4.2
      164. Market Estimates & Forecast By Region/Country, 2020-2027
      165. \r\n
      166. \r\n7.1.3.5
      167. Gear Oil
      168. \r\n
      169. \r\n7.1.3.5.1 Market Estimates & Forecast, 2020-2027
      170. \r\n
      171. \r\n7.1.3.5.2
      172. Market Estimates & Forecast By Region/Country, 2020-2027
      173. \r\n
      174. \r\n7.1.3.6
      175. Turbine Oil
      176. \r\n
      177. \r\n7.1.3.6.1 Market Estimates & Forecast,
      178. \r\n
      179. \r\n7.1.3.6.2 Market Estimates & Forecast By
      180. Region/Country, 2020-2027
      181. \r\n
      182. \r\n7.1.3.7 Greases
      183. \r\n
      184. \r\n7.1.3.7.1
      185. Market Estimates & Forecast, 2020-2027
      186. \r\n
      187. \r\n7.1.3.7.2
      188. Market Estimates & Forecast By Region/Country, 2020-2027
      189. \r\n
      190. \r\n7.1.3.8
      191. Others
      192. \r\n
      193. \r\n7.1.3.8.1 Market Estimates & Forecast, 2020-2027
      194. \r\n
      195. \r\n7.1.3.8.2
      196. Market Estimates & Forecast By Region/Country, 2020-2027
      197. \r\n
      198. \r\n8
    4. ASEAN, Africa, India, & G.C.C. Lubricants Market, By End Use
      1. \r\n
      2. \r\n8.1
      3. Overview
      4. \r\n
      5. \r\n8.1.1 Metal Production
      6. \r\n
      7. \r\n8.1.1.1
      8. Market Estimates & Forecast, 2020-2027
      9. \r\n
      10. \r\n8.1.1.2 Market
      11. Estimates & Forecast By Region/Country, 2020-2027
      12. \r\n
      13. \r\n8.1.2
      14. Textile
      15. \r\n
      16. \r\n8.1.2.1 Market Estimates & Forecast, 2020-2027
      17. \r\n
      18. \r\n8.1.2.2
      19. Market Estimates & Forecast By Region/Country, 2020-2027
      20. \r\n
      21. \r\n8.1.2.3
      22. Textile Composites
      23. \r\n
      24. \r\n8.1.2.3.1 Market Estimates & Forecast,
      25. \r\n
      26. \r\n8.1.2.3.2 Market Estimates & Forecast By
      27. Region/Country, 2020-2027
      28. \r\n
      29. \r\n8.1.2.4 Textile Finishing
      30. \r\n
      31. \r\n8.1.2.4.1
      32. Market Estimates & Forecast, 2020-2027
      33. \r\n
      34. \r\n8.1.2.4.2
      35. Market Estimates & Forecast By Region/Country, 2020-2027
      36. \r\n
      37. \r\n8.1.2.5
      38. Textile Weaving
      39. \r\n
      40. \r\n8.1.2.5.1 Market Estimates & Forecast,
      41. \r\n
      42. \r\n8.1.2.5.2 Market Estimates & Forecast By
      43. Region/Country, 2020-2027
      44. \r\n
      45. \r\n8.1.2.6 Other Textile Applications
      46. \r\n
      47. \r\n8.1.2.6.1
      48. Market Estimates & Forecast, 2020-2027
      49. \r\n
      50. \r\n8.1.2.6.2
      51. Market Estimates & Forecast By Region/Country, 2020-2027
      52. \r\n
      53. \r\n8.1.3
      54. Energy
      55. \r\n
      56. \r\n8.1.3.1 Market Estimates & Forecast, 2020-2027
      57. \r\n
      58. \r\n8.1.3.2
      59. Market Estimates & Forecast By Region/Country, 2020-2027
      60. \r\n
      61. \r\n8.1.3.3
      62. LNG (Liquid Natural Gas)
      63. \r\n
      64. \r\n8.1.3.3.1 Market Estimates &
      65. Forecast, 2020-2027
      66. \r\n
      67. \r\n8.1.3.3.2 Market Estimates &
      68. Forecast By Region/Country, 2020-2027
      69. \r\n
      70. \r\n8.1.3.4 Piplines
      71. \r\n
      72. \r\n8.1.3.4.1
      73. Market Estimates & Forecast, 2020-2027
      74. \r\n
      75. \r\n8.1.3.4.2
      76. Market Estimates & Forecast By Region/Country, 2020-2027
      77. \r\n
      78. \r\n8.1.3.5
      79. Ocean Energy
      80. \r\n
      81. \r\n8.1.3.5.1 Market Estimates & Forecast,
      82. \r\n
      83. \r\n8.1.3.5.2 Market Estimates & Forecast By
      84. Region/Country, 2020-2027
      85. \r\n
      86. \r\n8.1.3.6 Other Energy Applications
      87. \r\n
      88. \r\n8.1.3.6.1
      89. Market Estimates & Forecast, 2020-2027
      90. \r\n
      91. \r\n8.1.3.6.2
      92. Market Estimates & Forecast By Region/Country, 2020-2027
      93. \r\n
      94. \r\n8.1.4
      95. Chemical Manufacturing
      96. \r\n
      97. \r\n8.1.4.1 Market Estimates &
      98. Forecast, 2020-2027
      99. \r\n
      100. \r\n8.1.4.2 Market Estimates & Forecast
      101. By Region/Country, 2020-2027
      102. \r\n
      103. \r\n8.1.4.3 Industrial Gas
      104. \r\n
      105. \r\n8.1.4.3.1
      106. Market Estimates & Forecast, 2020-2027
      107. \r\n
      108. \r\n8.1.4.3.2
      109. Market Estimates & Forecast By Region/Country, 2020-2027
      110. \r\n
      111. \r\n8.1.4.4
      112. Fertilizers
      113. \r\n
      114. \r\n8.1.4.4.1 Market Estimates & Forecast,
      115. \r\n
      116. \r\n8.1.4.4.2 Market Estimates & Forecast By
      117. Region/Country, 2020-2027
      118. \r\n
      119. \r\n8.1.4.5 Polymer
      120. \r\n
      121. \r\n8.1.4.5.1
      122. Market Estimates & Forecast, 2020-2027
      123. \r\n
      124. \r\n8.1.4.5.2
      125. Market Estimates & Forecast By Region/Country, 2020-2027
      126. \r\n
      127. \r\n8.1.4.6
      128. Other Chemical Manufacturing
      129. \r\n
      130. \r\n8.1.4.6.1 Market Estimates
      131. & Forecast, 2020-2027
      132. \r\n
      133. \r\n8.1.4.6.2 Market Estimates
      134. & Forecast By Region/Country, 2020-2027
      135. \r\n
      136. \r\n8.1.5 Food
      137. Processing
      138. \r\n
      139. \r\n8.1.5.1 Market Estimates & Forecast, 2020-2027
      140. \r\n
      141. \r\n8.1.5.2
      142. Market Estimates & Forecast By Region/Country, 2020-2027
      143. \r\n
      144. \r\n8.1.5.3
      145. Frozen Food
      146. \r\n
      147. \r\n8.1.5.5.1 Market Estimates & Forecast,
      148. \r\n
      149. \r\n8.1.5.5.2 Market Estimates & Forecast By
      150. Region/Country, 2020-2027
      151. \r\n
      152. \r\n8.1.5.4 Beverages
      153. \r\n
      154. \r\n8.1.5.4.1
      155. Market Estimates & Forecast, 2020-2027
      156. \r\n
      157. \r\n8.1.5.4.2
      158. Market Estimates & Forecast By Region/Country, 2020-2027
      159. \r\n
      160. \r\n8.1.5.5
      161. Processed Food
      162. \r\n
      163. \r\n8.1.5.5.1 Market Estimates & Forecast,
      164. \r\n
      165. \r\n8.1.5.5.2 Market Estimates & Forecast By
      166. Region/Country, 2020-2027
      167. \r\n
      168. \r\n8.1.5.6 Other Food Applications
      169. \r\n
      170. \r\n8.1.5.6.1
      171. Market Estimates & Forecast, 2020-2027
      172. \r\n
      173. \r\n8.1.5.6.2
      174. Market Estimates & Forecast By Region/Country, 2020-2027
      175. \r\n
      176. \r\n8.1.6
      177. Construction & Mining
      178. \r\n
      179. \r\n8.1.6.1 Market Estimates &
      180. Forecast, 2020-2027
      181. \r\n
      182. \r\n8.1.6.2 Market Estimates & Forecast
      183. By Region/Country, 2020-2027
      184. \r\n
      185. \r\n8.1.7 Cement Production
      186. \r\n
      187. \r\n8.1.7.1
      188. Market Estimates & Forecast, 2020-2027
      189. \r\n
      190. \r\n8.1.7.2 Market
      191. Estimates & Forecast By Region/Country, 2020-2027
      192. \r\n
      193. \r\n8.1.8
      194. General Industrial Manufacturing
      195. \r\n
      196. \r\n8.1.8.1 Market Estimates
      197. & Forecast, 2020-2027
      198. \r\n
      199. \r\n8.1.8.2 Market Estimates &
      200. Forecast By Region/Country, 2020-2027
      201. \r\n
      202. \r\n9 ASEAN, Africa,
    5. India, & G.C.C. Lubricants Market, By Region
      1. \r\n
      2. \r\n9.1
      3. Overview
      4. \r\n
      5. \r\n9.2 India
      6. \r\n
      7. \r\n9.2.1 Market
      8. Estimates & Forecast By Base Oil, 2020-2027
      9. \r\n
      10. \r\n9.2.2
      11. Market Estimates & Forecast By Application, 2020-2027
      12. \r\n
      13. \r\n9.2.3
      14. Market Estimates & Forecast By End Use, 2020-2027
      15. \r\n
      16. \r\n9.3
      17. ASEAN
      18. \r\n
    6. \r\n9.3.1 Market Estimates & Forecast, By Country,
      1. \r\n
      2. \r\n9.3.2 Market Estimates & Forecast By Base
      3. Oil, 2020-2027
      4. \r\n
      5. \r\n9.3.3 Market Estimates & Forecast
      6. By Application, 2020-2027
      7. \r\n
      8. \r\n9.3.4 Market Estimates &
      9. Forecast By End Use, 2020-2027
      10. \r\n
      11. \r\n9.3.4.1 Malaysia
      12. \r\n
      13. \r\n9.3.4.1.1
      14. Market Estimates & Forecast By Base Oil, 2020-2027
      15. \r\n
      16. \r\n9.3.4.1.2
      17. Market Estimates & Forecast By Application, 2020-2027
      18. \r\n
      19. \r\n9.3.4.1.3
      20. Market Estimates & Forecast By End Use, 2020-2027
      21. \r\n
      22. \r\n9.3.4.2
      23. Thailand
      24. \r\n
      25. \r\n9.3.4.2.1 Market Estimates & Forecast By
      26. Base Oil, 2020-2027
      27. \r\n
      28. \r\n9.3.4.2.2 Market Estimates &
      29. Forecast By Application, 2020-2027
      30. \r\n
      31. \r\n9.3.4.2.3 Market Estimates
      32. & Forecast By End Use, 2020-2027
      33. \r\n
      34. \r\n9.3.4.3 Singapore
      35. \r\n
      36. \r\n9.3.4.3.1
      37. Market Estimates & Forecast By Base Oil, 2020-2027
      38. \r\n
      39. \r\n9.3.4.3.2
      40. Market Estimates & Forecast By Application, 2020-2027
      41. \r\n
      42. \r\n9.3.4.3.3
      43. Market Estimates & Forecast By End Use, 2020-2027
      44. \r\n
      45. \r\n9.3.4.4
      46. Indonesia
      47. \r\n
      48. \r\n9.3.4.4.1 Market Estimates & Forecast By
      49. Base Oil, 2020-2027
      50. \r\n
      51. \r\n9.3.4.4.2 Market Estimates &
      52. Forecast By Application, 2020-2027
      53. \r\n
      54. \r\n9.3.4.4.3 Market Estimates
      55. & Forecast By End Use, 2020-2027
      56. \r\n
      57. \r\n9.3.4.5 Vietnam
      58. \r\n
      59. \r\n9.3.4.5.1
      60. Market Estimates & Forecast By Base Oil, 2020-2027
      61. \r\n
      62. \r\n9.3.4.5.2
      63. Market Estimates & Forecast By Application, 2020-2027
      64. \r\n
      65. \r\n9.3.4.5.3
      66. Market Estimates & Forecast By End Use, 2020-2027
      67. \r\n
      68. \r\n9.3.4.6
      69. Rest Of ASEAN
      70. \r\n
      71. \r\n9.3.4.6.1 Market Estimates & Forecast
      72. By Base Oil, 2020-2027
      73. \r\n
      74. \r\n9.3.4.6.2 Market Estimates &
      75. Forecast By Application, 2020-2027
      76. \r\n
      77. \r\n9.3.4.6.3 Market Estimates
      78. & Forecast By End Use, 2020-2027
      79. \r\n
      80. \r\n9.4 Africa
      81. \r\n
      82. \r\n9.4.1
    7. Market Estimates & Forecast, By Country, 2020-2027
      1. \r\n
      2. \r\n9.4.2
      3. Market Estimates & Forecast By Base Oil, 2020-2027
      4. \r\n
      5. \r\n9.4.3
      6. Market Estimates & Forecast By Application, 2020-2027
      7. \r\n
      8. \r\n9.4.4
      9. Market Estimates & Forecast By End Use, 2020-2027
      10. \r\n
      11. \r\n9.4.4.1
      12. South Africa
      13. \r\n
      14. \r\n9.4.4.1.1 Market Estimates & Forecast
      15. By Base Oil, 2020-2027
      16. \r\n
      17. \r\n9.4.4.1.2 Market Estimates &
      18. Forecast By Application, 2020-2027
      19. \r\n
      20. \r\n9.4.4.1.3 Market Estimates
      21. & Forecast By End Use, 2020-2027
      22. \r\n
      23. \r\n9.4.4.2 Rest Of
      24. North Africa
      25. \r\n
      26. \r\n9.4.4.2.1 Market Estimates & Forecast
      27. By Base Oil, 2020-2027
      28. \r\n
      29. \r\n9.4.4.2.2 Market Estimates &
      30. Forecast By Application, 2020-2027
      31. \r\n
      32. \r\n9.4.4.2.3 Market Estimates
      33. & Forecast By End Use, 2020-2027
      34. \r\n
      35. \r\n9.4.4.3 Nigeria
      36. \r\n
      37. \r\n9.4.4.3.1
      38. Market Estimates & Forecast By Base Oil, 2020-2027
      39. \r\n
      40. \r\n9.4.4.3.2
      41. Market Estimates & Forecast By Application, 2020-2027
      42. \r\n
      43. \r\n9.4.4.3.3
      44. Market Estimates & Forecast By End Use, 2020-2027
      45. \r\n
      46. \r\n9.4.4.4
      47. Tanzania
      48. \r\n
      49. \r\n9.4.4.4.1 Market Estimates & Forecast By
      50. Base Oil, 2020-2027
      51. \r\n
      52. \r\n9.4.4.4.2 Market Estimates &
      53. Forecast By Application, 2020-2027
      54. \r\n
      55. \r\n9.4.4.4.3 Market Estimates
      56. & Forecast By End Use, 2020-2027
      57. \r\n
      58. \r\n9.4.4.5 Kenya
      59. \r\n
      60. \r\n9.4.4.5.1
      61. Market Estimates & Forecast By Base Oil, 2020-2027
      62. \r\n
      63. \r\n9.4.4.5.2
      64. Market Estimates & Forecast By Application, 2020-2027
      65. \r\n
      66. \r\n9.4.4.5.3
      67. Market Estimates & Forecast By End Use, 2020-2027
      68. \r\n
      69. \r\n9.4.4.6
      70. Egypt
      71. \r\n
      72. \r\n9.5.4.6.1 Market Estimates & Forecast By Base
      73. Oil, 2020-2027
      74. \r\n
      75. \r\n9.5.4.6.2 Market Estimates & Forecast
      76. By Application, 2020-2027
      77. \r\n
      78. \r\n9.5.4.6.3 Market Estimates
      79. & Forecast By End Use, 2020-2027
      80. \r\n
      81. \r\n9.4.4.7 Ghana
      82. \r\n
      83. \r\n9.5.4.7.1
      84. Market Estimates & Forecast By Base Oil, 2020-2027
      85. \r\n
      86. \r\n9.5.4.7.2
      87. Market Estimates & Forecast By Application, 2020-2027
      88. \r\n
      89. \r\n9.5.4.7.3
      90. Market Estimates & Forecast By End Use, 2020-2027
      91. \r\n
      92. \r\n9.4.4.8
      93. Rest Of Africa
      94. \r\n
      95. \r\n9.5.4.8.1 Market Estimates & Forecast
      96. By Base Oil, 2020-2027
      97. \r\n
      98. \r\n9.5.4.8.2 Market Estimates &
      99. Forecast By Application, 2020-2027
      100. \r\n
      101. \r\n9.5.4.8.3 Market Estimates
      102. & Forecast By End Use, 2020-2027
      103. \r\n
      104. \r\n9.5 G.C.C.
      105. \r\n
      106. \r\n9.5.1
    8. Market Estimates & Forecast, By Country, 2020-2027
      1. \r\n
      2. \r\n9.5.2
      3. Market Estimates & Forecast By Base Oil, 2020-2027
      4. \r\n
      5. \r\n9.5.3
      6. Market Estimates & Forecast By Application, 2020-2027
      7. \r\n
      8. \r\n9.5.4
      9. Market Estimates & Forecast By End Use, 2020-2027
      10. \r\n
      11. \r\n9.5.4.1
      12. Saudi Arabia
      13. \r\n
      14. \r\n9.5.4.1.1 Market Estimates & Forecast
      15. By Base Oil, 2020-2027
      16. \r\n
      17. \r\n9.5.4.1.2 Market Estimates &
      18. Forecast By Application, 2020-2027
      19. \r\n
      20. \r\n9.5.4.1.3 Market Estimates
      21. & Forecast By End Use, 2020-2027
      22. \r\n
      23. \r\n9.5.4.2 UAE
      24. \r\n
      25. \r\n9.5.4.2.1
      26. Market Estimates & Forecast By Base Oil, 2020-2027
      27. \r\n
      28. \r\n9.5.4.2.2
      29. Market Estimates & Forecast By Application, 2020-2027
      30. \r\n
      31. \r\n9.5.4.2.3
      32. Market Estimates & Forecast By End Use, 2020-2027
      33. \r\n
      34. \r\n9.5.4.3
      35. Qatar
      36. \r\n
      37. \r\n9.5.4.3.1 Market Estimates & Forecast By Base
      38. Oil, 2020-2027
      39. \r\n
      40. \r\n9.5.4.3.2 Market Estimates & Forecast
      41. By Application, 2020-2027
      42. \r\n
      43. \r\n9.5.4.3.3 Market Estimates
      44. & Forecast By End Use, 2020-2027
      45. \r\n
      46. \r\n9.5.4.4 Oman
      47. \r\n
      48. \r\n9.5.4.4.1
      49. Market Estimates & Forecast By Base Oil, 2020-2027
      50. \r\n
      51. \r\n9.5.4.4.2
      52. Market Estimates & Forecast By Application, 2020-2027
      53. \r\n
      54. \r\n9.5.4.4.3
      55. Market Estimates & Forecast By End Use, 2020-2027
      56. \r\n
      57. \r\n9.5.4.5
      58. Kuwait
      59. \r\n
      60. \r\n9.5.4.5.1 Market Estimates & Forecast By Base
      61. Oil, 2020-2027
      62. \r\n
      63. \r\n9.5.4.5.2 Market Estimates & Forecast
      64. By Application, 2020-2027
      65. \r\n
      66. \r\n9.5.4.5.3 Market Estimates
      67. & Forecast By End Use, 2020-2027
      68. \r\n
      69. \r\n9.5.4.6 Bahrain
      70. \r\n
      71. \r\n9.5.4.6.1
      72. Market Estimates & Forecast By Base Oil, 2020-2027
      73. \r\n
      74. \r\n9.5.4.6.2
      75. Market Estimates & Forecast By Application, 2020-2027
      76. \r\n
      77. \r\n9.5.4.6.3
      78. Market Estimates & Forecast By End Use, 2020-2027
      79. \r\n
      80. \r\n10
      81. Competitive Landscape
      82. \r\n
      83. \r\n10.1 Introduction
      84. \r\n
      85. \r\n10.2
      86. Competitive Analysis
      87. \r\n
      88. \r\n10.2.1 Introduction
      89. \r\n
      90. \r\n10.2.2
      91. Market Share Analysis
      92. \r\n
      93. \r\n10.2.3 Key Development Strategies
      94. \r\n
      95. \r\n11
      96. Company Profiles
      97. \r\n
      98. \r\n11.1 PetroChina Company Ltd.
      99. \r\n
      100. \r\n11.1.1
      101. Company Overview
      102. \r\n
      103. \r\n11.1.2 Financial Overview
      104. \r\n
      105. \r\n11.1.3
      106. Products Offering
      107. \r\n
      108. \r\n11.1.4 Key Developments
      109. \r\n
      110. \r\n11.1.5
      111. SWOT Analysis
      112. \r\n
      113. \r\n11.1.6 Key Strategy
      114. \r\n
      115. \r\n11.2
      116. Sinopec Corporation
      117. \r\n
      118. \r\n11.2.1 Company Overview
      119. \r\n
      120. \r\n11.2.2
      121. Financial Overview
      122. \r\n
      123. \r\n11.2.3 Products Offering
      124. \r\n
      125. \r\n11.2.4
      126. Key Developments
      127. \r\n
      128. \r\n11.2.5 SWOT Analysis
      129. \r\n
      130. \r\n11.2.6
      131. Key Strategy
      132. \r\n
      133. \r\n11.3 Fuchs Petrolub SE
      134. \r\n
      135. \r\n11.3.1
      136. Company Overview
      137. \r\n
      138. \r\n11.3.2 Financial Overview
      139. \r\n
      140. \r\n11.3.3
      141. Products Offering
      142. \r\n
      143. \r\n11.3.4 Key Developments
      144. \r\n
      145. \r\n11.3.5
      146. SWOT Analysis
      147. \r\n
      148. \r\n11.3.6 Key Strategy
      149. \r\n
      150. \r\n11.4
      151. Phillips 66 Company
      152. \r\n
      153. \r\n11.4.1 Company Overview
      154. \r\n
      155. \r\n11.4.2
      156. Financial Overview
      157. \r\n
      158. \r\n11.4.3 Products Offering
      159. \r\n
      160. \r\n11.4.4
      161. Key Developments
      162. \r\n
      163. \r\n11.4.5 SWOT Analysis
      164. \r\n
      165. \r\n11.4.6
      166. Key Strategy
      167. \r\n
      168. \r\n11.5 Lucas Oil Products, Inc..
      169. \r\n
      170. \r\n11.5.1
      171. Company Overview
      172. \r\n
      173. \r\n11.5.2 Financial Overview
      174. \r\n
      175. \r\n11.5.3
      176. Products Offering
      177. \r\n
      178. \r\n11.5.4 Key Developments
      179. \r\n
      180. \r\n11.5.5
      181. SWOT Analysis
      182. \r\n
      183. \r\n11.5.6 Key Strategy
      184. \r\n
      185. \r\n11.6
      186. AMSOIL INC.
      187. \r\n
      188. \r\n11.6.1 Company Overview
      189. \r\n
      190. \r\n11.6.2
      191. Financial Overview
      192. \r\n
      193. \r\n11.6.3 Products Offering
      194. \r\n
      195. \r\n11.6.4
      196. Key Developments
      197. \r\n
      198. \r\n11.6.5 SWOT Analysis
      199. \r\n
      200. \r\n11.6.6
      201. Key Strategy
      202. \r\n
      203. \r\n11.7 Valvoline, Inc.
      204. \r\n
      205. \r\n11.7.1
      206. Company Overview
      207. \r\n
      208. \r\n11.7.2 Financial Overview
      209. \r\n
      210. \r\n11.7.3
      211. Products Offering
      212. \r\n
      213. \r\n11.7.4 Key Developments
      214. \r\n
      215. \r\n11.7.5
      216. SWOT Analysis
      217. \r\n
      218. \r\n11.7.6 Key Strategy
      219. \r\n
      220. \r\n11.8
      221. Clariant
      222. \r\n
      223. \r\n11.8.1 Company Overview
      224. \r\n
      225. \r\n11.8.2
      226. Financial Overview
      227. \r\n
      228. \r\n11.8.3 Products Offering
      229. \r\n
      230. \r\n11.8.4
      231. Key Developments
      232. \r\n
      233. \r\n11.8.5 SWOT Analysis
      234. \r\n
      235. \r\n11.8.6
      236. Key Strategy
      237. \r\n
      238. \r\n11.9 Quaker Chemical Corporation
      239. \r\n
      240. \r\n11.9.1
      241. Company Overview
      242. \r\n
      243. \r\n11.9.2 Financial Overview
      244. \r\n
      245. \r\n11.9.3
      246. Products Offering
      247. \r\n
      248. \r\n11.9.4 Key Developments
      249. \r\n
      250. \r\n11.9.5
      251. SWOT Analysis
      252. \r\n
      253. \r\n11.9.6 Key Strategy
      254. \r\n
      255. \r\n11.10
      256. Calumet Specialty Products Partners, L.P
      257. \r\n
      258. \r\n11.10.1 Company
      259. Overview
      260. \r\n
      261. \r\n11.10.2 Financial Overview
      262. \r\n
      263. \r\n11.10.3
      264. Products Offering
      265. \r\n
      266. \r\n11.10.4 Key Developments
      267. \r\n
      268. \r\n11.10.5
      269. SWOT Analysis
      270. \r\n
      271. \r\n11.10.6 Key Strategy
      272. \r\n
      273. \r\n11.11
      274. Chevron Corporation
      275. \r\n
      276. \r\n11.11.1 Company Overview
      277. \r\n
      278. \r\n11.11.2
      279. Financial Overview
      280. \r\n
      281. \r\n11.11.3 Products Offering
      282. \r\n
      283. \r\n11.11.4
      284. Key Developments
      285. \r\n
      286. \r\n11.11.5 SWOT Analysis
      287. \r\n
      288. \r\n11.11.6
      289. Key Strategy
      290. \r\n
      291. \r\n11.12 BP Plc
      292. \r\n
      293. \r\n11.12.1
      294. Company Overview
      295. \r\n
      296. \r\n11.12.2 Financial Overview
      297. \r\n
      298. \r\n11.12.3
      299. Products Offering
      300. \r\n
      301. \r\n11.12.4 Key Developments
      302. \r\n
      303. \r\n11.12.5
      304. SWOT Analysis
      305. \r\n
      306. \r\n11.12.6 Key Strategy
      307. \r\n
      308. \r\n11.13
      309. Exxon Mobil Corporation.
      310. \r\n
      311. \r\n11.13.1 Company Overview
      312. \r\n
      313. \r\n11.13.2
      314. Financial Overview
      315. \r\n
      316. \r\n11.13.3 Products Offering
      317. \r\n
      318. \r\n11.13.4
      319. Key Developments
      320. \r\n
      321. \r\n11.13.5 SWOT Analysis
      322. \r\n
      323. \r\n11.13.6
      324. Key Strategy
      325. \r\n
      326. \r\n11.14 Royal Dutch Shell Plc
      327. \r\n
      328. \r\n11.14.1
      329. Company Overview
      330. \r\n
      331. \r\n11.14.2 Financial Overview
      332. \r\n
      333. \r\n11.14.3
      334. Products Offering
      335. \r\n
      336. \r\n11.14.4 Key Developments
      337. \r\n
      338. \r\n11.14.5
      339. SWOT Analysis
      340. \r\n
      341. \r\n11.14.6 Key Strategy
      342. \r\n
      343. \r\n11.15
      344. Total S.A.
      345. \r\n
      346. \r\n11.15.1 Company Overview
      347. \r\n
      348. \r\n11.15.2
      349. Financial Overview
      350. \r\n
      351. \r\n11.15.3 Products Offering
      352. \r\n
      353. \r\n11.15.4
      354. Key Developments
      355. \r\n
      356. \r\n11.15.5 SWOT Analysis
      357. \r\n
      358. \r\n11.15.6
      359. Key Strategy
      360. \r\n
      361. \r\n11.16 Lukoil
      362. \r\n
      363. \r\n11.16.1
      364. Company Overview
      365. \r\n
      366. \r\n11.16.2 Financial Overview
      367. \r\n
      368. \r\n11.16.3
      369. Products Offering
      370. \r\n
      371. \r\n11.16.4 Key Developments
      372. \r\n
      373. \r\n11.16.5
      374. SWOT Analysis
      375. \r\n
      376. \r\n11.16.6 Key Strategy
      377. \r\n
      378. \r\n11.17
      379. Petronas
      380. \r\n
      381. \r\n11.17.1 Company Overview
      382. \r\n
      383. \r\n11.17.2
      384. Financial Overview
      385. \r\n
      386. \r\n11.17.3 Products Offering
      387. \r\n
      388. \r\n11.17.4
      389. Key Developments
      390. \r\n
      391. \r\n11.17.5 SWOT Analysis
      392. \r\n
      393. \r\n11.17.6
      394. Key Strategy
      395. \r\n
      396. \r\n11.18 Yushiro Chemical Industry
      397. \r\n
      398. \r\n11.18.1
      399. Company Overview
      400. \r\n
      401. \r\n11.18.2 Financial Overview
      402. \r\n
      403. \r\n11.18.3
      404. Products Offering
      405. \r\n
      406. \r\n11.18.4 Key Developments
      407. \r\n
      408. \r\n11.18.5
      409. SWOT Analysis
      410. \r\n
      411. \r\n11.18.6 Key Strategy
      412. \r\n
      413. \r\n11.19
      414. Morris Lubricants
      415. \r\n
      416. \r\n11.19.1 Company Overview
      417. \r\n
      418. \r\n11.19.2
      419. Financial Overview
      420. \r\n
      421. \r\n11.19.3 Products Offering
      422. \r\n
      423. \r\n11.19.4
      424. Key Developments
      425. \r\n
      426. \r\n11.19.5 SWOT Analysis
      427. \r\n
      428. \r\n11.19.6
      429. Key Strategy
      430. \r\n
      431. \r\n11.20 Rock Valley Oil And Chemical Co.
      432. \r\n
      433. \r\n11.20.1
      434. Company Overview
      435. \r\n
      436. \r\n11.20.2 Financial Overview
      437. \r\n
      438. \r\n11.20.3
      439. Products Offering
      440. \r\n
      441. \r\n11.20.4 Key Developments
      442. \r\n
      443. \r\n11.20.5
      444. SWOT Analysis
      445. \r\n
      446. \r\n11.20.6 Key Strategy
      447. \r\n
      448. \r\n11.21
      449. Indian Oil Corporation Limited
      450. \r\n
      451. \r\n11.21.1 Company Overview
      452. \r\n
      453. \r\n11.21.2
      454. Financial Overview
      455. \r\n
      456. \r\n11.21.3 Products Offering
      457. \r\n
      458. \r\n11.21.4
      459. Key Developments
      460. \r\n
      461. \r\n11.21.5 SWOT Analysis
      462. \r\n
      463. \r\n11.21.6
      464. Key Strategy
      465. \r\n
      466. \r\n11.22 Gulf Oil India
      467. \r\n
      468. \r\n11.22.1
      469. Company Overview
      470. \r\n
      471. \r\n11.22.2 Financial Overview
      472. \r\n
      473. \r\n11.22.3
      474. Products Offering
      475. \r\n
      476. \r\n11.22.4 Key Developments
      477. \r\n
      478. \r\n11.22.5
      479. SWOT Analysis
      480. \r\n
      481. \r\n11.22.6 Key Strategy
      482. \r\n
      483. \r\n12
      484. Appendix
      485. \r\n
      486. \r\n13 List Of Tables
      487. \r\n
      488. \r\n14
      489. List Of Figures
      490. \r\n

    ASEAN, GCC, India, Africa lubricants Market Segmentation

    Market Segmentation Overview

    • Detailed segmentation data will be available in the full report
    • Comprehensive analysis by multiple parameters
    • Regional and country-level breakdowns
    • Market size forecasts by segment
    Infographic

    Free Sample Request

    Kindly complete the form below to receive a free sample of this Report

    Get Free Sample

    Customer Strories

    “I am very pleased with how market segments have been defined in a relevant way for my purposes (such as "Portable Freezers & refrigerators" and "last-mile"). In general the report is well structured. Thanks very much for your efforts.”

    Victoria Milne

    Founder
    Case Study
    Chemicals and Materials