• Cat-intel
  • MedIntelliX
  • Resources
  • About Us
  • Hero Background
    English
    Chinese
    French
    Japanese
    Korean
    German
    Spanish

    High-Intensity Sweeteners Market Share

    ID: MRFR/F-B & N/10122-CR
    130 Pages
    Snehal Singh
    May 2023

    High-Intensity Sweeteners Market Research Report Information by Product (sucralose, stevioside, acesulfame K, aspartame, cyclamate, glycyrrhizin, saccharin, ), Form (dry and liquid), Category (artificial and natural), Application (bakery & confectionery, beverages, dairy products, dietary products, pharmaceuticals, tabletop sweeteners, and processed foods), End User (residential and commerc...

    Share:
    Download PDF ×

    We do not share your information with anyone. However, we may send you emails based on your report interest from time to time. You may contact us at any time to opt-out.

    High-Intensity Sweeteners Market Infographic
    $ 4,950.0
    $ 5,950.0
    $ 7,250.0

    Market Share

    High-Intensity Sweeteners Market Share Analysis

    In the realm of the food and beverage industry, the High-Intensity Sweeteners market has become a focal point, prompting companies to employ diverse market share positioning strategies. One prevalent strategy is differentiation, where companies aim to distinguish their high-intensity sweeteners from competitors by emphasizing unique qualities. For example, some companies may highlight natural sources or a clean label, while others may focus on specific applications, such as baking or beverages. This differentiation strategy allows companies to establish a unique selling proposition and appeal to various consumer preferences within the competitive market for sugar alternatives. Cost leadership is another significant market share positioning strategy in the High-Intensity Sweeteners market. Companies strive to position themselves as leaders by offering these sweeteners at competitive prices without compromising on quality. This often involves efficient production processes, strategic sourcing of raw materials, and achieving economies of scale. By positioning their products as both cost-effective and high-quality sugar substitutes, companies can attract a broad consumer base and secure a substantial market share. Market segmentation is widely employed as a strategy in the High-Intensity Sweeteners market. Companies identify specific consumer segments with distinct preferences and dietary needs, tailoring their sweeteners accordingly. For instance, some products may target health-conscious consumers looking for calorie-free alternatives, while others may cater to individuals with diabetes seeking sugar substitutes with minimal impact on blood glucose levels. This segmentation allows companies to address the diverse demands of the market and position themselves as leaders in specific subcategories. Strategic collaborations and partnerships play a pivotal role in market share positioning within the High-Intensity Sweeteners industry. Companies often form alliances with food and beverage manufacturers, healthcare professionals, or even research institutions to enhance the credibility and application of their sweeteners. By aligning with reputable entities, businesses can leverage shared expertise, expand their distribution networks, and strengthen their market position. Innovation is a driving force behind market share positioning strategies in the High-Intensity Sweeteners market. Companies invest in research and development to create novel formulations, improve taste profiles, or explore new applications for their sweeteners. For instance, introducing blends of high-intensity sweeteners to mimic the taste of sugar more closely or developing stable sweeteners suitable for various cooking and baking processes can contribute to market differentiation and attract consumers seeking versatility in sugar alternatives. Effective digital marketing and brand communication are instrumental tools for companies aiming to strengthen their market share positioning in the High-Intensity Sweeteners market. Through online platforms and social media, companies can communicate the benefits of their sweeteners, provide educational content on sugar reduction, and build brand awareness. Engaging with health and wellness influencers, sharing recipes, and addressing consumer concerns contribute to positive brand perceptions and can significantly impact market share growth. Geographic expansion is a strategic consideration for companies in the High-Intensity Sweeteners market. Identifying regions with a growing demand for sugar alternatives and limited competition allows businesses to establish a strong presence and gain a competitive market share. Adapting products to regional taste preferences, complying with local regulations, and building relationships with local distributors are key elements in expanding geographic reach and catering to diverse markets.

    Market Summary

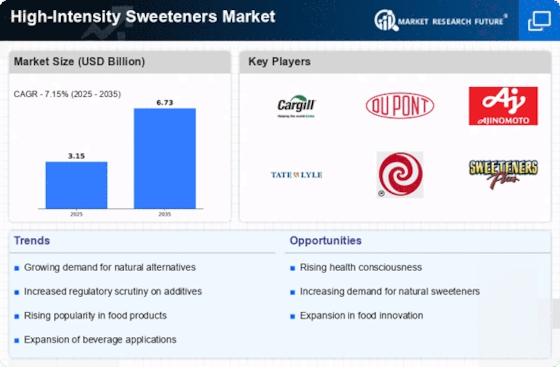
    The Global High-Intensity Sweeteners Market is projected to grow from 3.24 USD Billion in 2024 to 6.45 USD Billion by 2035, indicating robust growth potential.

    Key Market Trends & Highlights

    High-Intensity Sweeteners Key Trends and Highlights

    • The market is expected to experience a compound annual growth rate (CAGR) of 6.47% from 2025 to 2035. By 2035, the market valuation is anticipated to reach 6.45 USD Billion, reflecting increasing consumer demand for low-calorie sweeteners. In 2024, the market is valued at 3.24 USD Billion, highlighting a solid foundation for future expansion. Growing adoption of high-intensity sweeteners due to rising health consciousness among consumers is a major market driver.

    Market Size & Forecast

    2024 Market Size 3.24 (USD Billion)
    2035 Market Size 6.45 (USD Billion)
    CAGR (2025-2035) 6.47%
    Largest Regional Market Share in 2024 latin_america)

    Major Players

    <p>Tate &amp; Lyle (UK), <a href="https://www.cargill.co.in/">Cargill Incorporated (US)</a>, International Flavors &amp; Fragrances Inc. (US), ADM (Archer Daniels Midland Company) (US), Ingredion Incorporated (US), Ajinomoto Co., Inc (US), HYET Sweet (Netherlands), Hermes Sweeteners Ltd (Switzerland), JK Sucralose Inc. (China), Heartland Food Products Group (US)</p>

    Market Trends

    Large pool of people suffering from diabetes and obesity

    The large number of people suffering from diabetes as well as obesity coupled with the increased inclination towards high-intensity sweeteners owing to the various benefits provided by it such as helping individual in losing weight, reducing obesity as well as helping people suffering from diabetes to control blood sugar levels. Moreover, according to U.S. Food and Drug Administration. aspartame is a non-nutritive artificial sweetener that is 200 times sweeter than sugar. In blue packets, it is occasionally offered as Equal and NutraSweet. Aspartame has a low calorie count even if it is not zero-calorie like some other artificial sweeteners.

    As a part of this, according to Diabetes Research Institute, in 2018, 10.5% of Americans, or 34.2 million people, have diabetes. 10.2% of the population, or around 26.8 million people, were projected to have diabetes. There are about 7.3 million diabetics who have not yet received a diagnosis. In addition, there were 1.5 million new cases of diabetes identified in adults in the United States. This includes over 210,000 kids and teenagers under the age of 20.

    Besides this, the growing initiatives taken by various government bodies across different region to control obesity is likely to propel its market growth. For instance, The Alabama Cooperation System's Alabama Preventing and Reducing Obesity is helping Alabamians for Long-Term Health (AL ProHealth) is further increasing the access towards healthier foods by improving nutrition recommendations in local agencies and community sites and investigating a food hub infrastructure. They are also establishing master plans and land use interventions to connect transportation infrastructure with residences, early care and education programs, schools, workplaces, and parks or leisure facilities.

    Furthermore, the Arkansas Delta Region Obesity Program is improving state and local programs and systems, working with partners to connect sidewalks, paths, bicycle routes, and public transit with homes, early care and education, schools, workplaces, parks, and recreation centres, and working with food vendors, distributors, and producers on healthier food purchasing and sales.

    <p>The increasing consumer preference for low-calorie and sugar-free products appears to drive the demand for high-intensity sweeteners, reflecting a broader trend towards healthier dietary choices.</p>

    U.S. Food and Drug Administration (FDA)

    High-Intensity Sweeteners Market Market Drivers

    Rising Health Consciousness

    The increasing awareness of health and wellness among consumers is a primary driver of the Global High-Intensity Sweeteners Market Industry. As individuals seek to reduce sugar intake and manage weight, high-intensity sweeteners provide a viable alternative. This trend is particularly evident in regions such as North America and Europe, where consumers are gravitating towards products that offer lower calorie options without sacrificing taste. The market is projected to reach 3.24 USD Billion in 2024, reflecting the growing demand for healthier food and beverage choices. Consequently, manufacturers are innovating to incorporate these sweeteners into a variety of products, thereby expanding their market presence.

    Growing Demand for Sugar Alternatives

    The escalating demand for sugar alternatives is a significant factor propelling the Global High-Intensity Sweeteners Market Industry. As consumers become more aware of the health risks associated with excessive sugar consumption, they are actively seeking alternatives that do not compromise on taste. High-intensity sweeteners, which are often many times sweeter than sugar, allow for reduced sugar usage without sacrificing flavor. This shift is particularly pronounced in the beverage sector, where low-calorie drinks are increasingly popular. The market's growth trajectory suggests that by 2035, the industry could reach a valuation of 6.45 USD Billion, driven by this ongoing consumer trend towards healthier options.

    Innovation in Food and Beverage Products

    Innovation within the food and beverage sector is a crucial driver for the Global High-Intensity Sweeteners Market Industry. Companies are increasingly exploring new formulations and applications for high-intensity sweeteners, which allows them to cater to diverse consumer preferences. For example, the introduction of naturally derived sweeteners has gained traction, appealing to health-conscious consumers. Additionally, the rise of plant-based diets has prompted manufacturers to incorporate these sweeteners into vegan and organic products. This trend not only enhances product offerings but also aligns with the growing demand for clean-label ingredients. The anticipated compound annual growth rate of 6.47% from 2025 to 2035 further underscores the potential for innovation in this market.

    Expansion of the Food and Beverage Industry

    The continuous expansion of the global food and beverage industry is a vital driver for the Global High-Intensity Sweeteners Market Industry. As the industry grows, so does the demand for innovative ingredients that meet consumer preferences for lower-calorie and healthier options. This expansion is particularly evident in emerging markets, where rising disposable incomes and changing lifestyles are leading to increased consumption of processed foods and beverages. High-intensity sweeteners are becoming integral to product formulations, enabling manufacturers to meet regulatory standards and consumer expectations. This trend is likely to sustain market growth, with projections indicating a compound annual growth rate of 6.47% from 2025 to 2035.

    Regulatory Support for Low-Calorie Products

    Government regulations promoting the use of low-calorie sweeteners are significantly influencing the Global High-Intensity Sweeteners Market Industry. Many countries are implementing policies that encourage food manufacturers to reduce sugar levels in products, thereby fostering a favorable environment for high-intensity sweeteners. For instance, the European Union has established guidelines that support the use of these sweeteners in various food applications. This regulatory backing not only enhances consumer acceptance but also incentivizes manufacturers to innovate and reformulate products. As a result, the market is expected to grow substantially, with projections indicating a value of 6.45 USD Billion by 2035.

    Market Segment Insights

    High-Intensity Sweeteners Product of Cover Insights

    <p>The High-Intensity Sweeteners Market segmentation, based on the type, includes sucralose, stevioside, acesulfame K, aspartame, cyclamate, glycyrrhizin, saccharin, and others. The Sucralose segment held the majority share in 2021 contributing concerning the High-Intensity Sweeteners Market revenue. Sucralose is a type of non-nutritive artificial sweetener made from sugar and does not add any calories. Chemically it is obtained by the replacement of three hydroxyl groups with chlorine atoms. It has a greater sweetness compared to sugar and amounts to a level of 600 times that of conventional sugar.</p>

    <p>The sweetener is characterized by its ready solubility, greater pH stability, and pleasant taste. Owing to its great heat stability, the sweetener Is used as a popular sugar alternative in baked goods. It also finds applications in the manufacture of various food &amp; beverage products including frozen <a href="https://www.marketresearchfuture.com/reports/dairy-desserts-market-5166">dairy desserts</a>, beverages, gelatins, and <a href="https://www.marketresearchfuture.com/reports/chewing-gum-market-11819">chewing gums</a>. It is used as a taste-optimizing agent in pharmaceutical formulations including tablets, syrups, and lozenges, and helps in masking the off-notes and bitterness.</p>

    <p>Figure 2: High-Intensity Sweeteners Market, by Product, 2021 &amp; 2030 (USD Billion)</p>

    High-Intensity Sweeteners Source Insights

    <p>The High-Intensity Sweeteners Market form data has been bifurcated by dry and liquid. <a href="https://www.marketresearchfuture.com/reports/dry-sweetener-market-37976">Dry sweetener</a> comprises powder and granulated sweeteners. The dry form is the most commonly used in industries as they are easy to handle, and store compared to liquid which needs pump and liquid handling equipment for usage. This form of sweetener is known to have better and easy solubility compared to liquid sweeteners. Most of the high-intensity sweeteners are used in the dry form in bakery product preparation.</p>

    <p>For instance, stevia powder is preferred compared to liquid <a href="https://www.marketresearchfuture.com/reports/stevia-market-1747">stevia </a>in the manufacturing of bakery goods as they resemble sugar in its textural properties. Owing to its multi-benefits and increasing demand from end-use industries is expected to drive the segment’s growth in the High-Intensity Sweeteners Market. This has further broadened the growth opportunity for the high-intensity sweeteners industry.</p>

    <p>Figure 2: High-Intensity Sweeteners Market, by Form, 2021 &amp; 2030 (USD Billion)</p>

    High-Intensity Sweeteners Category Insights

    <p>Based on form, the global high-intensity sweeteners industry has been segmented into artificial and natural. Artificial sweeteners are a type of food additive that is used as a replacement for sugar in food, beverage, and pharmaceutical preparations and are generally chemically manufactured. Sucralose, acesulfame K, aspartame, cyclamate, glycyrrhizin, saccharin, alitame, Neo-DHC, <a href="https://www.marketresearchfuture.com/reports/neotame-market-24818">neotame</a>, and Advantame are the range of high-intensity artificial sweeteners. The artificial sweeteners’ metabolization in the human body system is different from conventional sugar and generally persists in the taste buds for a longer time.</p>

    <p>Saccharin, aspartame, sucralose, and acesulfame K are some of the commonly used artificial sweeteners in the food &amp; beverage industry. Though it has a huge share in the global market, the rising preference for natural ingredients is affecting the growth of the segment negatively during the forecast period.</p>

    <p>High-Intensity Sweeteners&nbsp;</p>

    <p>By Region, the study segments the market into North America, Europe, Asia-Pacific and the Rest of the World. The Asia-Pacific region has become a significant player in the High-Intensity Sweeteners Market, and the trend towards healthier consumption habits is continuing to grow. The Asia-Pacific region consists of China, India, Japan, Australia &amp; New Zealand, and the Rest of Asia-Pacific.</p>

    <p>A scientific research study on the use of artificial sweeteners in Indian traditional dairy products conducted by the National Dairy Research Institute, India has highlighted that every one out of 12 individuals in the age group 40 or more in urban areas of the country are predicted to be diagnosed with diabetics. The consumption of sweets and savory has a prominent role in the Indian food culture, with the increasing diabetic population and shift in consumer preference for low-calorie &amp; sugar-reduced sweets including <a href="https://www.marketresearchfuture.com/reports/dairy-market-11483">dairy</a>-based sweet products are witnessing significant growth in the region.</p>

    Get more detailed insights about High-Intensity Sweeteners Market Size, Share, Growth, Report, 2032

    Regional Insights

    Key Companies in the High-Intensity Sweeteners Market market include

    Industry Developments

    March 2023 Ajinomoto Co., Inc. had made an investment in SARAH Inc., a provider of gourmet community and food big data services, with the goal of co-creating food and wellness services that are closely customized to each consumer.

    November 2022 Tate & Lyle announced the expansion of its product portfolio of reduced sugar alternatives as it launched Erytesse Erythritol – which contains 70% of the sweetness of sucrose and has zero calories

    June 2022 Ingredion Inc launches a new ad campaign in EMEA to create awareness regarding the product portfolio of texturizers and sweeteners to fulfill the surging demand of consumers for improved Nutri-Score and reduced-sugar products.

    May 2022 Tate & Lyle inaugurates a Customer Innovation & Collaboration Center in Chile. The company's growth in South America is aided by this expansion.

    Future Outlook

    High-Intensity Sweeteners Market Future Outlook

    <p>The Global High-Intensity Sweeteners Market is projected to grow at a 6.47% CAGR from 2024 to 2035, driven by rising health consciousness, demand for low-calorie products, and regulatory support.</p>

    New opportunities lie in:

    • <p>Develop innovative sweetener blends targeting health-conscious consumers. Expand product lines in emerging markets with tailored marketing strategies. Leverage technology for sustainable production methods to enhance supply chain efficiency.</p>

    <p>By 2035, the market is expected to be robust, reflecting increased consumer demand and innovation.</p>

    Market Segmentation

    Regional Outlook

    • {""=>["US"
    • "Canada"
    • "Mexico"]}
    • {""=>["France"
    • "Germany"
    • "Italy"
    • "Spain & Portugal"
    • "Austria & Switzerland"
    • "UK & Ireland"
    • "Benelux"
    • "Nordics"
    • "Central & Easter Europe"
    • "Southern Europe"]}
    • {""=>["China"
    • "Japan"
    • "India"
    • "Australia & New Zealand"
    • "Rest of Asia-Pacific"]}
    • {""=>["South America"
    • "Africa"
    • "Middle East"]}

    High-Intensity Sweeteners Form Outlook

    • Dry
    • Liquid

    High-Intensity Sweeteners Category Outlook

    • Artificial
    • Natural

    High-Intensity Sweeteners End User Outlook

    • Residential
    • Commercial

    High-Intensity Sweeteners Regional Outlook

    • {""=>["US"
    • "Canada"
    • "Mexico"]}
    • {""=>["France"
    • "Germany"
    • "Italy"
    • "Spain & Portugal"
    • "Austria & Switzerland"
    • "UK & Ireland"
    • "Benelux"
    • "Nordics"
    • "Central & Easter Europe"
    • "Southern Europe"]}
    • {""=>["China"
    • "Japan"
    • "India"
    • "Australia & New Zealand"
    • "Rest of Asia-Pacific"]}
    • {""=>["South America"
    • "Africa"
    • "Middle East"]}

    High-Intensity Sweeteners Application Outlook

    • Bakery & Confectionery
    • Beverages
    • Dairy Products
    • Dietary Products
    • Pharmaceuticals
    • Tabletop Sweeteners
    • Processed Foods
    • Other

    High-Intensity Sweeteners Product of Cover Outlook

    • Sucralose
    • Stevioside
    • Acesulfame K
    • Aspartame
    • Cyclamate
    • Glycyrrhizin
    • Saccharin
    • Others

    High-Intensity Sweeteners Distribution Channel Outlook

    • Supermarkets & Hypermarkets
    • Specialty Stores
    • Online
    • Others

    Report Scope

    Report Attribute/MetricDetails
    Market Size 2022USD 2.79 billion
    Market Size 2023USD 2.94 billion
    Market Size 2030USD 4.57 billion
    Compound Annual Growth Rate (CAGR)7.15% (2022-2030)
    Base Year2022
    Forecast Period2023-2030
    Historical Data2019 & 2021
    Forecast UnitsValue (USD Billion) and Volume (Billion Sq. Meter)
    Report CoverageRevenue Forecast, Competitive Landscape, Growth Factors, and Trends
    Segments CoveredProduct, Form, Category, Application, End User, Distribution Channel, and Region
    Geographies CoveredNorth America, Europe, Asia Pacific, and Rest of the World
    Countries CoveredThe U.S, Canada, Germany, France, UK, Italy, Spain, China, Japan, India, Mexico, GCC Countries and South Africa.
    Key Companies ProfiledTate and Lyle (UK), Cargill, Incorporated (US), International Flavors & Fragrances Inc. (US), Archer Daniels Midland Company (ADM) (US), Ingredion Inc. (US), Ajinomoto Co., Inc (Japan), HYET Sweet (Netherlands), Hermes Sweeteners Ltd (Switzerland), JK Sucralose Inc. (China), and Heartland Food Products Group (US)
    Key Market OpportunitiesGrowing expansion policies adopted by key players.Wide usage of high-intensity sweeteners in various application.
    Key Market DynamicsLarge pool of people suffering from diabetes and obesity.Increased imposition of taxes by government bodies on sugar sweetened beverages.

    Market Highlights

    Author

    Snehal Singh
    Assistant Manager - Research

    She holds an experience of about 6+ years in market research and business consulting, working under the spectrum of information communication technology, telecommunications and semiconductor domains. aarti conceptualizes and implements a scalable business strategy and provides strategic leadership to the clients. her expertise lies in market estimation, competitive intelligence, pipeline analysis, customer assessment, etc.

    Leave a Comment

    Latest Comments

    John Doe
    john@example.com

    This is a great article! Really helped me understand the topic better.

    Posted on July 23, 2025, 10:15 AM
    Jane Smith
    jane@domain.com

    Thanks for sharing this. I’ve bookmarked it for later reference.

    Posted on July 22, 2025, 7:45 PM

    FAQs

    How much is the high-intensity sweeteners market worth?

    High-Intensity Sweeteners Market is pegged at USD 4.57 billion as of 2030.

    How Big is the U.S high-intensity sweeteners market?

    US high-intensity sweeteners market is poised to grow at 77.93% market share during 2021.

    What is the growth rate of the high-intensity sweeteners market?

    High-Intensity Sweeteners Market is poised to grow at 7.15% CAGR during 2022-2030.

    Which region held the largest market share in the high-intensity sweeteners market?

    Asia-Pacific region held the largest market share in the High-Intensity Sweeteners Market and market share of 50.08% in 2021.

    Who are the key players in the high-intensity sweeteners market?

    Tate and Lyle (UK), Cargill, Incorporated (US), International Flavors &amp; Fragrances Inc. (US), Archer Daniels Midland Company (ADM) (US), Ingredion Inc. (US), Ajinomoto Co., Inc (Japan), HYET Sweet (Netherlands), Hermes Sweeteners Ltd (Switzerland), JK Sucralose Inc. (China), and Heartland Food Products Group (US) are some of the vital players operating in the high-intensity sweeteners market.

    Which product led the high-intensity sweeteners market?

    Usage of Sucralose is poised to drive the high-intensity sweeteners market, which is poised to grow at market share 1.72 bn during 2022-2030

    Which form had the largest market share in the high-intensity sweeteners market?

    Dry is poised to hold an upper hand when it comes to sales of high-intensity sweeteners across diverse geographies.

    1. EXECUTIVE SUMMARY
      1. GLOBAL HIGH-INTENSITY SWEETENERS MARKET, BY PRODUCT
        1. GLOBAL HIGH-INTENSITY SWEETENERS MARKET, BY FORM
        2. GLOBAL HIGH-INTENSITY SWEETENERS MARKET, BY CATEGORY
        3. GLOBAL HIGH-INTENSITY SWEETENERS MARKET, BY APPLICATION
        4. GLOBAL HIGH-INTENSITY SWEETENERS MARKET, BY END USER
        5. GLOBAL HIGH-INTENSITY SWEETENERS MARKET, BY DISTRIBUTION CHANNEL
        6. GLOBAL HIGH-INTENSITY SWEETENERS MARKET, BY REGION
    2. MARKET INTRODUCTION
      1. DEFINITION
      2. SCOPE OF THE STUDY
      3. RESEARCH OBJECTIVE
      4. MARKET STRUCTURE
    3. RESEARCH METHODOLOGY
      1. RESEARCH PROCESS
      2. PRIMARY RESEARCH
      3. SECONDARY RESEARCH
      4. MARKET SIZE ESTIMATION
      5. FORECAST MODEL
      6. LIST OF ASSUMPTIONS & LIMITATIONS
    4. MARKET DYNAMICS
      1. INTRODUCTION
      2. DRIVERS
        1. LARGE POOL OF PEOPLE SUFFERING FROM DIABETES AND OBESITY
        2. INCREASED IMPOSITION OF TAXES BY GOVERNMNET BODIES ON SUGAR-SWEETENED BEVERAGES
        3. DRIVER IMPACT ANALYSIS
      3. RESTRAINTS
        1. SIDE-EFFECTS ASSOCIATED WITH THE CONSUMPTION OF HIGH-INTENSITY SWEETENERS PRODUCTS
        2. RESTRAINT IMPACT ANALYSIS
      4. OPPORTUNITIES
        1. WIDE USAGE OF HIGH-INTENSITY SWEETENERS IN VARIOUS APPLICATION
        2. GROWING EXPANSION POLICIES ADOPTED BY KEY PLAYERS
      5. CHALLENGES
        1. STRINGENT GOVERNMENT REGULATION
    5. MARKET FACTOR ANALYSIS
      1. VALUE CHAIN ANALYSIS
        1. RAW MATERIAL PROCUREMENT
        2. MANUFACTURING
        3. PACKAGING
      2. SUPPLY CHAIN ANALYSIS
        1. RAW MATERIALS SOURCING
        2. MANUFACTURING
        3. DISTRIBUTION
        4. END-USER
      3. PORTER'S FIVE FORCES MODEL
        1. BARGAINING POWER OF SUPPLIERS
        2. BARGAINING POWER OF BUYERS
        3. THREAT OF NEW ENTRANTS
        4. THREAT OF SUBSTITUTES
        5. INTENSITY OF RIVALRY
      4. IMPACT OF COVID-19 PANDEMIC ON GLOBAL HIGH-INTENSITY SWEETENERS MARKET
        1. IMPACT ON PRODUCTION
        2. IMPACT ON CONSUMER BUYING BEHAVIOUR
        3. IMPACT ON ONLINE VS OFFLINE SALES
        4. IMPACT ON PRICING
        5. IMPACT ON OVERALL GLOBAL HIGH-INTENSITY SWEETENERS MARKET
    6. CATEGORY INSIGHTS
      1. SUPPLY DEMAND OUTLOOK
      2. MARKET OVERVIEW
      3. SUPPLY- DEMAND ANALYSIS
        1. DEMAND ANALYSIS
        2. SUPPLY ANALYSIS
      4. CATEGORY TRENDS
        1. TRENDS
        2. MRFR POINT -OF- VIEW
      5. COST STRUCTURE ANALYSIS
        1. COST STRUCTURE BREAKDOWN
        2. COST COMPONENT & IMPACT ON OVERALL PRICING
        3. FACTORS EFFECTING COST OF RAW MATERIAL
      6. RUSSIA- UKRAINE WAR INSIGHTS
    7. GLOBAL HIGH-INTENSITY SWEETENERS MARKET, BY PRODUCT
      1. OVERVIEW
        1. GLOBAL HIGH-INTENSITY SWEETENERS MARKET ESTIMATES & FORECAST, BY PRODUCT, 2020–2030
      2. SUCRALOSE
        1. SUCRALOSE: MARKET ESTIMATES & FORECAST, BY REGION, 2020–2030
      3. STEVIOSIDE
        1. STEVIOSIDE: MARKET ESTIMATES & FORECAST, BY REGION, 2020–2030
      4. ACESULFAME K
        1. ACESULFAME K: MARKET ESTIMATES & FORECAST, BY REGION, 2020–2030
      5. ASPARTAME
        1. ASPARTAME: MARKET ESTIMATES & FORECAST, BY REGION, 2020–2030
      6. CYCLAMATE
        1. CYCLAMATE: MARKET ESTIMATES & FORECAST, BY REGION, 2020–2030
      7. GLYCYRRHIZIN
        1. GLYCYRRHIZIN: MARKET ESTIMATES & FORECAST, BY REGION, 2020–2030
      8. SACCHARIN
        1. SACCHARIN: MARKET ESTIMATES & FORECAST, BY REGION, 2020–2030
      9. OTHERS
        1. OTHERS: MARKET ESTIMATES & FORECAST, BY REGION, 2020–2030
    8. GLOBAL HIGH-INTENSITY SWEETENERS MARKET, BY FORM
      1. OVERVIEW
        1. GLOBAL HIGH-INTENSITY SWEETENERS MARKET ESTIMATES & FORECAST, BY FORM, 2020–2030
      2. DRY
        1. DRY: MARKET ESTIMATES & FORECAST, BY REGION, 2020–2030
      3. LIQUID
        1. LIQUID: MARKET ESTIMATES & FORECAST, BY REGION, 2020–2030
    9. GLOBAL HIGH-INTENSITY SWEETENERS MARKET, BY CATEGORY
      1. OVERVIEW
        1. GLOBAL HIGH-INTENSITY SWEETENERS MARKET ESTIMATES & FORECAST, BY CATEGORY, 2020–2030
      2. ARTIFICIAL
        1. ARTIFICIAL: MARKET ESTIMATES & FORECAST, BY REGION, 2020–2030
      3. NATURAL
        1. NATURAL: MARKET ESTIMATES & FORECAST, BY REGION, 2020–2030
    10. GLOBAL HIGH-INTENSITY SWEETENERS MARKET, BY APPLICATION
      1. OVERVIEW
        1. GLOBAL HIGH-INTENSITY SWEETENERS MARKET ESTIMATES & FORECAST, BY APPLICATION, 2020–2030
      2. BAKERY & CONFECTIONERY
        1. BAKERY & CONFECTIONERY: MARKET ESTIMATES & FORECAST, BY REGION, 2020–2030
      3. BEVERAGES
        1. BEVERAGES: MARKET ESTIMATES & FORECAST, BY REGION, 2020–2030
      4. DAIRY PRODUCTS
        1. DAIRY PRODUCTS: MARKET ESTIMATES & FORECAST, BY REGION, 2020–2030
      5. DIETARY PRODUCTS
        1. DIETARY PRODUCTS: MARKET ESTIMATES & FORECAST, BY REGION, 2020–2030
      6. PHARMACEUTICALS
        1. PHARMACEUTICALS: MARKET ESTIMATES & FORECAST, BY REGION, 2020–2030
      7. TABLETOP SWEETENERS
        1. TABLETOP SWEETENERS: MARKET ESTIMATES & FORECAST, BY REGION, 2020–2030
      8. PROCESSED FOODS
        1. PROCESSED FOODS: MARKET ESTIMATES & FORECAST, BY REGION, 2020–2030
      9. OTHERS
        1. OTHERS: MARKET ESTIMATES & FORECAST, BY REGION, 2020–2030
    11. GLOBAL HIGH-INTENSITY SWEETENERS MARKET, BY END USER
      1. OVERVIEW
        1. GLOBAL HIGH-INTENSITY SWEETENERS MARKET ESTIMATES & FORECAST, BY END USER, 2020–2030
      2. RESIDENTIAL
        1. RESIDENTIAL: MARKET ESTIMATES & FORECAST, BY REGION, 2020–2030
      3. COMMERCIAL
        1. COMMERCIAL: MARKET ESTIMATES & FORECAST, BY REGION, 2020–2030
    12. GLOBAL HIGH-INTENSITY SWEETENERS MARKET, BY DISTRIBUTION CHANNEL
      1. OVERVIEW
        1. GLOBAL HIGH-INTENSITY SWEETENERS MARKET ESTIMATES & FORECAST, BY DISTRIBUTION CHANNEL, 2020–2030
      2. SUPERMARKETS & HYPERMARKETS
        1. SUPERMARKETS & HYPERMARKETS: MARKET ESTIMATES & FORECAST, BY REGION, 2020–2030
      3. SPECIALTY STORES
        1. SPECIALTY STORES: MARKET ESTIMATES & FORECAST, BY REGION, 2020–2030
      4. ONLINE
        1. ONLINE: MARKET ESTIMATES & FORECAST, BY REGION, 2020–2030
      5. OTHERS
        1. OTHERS: MARKET ESTIMATES & FORECAST, BY REGION, 2020–2030
    13. GLOBAL HIGH-INTENSITY SWEETENERS MARKET, BY CATEGORY IN APPLICATION
      1. OVERVIEW
        1. HIGH-INTENSITY SWEETENER: MARKET ESTIMATES & FORECAST BY CATEGORY IN APPLICATION, 2020-2030
        2. HIGH-INTENSITY SWEETENER: MARKET ESTIMATES & FORECAST BY CATEGORY IN APPLICATION, 2020-2030
    14. GLOBAL HIGH-INTENSITY SWEETENERS MARKET, BY REGION
      1. OVERVIEW
        1. GLOBAL HIGH-INTENSITY SWEETENERS MARKET ESTIMATES & FORECAST, BY REGION, 2020–2030
      2. NORTH AMERICA
        1. NORTH AMERICA HIGH-INTENSITY SWEETENERS MARKET ESTIMATES & FORECAST, BY COUNTRY, 2020–2030
        2. NORTH AMERICA HIGH-INTENSITY SWEETENERS MARKET ESTIMATES & FORECAST, BY PRODUCT, 2020–2030
        3. NORTH AMERICA HIGH-INTENSITY SWEETENERS MARKET ESTIMATES & FORECAST, BY FORM, 2020–2030
        4. NORTH AMERICA HIGH-INTENSITY SWEETENERS MARKET ESTIMATES & FORECAST, BY CATEGORY, 2020–2030
        5. NORTH AMERICA HIGH-INTENSITY SWEETENERS MARKET ESTIMATES & FORECAST, BY APPLICATION, 2020–2030
        6. NORTH AMERICA: MARKET ESTIMATES & FORECAST BY CATEGORY IN APPLICATION, 2020-2030
        7. NORTH AMERICA HIGH-INTENSITY SWEETENERS MARKET ESTIMATES & FORECAST, BY END USER, 2020–2030
        8. NORTH AMERICA HIGH-INTENSITY SWEETENERS MARKET ESTIMATES & FORECAST, BY DISTRIBUTION CHANNEL, 2020–2030
        9. US
        10. CANADA
        11. MEXICO
      3. EUROPE
        1. EUROPE HIGH-INTENSITY SWEETENERS MARKET ESTIMATES & FORECAST, BY COUNTRY, 2020–2030
        2. EUROPE HIGH-INTENSITY SWEETENERS MARKET ESTIMATES & FORECAST, BY PRODUCT, 2020–2030
        3. EUROPE HIGH-INTENSITY SWEETENERS MARKET ESTIMATES & FORECAST, BY FORM, 2020–2030
        4. EUROPE HIGH-INTENSITY SWEETENERS MARKET ESTIMATES & FORECAST, BY CATEGORY, 2020–2030
        5. EUROPE HIGH-INTENSITY SWEETENERS MARKET ESTIMATES & FORECAST, BY APPLICATION, 2020–2030
        6. EUROPE HIGH-INTENSITY SWEETENERS MARKET ESTIMATES & FORECAST, BY CATEGORY IN APPLICATION, 2020–2030
        7. EUROPE HIGH-INTENSITY SWEETENERS MARKET ESTIMATES & FORECAST, BY END USER, 2020–2030
        8. EUROPE HIGH-INTENSITY SWEETENERS MARKET ESTIMATES & FORECAST, BY DISTRIBUTION CHANNEL, 2020–2030
        9. GERMANY
        10. ITALY
        11. SPAIN AND PORTUGAL
        12. AUSTRIA AND SWITZERLAND
        13. UK AND IRELAND
        14. FRANCE
        15. BENELUX
        16. NORDICS
        17. CENTRAL AND EASTERN EUROPE
        18. SOUTHERN EUROPE
      4. ASIA-PACIFIC
        1. ASIA-PACIFIC HIGH-INTENSITY SWEETENERS MARKET ESTIMATES & FORECAST, BY COUNTRY, 2020–2030
        2. ASIA-PACIFIC HIGH-INTENSITY SWEETENERS MARKET ESTIMATES & FORECAST, BY PRODUCT, 2020–2030
        3. ASIA-PACIFIC HIGH-INTENSITY SWEETENERS MARKET ESTIMATES & FORECAST, BY FORM, 2020–2030
        4. ASIA-PACIFIC HIGH-INTENSITY SWEETENERS MARKET ESTIMATES & FORECAST, BY CATEGORY, 2020–2030
        5. ASIA-PACIFIC HIGH-INTENSITY SWEETENERS MARKET ESTIMATES & FORECAST, BY APPLICATION, 2020–2030
        6. ASIA-PACIFIC HIGH-INTENSITY SWEETENERS MARKET ESTIMATES & FORECAST, BY CATEGORY IN APPLICATION, 2020–2030
        7. ASIA-PACIFIC HIGH-INTENSITY SWEETENERS MARKET ESTIMATES & FORECAST, BY END USER, 2020–2030
        8. ASIA-PACIFIC HIGH-INTENSITY SWEETENERS MARKET ESTIMATES & FORECAST, BY DISTRIBUTION CHANNEL, 2020–2030
        9. CHINA
        10. JAPAN
        11. INDIA
        12. AUSTRALIA AND NEW ZEALAND
        13. REST OF ASIA-PACIFIC
      5. REST OF THE WORLD
        1. REST OF THE WORLD HIGH-INTENSITY SWEETENERS MARKET ESTIMATES & FORECAST, BY COUNTRY, 2020–2030
        2. REST OF THE WORLD HIGH-INTENSITY SWEETENERS MARKET ESTIMATES & FORECAST, BY PRODUCT, 2020–2030
        3. REST OF THE WORLD HIGH-INTENSITY SWEETENERS MARKET ESTIMATES & FORECAST, BY FORM, 2020–2030
        4. REST OF THE WORLD HIGH-INTENSITY SWEETENERS MARKET ESTIMATES & FORECAST, BY CATEGORY, 2020–2030
        5. REST OF THE WORLD HIGH-INTENSITY SWEETENERS MARKET ESTIMATES & FORECAST, BY APPLICATION, 2020–2030
        6. REST OF THE WORLD HIGH-INTENSITY SWEETENERS MARKET ESTIMATES & FORECAST, BY CATEGORY IN APPLICATION, 2020–2030
        7. REST OF THE WORLD HIGH-INTENSITY SWEETENERS MARKET ESTIMATES & FORECAST, BY END USER, 2020–2030
        8. REST OF THE WORLD HIGH-INTENSITY SWEETENERS MARKET ESTIMATES & FORECAST, BY DISTRIBUTION CHANNEL, 2020–2030
        9. SOUTH AMERICA
        10. MIDDLE EAST
        11. AFRICA
    15. COMPETITIVE LANDSCAPE
      1. INTRODUCTION
        1. MARKET STRATEGY ANALYSIS
      2. COMPETITIVE BENCHMARKING
      3. KEY DEVELOPMENTS & GROWTH STRATEGIES
        1. PRODUCT LAUNCH
        2. ACQUISITION
        3. INVESTMENT
        4. EXPANSION
        5. MERGER
        6. AGREEMENT
        7. PARTNERSHIP
    16. COMPANY PROFILES
      1. TATE & LYLE
        1. COMPANY OVERVIEW
        2. FINANCIAL OVERVIEW
        3. PRODUCTS OFFERED
        4. KEY DEVELOPMENTS
        5. SWOT ANALYSIS
        6. KEY STRATEGIES
      2. CARGILL INCORPORATED
        1. COMPANY OVERVIEW
        2. FINANCIAL OVERVIEW
        3. PRODUCTS OFFERED
        4. KEY DEVELOPMENTS
        5. SWOT ANALYSIS
        6. KEY STRATEGIES
      3. INTERNATIONAL FLAVORS & FRAGRANCES INC.
        1. COMPANY OVERVIEW
        2. FINANCIAL OVERVIEW
        3. PRODUCTS OFFERED
        4. KEY DEVELOPMENTS
        5. SWOT ANALYSIS
        6. KEY STRATEGIES
      4. ARCHER-DANIELS-MIDLAND COMPANY (ADM)
        1. COMPANY OVERVIEW
        2. FINANCIAL OVERVIEW
        3. PRODUCTS OFFERED
        4. KEY DEVELOPMENTS
        5. SWOT ANALYSIS
        6. KEY STRATEGIES
      5. INGREDION INCORPORATED
        1. COMPANY OVERVIEW
        2. FINANCIAL OVERVIEW
        3. PRODUCTS OFFERED
        4. KEY DEVELOPMENTS
        5. SWOT ANALYSIS
        6. KEY STRATEGIES
      6. AJINOMOTO CO., INC.
        1. COMPANY OVERVIEW
        2. FINANCIAL OVERVIEW
        3. PRODUCTS OFFERED
        4. KEY DEVELOPMENTS
        5. KEY STRATEGIES
      7. HYET SWEET
        1. COMPANY OVERVIEW
        2. FINANCIAL OVERVIEW
        3. PRODUCTS OFFERED
        4. KEY DEVELOPMENTS
        5. KEY STRATEGIES
      8. HERMES SWEETENERS LTD
        1. COMPANY OVERVIEW
        2. FINANCIAL OVERVIEW
        3. PRODUCTS OFFERED
        4. KEY DEVELOPMENTS
        5. KEY STRATEGIES
      9. JK SUCRALOSE INC.
        1. COMPANY OVERVIEW
        2. FINANCIAL OVERVIEW
        3. PRODUCTS/SERVICES OFFERED
        4. KEY DEVELOPMENTS
        5. KEY STRATEGIES
      10. HEARTLAND FOOD PRODUCTS GROUP
        1. COMPANY OVERVIEW
        2. FINANCIAL OVERVIEW
        3. PRODUCTS OFFERED
        4. KEY DEVELOPMENTS
        5. KEY STRATEGIES
    17. APPENDIX
      1. REFERENCES
      2. RELATED REPORTS
    18. List of Tables and Figures
      1. TABLE 1 PRIMARY INTERVIEWS 39
      2. TABLE 2 LIST OF ASSUMPTIONS & LIMITATIONS 43
      3. TABLE 3 GLOBAL HIGH-INTENSITY SWEETENERS MARKET, BY REGION, 2020–2030 (KILOTONS) 64
      4. TABLE 4 GLOBAL HIGH-INTENSITY SWEETENERS MARKET ESTIMATES & FORECAST, BY PRODUCT, 2020–2030 (USD MILLION) 71
      5. TABLE 5 GLOBAL HIGH-INTENSITY SWEETENERS MARKET ESTIMATES & FORECAST, BY PRODUCT, 2020–2030 (KILOTONS) 71
      6. TABLE 6 SUCRALOSE: MARKET ESTIMATES & FORECAST, BY REGION, 2020–2030 (USD MILLION) 72
      7. TABLE 7 SUCRALOSE: MARKET ESTIMATES & FORECAST, BY REGION, 2020–2030 (KILOTONS) 72
      8. TABLE 8 STEVIOSIDE: MARKET ESTIMATES & FORECAST, BY REGION, 2020–2030 (USD MILLION) 73
      9. TABLE 9 STEVIOSIDE: MARKET ESTIMATES & FORECAST, BY REGION, 2020–2030 (KILOTONS) 73
      10. TABLE 10 ACESULFAME K: MARKET ESTIMATES & FORECAST, BY REGION, 2020–2030 (USD MILLION) 74
      11. TABLE 11 ACESULFAME K: MARKET ESTIMATES & FORECAST, BY REGION, 2020–2030 (KILOTONS) 74
      12. TABLE 12 ASPARTAME: MARKET ESTIMATES & FORECAST, BY REGION, 2020–2030 (USD MILLION) 75
      13. TABLE 13 ASPARTAME: MARKET ESTIMATES & FORECAST, BY REGION, 2020–2030 (KILOTONS) 75
      14. TABLE 14 CYCLAMATE: MARKET ESTIMATES & FORECAST, BY REGION, 2020–2030 (USD MILLION) 76
      15. TABLE 15 CYCLAMATE: MARKET ESTIMATES & FORECAST, BY REGION, 2020–2030 (KILOTONS) 76
      16. TABLE 16 GLYCYRRHIZIN: MARKET ESTIMATES & FORECAST, BY REGION, 2020–2030 (USD MILLION) 77
      17. TABLE 17 GLYCYRRHIZIN: MARKET ESTIMATES & FORECAST, BY REGION, 2020–2030 (KILOTONS) 77
      18. TABLE 18 SACCHARIN: MARKET ESTIMATES & FORECAST, BY REGION, 2020–2030 (USD MILLION) 78
      19. TABLE 19 SACCHARIN: MARKET ESTIMATES & FORECAST, BY REGION, 2020–2030 (KILOTONS) 78
      20. TABLE 20 OTHERS: MARKET ESTIMATES & FORECAST, BY REGION, 2020–2030 (USD MILLION) 79
      21. TABLE 21 OTHERS: MARKET ESTIMATES & FORECAST, BY REGION, 2020–2030 (KILOTONS) 79
      22. TABLE 22 GLOBAL HIGH-INTENSITY SWEETENERS MARKET ESTIMATES & FORECAST, BY FORM, 2020–2030 (USD MILLION) 81
      23. TABLE 23 GLOBAL HIGH-INTENSITY SWEETENERS MARKET ESTIMATES & FORECAST, BY FORM, 2020–2030 (KILOTONS) 81
      24. TABLE 24 DRY: MARKET ESTIMATES & FORECAST, BY REGION, 2020–2030 (USD MILLION) 82
      25. TABLE 25 DRY: MARKET ESTIMATES & FORECAST, BY REGION, 2020–2030 (KILOTONS) 82
      26. TABLE 26 LIQUID: MARKET ESTIMATES & FORECAST, BY REGION, 2020–2030 (USD MILLION) 83
      27. TABLE 27 LIQUID: MARKET ESTIMATES & FORECAST, BY REGION, 2020–2030 (KILOTONS) 83
      28. TABLE 28 GLOBAL HIGH-INTENSITY SWEETENERS MARKET ESTIMATES & FORECAST, BY CATEGORY, 2020–2030 (USD MILLION) 85
      29. TABLE 29 GLOBAL HIGH-INTENSITY SWEETENERS MARKET ESTIMATES & FORECAST, BY CATEGORY, 2020–2030 (KILOTONS) 85
      30. TABLE 30 ARTIFICIAL: MARKET ESTIMATES & FORECAST, BY REGION, 2020–2030 (USD MILLION) 86
      31. TABLE 31 ARTIFICIAL: MARKET ESTIMATES & FORECAST, BY REGION, 2020–2030 (KILOTONS) 86
      32. TABLE 32 NATURAL: MARKET ESTIMATES & FORECAST, BY REGION, 2020–2030 (USD MILLION) 87
      33. TABLE 33 NATURAL: MARKET ESTIMATES & FORECAST, BY REGION, 2020–2030 (KILOTONS) 87
      34. TABLE 34 GLOBAL HIGH-INTENSITY SWEETENERS MARKET ESTIMATES & FORECAST, BY APPLICATION, 2020–2030 (USD MILLION) 89
      35. TABLE 35 GLOBAL HIGH-INTENSITY SWEETENERS MARKET ESTIMATES & FORECAST, BY APPLICATION, 2020–2030 (KILOTONS) 89
      36. TABLE 36 BAKERY & CONFECTIONERY: MARKET ESTIMATES & FORECAST, BY REGION, 2020–2030 (USD MILLION) 90
      37. TABLE 37 BAKERY & CONFECTIONERY: MARKET ESTIMATES & FORECAST, BY REGION, 2020–2030 (KILOTONS) 90
      38. TABLE 38 BEVERAGES: MARKET ESTIMATES & FORECAST, BY REGION, 2020–2030 (USD MILLION) 91
      39. TABLE 39 BEVERAGES: MARKET ESTIMATES & FORECAST, BY REGION, 2020–2030 (KILOTONS) 91
      40. TABLE 40 DAIRY PRODUCTS: MARKET ESTIMATES & FORECAST, BY REGION, 2020–2030 (USD MILLION) 92
      41. TABLE 41 DAIRY PRODUCTS: MARKET ESTIMATES & FORECAST, BY REGION, 2020–2030 (KILOTONS) 92
      42. TABLE 42 DIETARY PRODUCTS: MARKET ESTIMATES & FORECAST, BY REGION, 2020–2030 (USD MILLION) 93
      43. TABLE 43 DIETARY PRODUCTS: MARKET ESTIMATES & FORECAST, BY REGION, 2020–2030 (KILOTONS) 93
      44. TABLE 44 PHARMACEUTICALS: MARKET ESTIMATES & FORECAST, BY REGION, 2020–2030 (USD MILLION) 94
      45. TABLE 45 PHARMACEUTICALS: MARKET ESTIMATES & FORECAST, BY REGION, 2020–2030 (KILOTONS) 94
      46. TABLE 46 TABLETOP SWEETENERS: MARKET ESTIMATES & FORECAST, BY REGION, 2020–2030 (USD MILLION) 95
      47. TABLE 47 TABLETOP SWEETENERS: MARKET ESTIMATES & FORECAST, BY REGION, 2020–2030 (KILOTONS) 95
      48. TABLE 48 PROCESSED FOODS: MARKET ESTIMATES & FORECAST, BY REGION, 2020–2030 (USD MILLION) 96
      49. TABLE 49 PROCESSED FOODS: MARKET ESTIMATES & FORECAST, BY REGION, 2020–2030 (KILOTONS) 96
      50. TABLE 50 OTHERS: MARKET ESTIMATES & FORECAST, BY REGION, 2020–2030 (USD MILLION) 97
      51. TABLE 51 OTHERS: MARKET ESTIMATES & FORECAST, BY REGION, 2020–2030 (KILOTONS) 97
      52. TABLE 52 GLOBAL HIGH-INTENSITY SWEETENERS MARKET ESTIMATES & FORECAST, BY END USER, 2020–2030 (USD MILLION) 99
      53. TABLE 53 GLOBAL HIGH-INTENSITY SWEETENERS MARKET ESTIMATES & FORECAST, BY END USER, 2020–2030 (KILOTONS) 99
      54. TABLE 54 RESIDENTIAL: MARKET ESTIMATES & FORECAST, BY REGION, 2020–2030 (USD MILLION) 99
      55. TABLE 55 RESIDENTIAL: MARKET ESTIMATES & FORECAST, BY REGION, 2020–2030 (KILOTONS) 100
      56. TABLE 56 COMMERCIAL: MARKET ESTIMATES & FORECAST, BY REGION, 2020–2030 (USD MILLION) 100
      57. TABLE 57 COMMERCIAL: MARKET ESTIMATES & FORECAST, BY REGION, 2020–2030 (KILOTONS) 100
      58. TABLE 58 GLOBAL HIGH-INTENSITY SWEETENERS MARKET ESTIMATES & FORECAST, BY DISTRIBUTION CHANNEL, 2020–2030 (USD MILLION) 102
      59. TABLE 59 GLOBAL HIGH-INTENSITY SWEETENERS MARKET ESTIMATES & FORECAST, BY DISTRIBUTION CHANNEL, 2020–2030 (KILOTONS) 102
      60. TABLE 60 SUPERMARKETS & HYPERMARKETS: MARKET ESTIMATES & FORECAST, BY REGION, 2020–2030 (USD MILLION) 103
      61. TABLE 61 SUPERMARKETS & HYPERMARKETS: MARKET ESTIMATES & FORECAST, BY REGION, 2020–2030 (KILOTONS) 103
      62. TABLE 62 SPECIALTY STORES: MARKET ESTIMATES & FORECAST, BY REGION, 2020–2030 (USD MILLION) 104
      63. TABLE 63 SPECIALTY STORES: MARKET ESTIMATES & FORECAST, BY REGION, 2020–2030 (KILOTONS) 104
      64. TABLE 64 ONLINE: MARKET ESTIMATES & FORECAST, BY REGION, 2020–2030 (USD MILLION) 105
      65. TABLE 65 ONLINE: MARKET ESTIMATES & FORECAST, BY REGION, 2020–2030 (KILOTONS) 105
      66. TABLE 66 OTHERS: MARKET ESTIMATES & FORECAST, BY REGION, 2020–2030 (USD MILLION) 106
      67. TABLE 67 OTHERS: MARKET ESTIMATES & FORECAST, BY REGION, 2020–2030 (KILOTONS) 106
      68. TABLE 68 HIGH-INTENSITY SWEETENER MARKET ESTIMATES & FORECAST, BY CATEGORY IN APPLICATION, 2020–2030 (USD MILLION) 107
      69. TABLE 69 HIGH-INTENSITY SWEETENER MARKET ESTIMATES & FORECAST, BY CATEGORY IN APPLICATION, 2020–2030 (KILOTONS) 108
      70. TABLE 70 GLOBAL HIGH-INTENSITY SWEETENERS MARKET ESTIMATES & FORECAST, BY REGION, 2020–2030 (USD MILLION) 110
      71. TABLE 71 GLOBAL HIGH-INTENSITY SWEETENERS MARKET ESTIMATES & FORECAST, BY REGION, 2020–2030 (KILOTONS) 110
      72. TABLE 72 NORTH AMERICA: MARKET ESTIMATES & FORECAST, BY COUNTRY, 2020–2030 (USD MILLION) 111
      73. TABLE 73 NORTH AMERICA: MARKET ESTIMATES & FORECAST, BY COUNTRY, 2020–2030 (KILOTONS) 112
      74. TABLE 74 NORTH AMERICA: MARKET ESTIMATES, BY PRODUCT, 2020–2030 (USD MILLION) 112
      75. TABLE 75 NORTH AMERICA: MARKET ESTIMATES, BY PRODUCT, 2020–2030 (KILOTONS) 112
      76. TABLE 76 NORTH AMERICA: MARKET ESTIMATES, BY FORM, 2020–2030 (USD MILLION) 113
      77. TABLE 77 NORTH AMERICA: MARKET ESTIMATES, BY FORM, 2020–2030 (KILOTONS) 113
      78. TABLE 78 NORTH AMERICA: MARKET ESTIMATES, BY CATEGORY, 2020–2030 (USD MILLION) 113
      79. TABLE 79 NORTH AMERICA: MARKET ESTIMATES, BY CATEGORY, 2020–2030 (KILOTONS) 113
      80. TABLE 80 NORTH AMERICA: MARKET ESTIMATES, BY APPLICATION, 2020–2030 (USD MILLION) 114
      81. TABLE 81 NORTH AMERICA: MARKET ESTIMATES, BY APPLICATION, 2020–2030 (KILOTONS) 114
      82. TABLE 82 NORTH AMERICA: MARKET ESTIMATES & FORECAST, BY CATEGORY IN APPLICATION, 2020–2030 (USD MILLION) 115
      83. TABLE 83 NORTH AMERICA: MARKET ESTIMATES & FORECAST, BY CATEGORY IN APPLICATION, 2020–2030 (KILOTONS) 116
      84. TABLE 84 NORTH AMERICA: MARKET ESTIMATES, BY END USER, 2020–2030 (USD MILLION) 116
      85. TABLE 85 NORTH AMERICA: MARKET ESTIMATES, BY END USER, 2020–2030 (KILOTONS) 117
      86. TABLE 86 NORTH AMERICA: MARKET ESTIMATES, BY DISTRIBUTION CHANNEL, 2020–2030 (USD MILLION) 117
      87. TABLE 87 NORTH AMERICA: MARKET ESTIMATES, BY DISTRIBUTION CHANNEL, 2020–2030 (KILOTONS) 117
      88. TABLE 88 US: MARKET ESTIMATES, BY PRODUCT, 2020–2030 (USD MILLION) 118
      89. TABLE 89 US: MARKET ESTIMATES, BY PRODUCT, 2020–2030 (KILOTONS) 118
      90. TABLE 90 US: MARKET ESTIMATES, BY FORM, 2020–2030 (USD MILLION) 118
      91. TABLE 91 US: MARKET ESTIMATES, BY FORM, 2020–2030 (KILOTONS) 119
      92. TABLE 92 US: MARKET ESTIMATES, BY CATEGORY, 2020–2030 (USD MILLION) 119
      93. TABLE 93 US: MARKET ESTIMATES, BY CATEGORY, 2020–2030 (KILOTONS) 119
      94. TABLE 94 US: MARKET ESTIMATES, BY APPLICATION, 2020–2030 (USD MILLION) 119
      95. TABLE 95 US: MARKET ESTIMATES, BY APPLICATION, 2020–2030 (KILOTONS) 120
      96. TABLE 96 US: MARKET ESTIMATES & FORECAST, BY CATEGORY IN APPLICATION, 2020–2030 (USD MILLION) 120
      97. TABLE 97 US: MARKET ESTIMATES & FORECAST, BY CATEGORY IN APPLICATION, 2020–2030 (KILOTONS) 121
      98. TABLE 98 US: MARKET ESTIMATES, BY END USER, 2020–2030 (USD MILLION) 121
      99. TABLE 99 US: MARKET ESTIMATES, BY END USER, 2020–2030 (KILOTONS) 121
      100. TABLE 100 US: MARKET ESTIMATES, BY DISTRIBUTION CHANNEL, 2020–2030 (USD MILLION) 122
      101. TABLE 101 US: MARKET ESTIMATES, BY DISTRIBUTION CHANNEL, 2020–2030 (KILOTONS) 122
      102. TABLE 102 CANADA: MARKET ESTIMATES, BY PRODUCT, 2020–2030 (USD MILLION) 122
      103. TABLE 103 CANADA: MARKET ESTIMATES, BY PRODUCT, 2020–2030 (KILOTONS) 123
      104. TABLE 104 CANADA: MARKET ESTIMATES, BY FORM, 2020–2030 (USD MILLION) 123
      105. TABLE 105 CANADA: MARKET ESTIMATES, BY FORM, 2020–2030 (KILOTONS) 123
      106. TABLE 106 CANADA: MARKET ESTIMATES, BY CATEGORY, 2020–2030 (USD MILLION) 123
      107. TABLE 107 CANADA: MARKET ESTIMATES, BY CATEGORY, 2020–2030 (KILOTONS) 124
      108. TABLE 108 CANADA: MARKET ESTIMATES, BY APPLICATION, 2020–2030 (USD MILLION) 124
      109. TABLE 109 CANADA: MARKET ESTIMATES, BY APPLICATION, 2020–2030 (KILOTONS) 124
      110. TABLE 110 CANADA: MARKET ESTIMATES & FORECAST, BY CATEGORY IN APPLICATION, 2020–2030 (USD MILLION) 125
      111. TABLE 111 CANADA: MARKET ESTIMATES & FORECAST, BY CATEGORY IN APPLICATION, 2020–2030 (KILOTONS) 126
      112. TABLE 112 CANADA: MARKET ESTIMATES, BY END USER, 2020–2030 (USD MILLION) 126
      113. TABLE 113 CANADA: MARKET ESTIMATES, BY END USER, 2020–2030 (KILOTONS) 127
      114. TABLE 114 CANADA: MARKET ESTIMATES, BY DISTRIBUTION CHANNEL, 2020–2030 (USD MILLION) 127
      115. TABLE 115 CANADA: MARKET ESTIMATES, BY DISTRIBUTION CHANNEL, 2020–2030 (KILOTONS) 127
      116. TABLE 116 MEXICO: MARKET ESTIMATES, BY PRODUCT, 2020–2030 (USD MILLION) 128
      117. TABLE 117 MEXICO: MARKET ESTIMATES, BY PRODUCT, 2020–2030 (KILOTONS) 128
      118. TABLE 118 MEXICO: MARKET ESTIMATES, BY FORM, 2020–2030 (USD MILLION) 128
      119. TABLE 119 MEXICO: MARKET ESTIMATES, BY FORM, 2020–2030 (KILOTONS) 129
      120. TABLE 120 MEXICO: MARKET ESTIMATES, BY CATEGORY, 2020–2030 (USD MILLION) 129
      121. TABLE 121 MEXICO: MARKET ESTIMATES, BY CATEGORY, 2020–2030 (KILOTONS) 129
      122. TABLE 122 MEXICO: MARKET ESTIMATES, BY APPLICATION, 2020–2030 (USD MILLION) 129
      123. TABLE 123 MEXICO: MARKET ESTIMATES, BY APPLICATION, 2020–2030 (KILOTONS) 130
      124. TABLE 124 MEXICO: MARKET ESTIMATES & FORECAST, BY CATEGORY IN APPLICATION, 2020–2030 (USD MILLION) 130
      125. TABLE 125 MEXICO: MARKET ESTIMATES & FORECAST, BY CATEGORY IN APPLICATION, 2020–2030 (KILOTONS) 131
      126. TABLE 126 MEXICO: MARKET ESTIMATES, BY END USER, 2020–2030 (USD MILLION) 131
      127. TABLE 127 MEXICO: MARKET ESTIMATES, BY END USER, 2020–2030 (KILOTONS) 132
      128. TABLE 128 MEXICO: MARKET ESTIMATES, BY DISTRIBUTION CHANNEL, 2020–2030 (USD MILLION) 132
      129. TABLE 129 MEXICO: MARKET ESTIMATES, BY DISTRIBUTION CHANNEL, 2020–2030 (KILOTONS) 132
      130. TABLE 130 EUROPE: MARKET ESTIMATES & FORECAST, BY COUNTRY, 2020–2030 (USD MILLION) 134
      131. TABLE 131 EUROPE: MARKET ESTIMATES & FORECAST, BY COUNTRY, 2020–2030 (KILOTONS) 134
      132. TABLE 132 EUROPE: MARKET ESTIMATES, BY PRODUCT, 2020–2030 (USD MILLION) 135
      133. TABLE 133 EUROPE: MARKET ESTIMATES, BY PRODUCT, 2020–2030 (KILOTONS) 135
      134. TABLE 134 EUROPE: MARKET ESTIMATES, BY FORM, 2020–2030 (USD MILLION) 135
      135. TABLE 135 EUROPE: MARKET ESTIMATES, BY FORM, 2020–2030 (KILOTONS) 136
      136. TABLE 136 EUROPE: MARKET ESTIMATES, BY CATEGORY, 2020–2030 (USD MILLION) 136
      137. TABLE 137 EUROPE: MARKET ESTIMATES, BY CATEGORY, 2020–2030 (KILOTONS) 136
      138. TABLE 138 EUROPE: MARKET ESTIMATES, BY APPLICATION, 2020–2030 (USD MILLION) 137
      139. TABLE 139 EUROPE: MARKET ESTIMATES, BY APPLICATION, 2020–2030 (KILOTONS) 137
      140. TABLE 140 EUROPE: MARKET ESTIMATES & FORECAST, BY CATEGORY IN APPLICATION, 2020–2030 (USD MILLION) 138
      141. TABLE 141 EUROPE: MARKET ESTIMATES & FORECAST, BY CATEGORY IN APPLICATION, 2020–2030 (KILOTONS) 139
      142. TABLE 142 EUROPE: MARKET ESTIMATES, BY END USER, 2020–2030 (USD MILLION) 139
      143. TABLE 143 EUROPE: MARKET ESTIMATES, BY END USER, 2020–2030 (KILOTONS) 140
      144. TABLE 144 EUROPE: MARKET ESTIMATES, BY DISTRIBUTION CHANNEL, 2020–2030 (USD MILLION) 140
      145. TABLE 145 EUROPE: MARKET ESTIMATES, BY DISTRIBUTION CHANNEL, 2020–2030 (KILOTONS) 140
      146. TABLE 146 GERMANY: MARKET ESTIMATES, BY PRODUCT, 2020–2030 (USD MILLION) 141
      147. TABLE 147 GERMANY: MARKET ESTIMATES, BY PRODUCT, 2020–2030 (KILOTONS) 141
      148. TABLE 148 GERMANY: MARKET ESTIMATES, BY FORM, 2020–2030 (USD MILLION) 141
      149. TABLE 149 GERMANY: MARKET ESTIMATES, BY FORM, 2020–2030 (KILOTONS) 142
      150. TABLE 150 GERMANY: MARKET ESTIMATES, BY CATEGORY, 2020–2030 (USD MILLION) 142
      151. TABLE 151 GERMANY: MARKET ESTIMATES, BY CATEGORY, 2020–2030 (KILOTONS) 142
      152. TABLE 152 GERMANY: MARKET ESTIMATES, BY APPLICATION, 2020–2030 (USD MILLION) 142
      153. TABLE 153 GERMANY: MARKET ESTIMATES, BY APPLICATION, 2020–2030 (KILOTONS) 143
      154. TABLE 154 GERMANY: MARKET ESTIMATES & FORECAST, BY CATEGORY IN APPLICATION, 2020–2030 (USD MILLION) 143
      155. TABLE 155 GERMANY: MARKET ESTIMATES & FORECAST, BY CATEGORY IN APPLICATION, 2020–2030 (KILOTONS) 144
      156. TABLE 156 GERMANY: MARKET ESTIMATES, BY END USER, 2020–2030 (USD MILLION) 144
      157. TABLE 157 GERMANY: MARKET ESTIMATES, BY END USER, 2020–2030 (KILOTONS) 145
      158. TABLE 158 GERMANY: MARKET ESTIMATES, BY DISTRIBUTION CHANNEL, 2020–2030 (USD MILLION) 145
      159. TABLE 159 GERMANY: MARKET ESTIMATES, BY DISTRIBUTION CHANNEL, 2020–2030 (KILOTONS) 145
      160. TABLE 160 ITALY: MARKET ESTIMATES, BY PRODUCT, 2020–2030 (USD MILLION) 146
      161. TABLE 161 ITALY: MARKET ESTIMATES, BY PRODUCT, 2020–2030 (KILOTONS) 146
      162. TABLE 162 ITALY: MARKET ESTIMATES, BY FORM, 2020–2030 (USD MILLION) 146
      163. TABLE 163 ITALY: MARKET ESTIMATES, BY FORM, 2020–2030 (KILOTONS) 147
      164. TABLE 164 ITALY: MARKET ESTIMATES, BY CATEGORY, 2020–2030 (USD MILLION) 147
      165. TABLE 165 ITALY: MARKET ESTIMATES, BY CATEGORY, 2020–2030 (KILOTONS) 147
      166. TABLE 166 ITALY: MARKET ESTIMATES, BY APPLICATION, 2020–2030 (USD MILLION) 147
      167. TABLE 167 ITALY: MARKET ESTIMATES, BY APPLICATION, 2020–2030 (KILOTONS) 148
      168. TABLE 168 ITALY: MARKET ESTIMATES & FORECAST, BY CATEGORY IN APPLICATION, 2020–2030 (USD MILLION) 148
      169. TABLE 169 ITALY: MARKET ESTIMATES & FORECAST, BY CATEGORY IN APPLICATION, 2020–2030 (KILOTONS) 149
      170. TABLE 170 ITALY: MARKET ESTIMATES, BY END USER, 2020–2030 (USD MILLION) 149
      171. TABLE 171 ITALY: MARKET ESTIMATES, BY END USER, 2020–2030 (KILOTONS) 150
      172. TABLE 172 ITALY: MARKET ESTIMATES, BY DISTRIBUTION CHANNEL, 2020–2030 (USD MILLION) 150
      173. TABLE 173 ITALY: MARKET ESTIMATES, BY DISTRIBUTION CHANNEL, 2020–2030 (KILOTONS) 150
      174. TABLE 174 SPAIN AND PORTUGAL: MARKET ESTIMATES, BY PRODUCT, 2020–2030 (USD MILLION) 151
      175. TABLE 175 SPAIN AND PORTUGAL: MARKET ESTIMATES, BY PRODUCT, 2020–2030 (KILOTONS) 151
      176. TABLE 176 SPAIN AND PORTUGAL: MARKET ESTIMATES, BY FORM, 2020–2030 (USD MILLION 151
      177. TABLE 177 SPAIN AND PORTUGAL: MARKET ESTIMATES, BY FORM, 2020–2030 (KILOTONS) 152
      178. TABLE 178 SPAIN AND PORTUGAL: MARKET ESTIMATES, BY CATEGORY, 2020–2030 (USD MILLION 152
      179. TABLE 179 SPAIN AND PORTUGAL: MARKET ESTIMATES, BY CATEGORY, 2020–2030 (KILOTONS) 152
      180. TABLE 180 SPAIN AND PORTUGAL: MARKET ESTIMATES, BY APPLICATION, 2020–2030 (USD MILLION 152
      181. TABLE 181 SPAIN AND PORTUGAL: MARKET ESTIMATES, BY APPLICATION, 2020–2030 (KILOTONS) 153
      182. TABLE 182 SPAIN & PORTUGAL: MARKET ESTIMATES & FORECAST, BY CATEGORY IN APPLICATION, 2020–2030 (USD MILLION) 153
      183. TABLE 183 SPAIN & PORTUGAL: MARKET ESTIMATES & FORECAST, BY CATEGORY IN APPLICATION, 2020–2030 (KILOTONS) 154
      184. TABLE 184 SPAIN AND PORTUGAL: MARKET ESTIMATES, BY END USER, 2020–2030 (USD MILLION 154
      185. TABLE 185 SPAIN AND PORTUGAL: MARKET ESTIMATES, BY END USER, 2020–2030 (KILOTONS) 155
      186. TABLE 186 SPAIN AND PORTUGAL: MARKET ESTIMATES, BY DISTRIBUTION CHANNEL, 2020–2030 (USD MILLION 155
      187. TABLE 187 SPAIN AND PORTUGAL: MARKET ESTIMATES, BY DISTRIBUTION CHANNEL, 2020–2030 (KILOTONS) 155
      188. TABLE 188 AUSTRIA AND SWITZERLAND: MARKET ESTIMATES, BY PRODUCT, 2020–2030 (USD MILLION) 156
      189. TABLE 189 AUSTRIA AND SWITZERLAND: MARKET ESTIMATES, BY PRODUCT, 2020–2030 (KILOTONS) 156
      190. TABLE 190 AUSTRIA AND SWITZERLAND: MARKET ESTIMATES, BY FORM, 2020–2030 (USD MILLION) 156
      191. TABLE 191 AUSTRIA AND SWITZERLAND: MARKET ESTIMATES, BY FORM, 2020–2030 (KILOTONS) 157
      192. TABLE 192 AUSTRIA AND SWITZERLAND: MARKET ESTIMATES, BY CATEGORY, 2020–2030 (USD MILLION) 157
      193. TABLE 193 AUSTRIA AND SWITZERLAND: MARKET ESTIMATES, BY CATEGORY, 2020–2030 (KILOTONS) 157
      194. TABLE 194 AUSTRIA AND SWITZERLAND: MARKET ESTIMATES, BY APPLICATION, 2020–2030 (USD MILLION) 157
      195. TABLE 195 AUSTRIA AND SWITZERLAND: MARKET ESTIMATES, BY APPLICATION, 2020–2030 (KILOTONS) 158
      196. TABLE 196 AUSTRIA & SWITZERLAND: MARKET ESTIMATES & FORECAST, BY CATEGORY IN APPLICATION, 2020–2030 (USD MILLION) 158
      197. TABLE 197 AUSTRIA & SWITZERLAND: MARKET ESTIMATES & FORECAST, BY CATEGORY IN APPLICATION, 2020–2030 (KILOTONS) 159
      198. TABLE 198 AUSTRIA AND SWITZERLAND: MARKET ESTIMATES, BY END USER, 2020–2030 (USD MILLION) 159
      199. TABLE 199 AUSTRIA AND SWITZERLAND: MARKET ESTIMATES, BY END USER, 2020–2030 (KILOTONS) 160
      200. TABLE 200 AUSTRIA AND SWITZERLAND: MARKET ESTIMATES, BY DISTRIBUTION CHANNEL, 2020–2030 (USD MILLION) 160
      201. TABLE 201 AUSTRIA AND SWITZERLAND: MARKET ESTIMATES, BY DISTRIBUTION CHANNEL, 2020–2030 (KILOTONS) 160
      202. TABLE 202 UK AND IRELAND: MARKET ESTIMATES, BY PRODUCT, 2020–2030 (USD MILLION) 161
      203. TABLE 203 UK AND IRELAND: MARKET ESTIMATES, BY PRODUCT, 2020–2030 (KILOTONS) 161
      204. TABLE 204 UK AND IRELAND: MARKET ESTIMATES, BY FORM, 2020–2030 (USD MILLION) 161
      205. TABLE 205 UK AND IRELAND: MARKET ESTIMATES, BY FORM, 2020–2030 (KILOTONS) 162
      206. TABLE 206 UK AND IRELAND: MARKET ESTIMATES, BY CATEGORY, 2020–2030 (USD MILLION) 162
      207. TABLE 207 UK AND IRELAND: MARKET ESTIMATES, BY CATEGORY, 2020–2030 (KILOTONS) 162
      208. TABLE 208 UK AND IRELAND: MARKET ESTIMATES, BY APPLICATION, 2020–2030 (USD MILLION) 162
      209. TABLE 209 UK AND IRELAND: MARKET ESTIMATES, BY APPLICATION, 2020–2030 (KILOTONS) 163
      210. TABLE 210 UK & IRELAND: MARKET ESTIMATES & FORECAST, BY CATEGORY IN APPLICATION, 2020–2030 (USD MILLION) 163
      211. TABLE 211 UK & IRELAND: MARKET ESTIMATES & FORECAST, BY CATEGORY IN APPLICATION, 2020–2030 (KILOTONS) 164
      212. TABLE 212 UK AND IRELAND: MARKET ESTIMATES, BY END USER, 2020–2030 (USD MILLION) 164
      213. TABLE 213 UK AND IRELAND: MARKET ESTIMATES, BY END USER, 2020–2030 (KILOTONS) 165
      214. TABLE 214 UK AND IRELAND: MARKET ESTIMATES, BY DISTRIBUTION CHANNEL, 2020–2030 (USD MILLION) 165
      215. TABLE 215 UK AND IRELAND: MARKET ESTIMATES, BY DISTRIBUTION CHANNEL, 2020–2030 (KILOTONS) 165
      216. TABLE 216 FRANCE: MARKET ESTIMATES, BY PRODUCT, 2020–2030 (USD MILLION) 166
      217. TABLE 217 FRANCE: MARKET ESTIMATES, BY PRODUCT, 2020–2030 (KILOTONS) 166
      218. TABLE 218 FRANCE: MARKET ESTIMATES, BY FORM, 2020–2030 (USD MILLION) 166
      219. TABLE 219 FRANCE: MARKET ESTIMATES, BY FORM, 2020–2030 (KILOTONS) 167
      220. TABLE 220 FRANCE: MARKET ESTIMATES, BY CATEGORY, 2020–2030 (USD MILLION) 167
      221. TABLE 221 FRANCE: MARKET ESTIMATES, BY CATEGORY, 2020–2030 (KILOTONS) 167
      222. TABLE 222 FRANCE: MARKET ESTIMATES, BY APPLICATION, 2020–2030 (USD MILLION) 167
      223. TABLE 223 FRANCE: MARKET ESTIMATES, BY APPLICATION, 2020–2030 (KILOTONS) 168
      224. TABLE 224 FRANCE: MARKET ESTIMATES & FORECAST, BY CATEGORY IN APPLICATION, 2020–2030 (USD MILLION) 168
      225. TABLE 225 FRANCE: MARKET ESTIMATES & FORECAST, BY CATEGORY IN APPLICATION, 2020–2030 (KILOTONS) 169
      226. TABLE 226 FRANCE: MARKET ESTIMATES, BY END USER, 2020–2030 (USD MILLION) 169
      227. TABLE 227 FRANCE: MARKET ESTIMATES, BY END USER, 2020–2030 (KILOTONS) 170
      228. TABLE 228 FRANCE: MARKET ESTIMATES, BY DISTRIBUTION CHANNEL, 2020–2030 (USD MILLION) 170
      229. TABLE 229 FRANCE: MARKET ESTIMATES, BY DISTRIBUTION CHANNEL, 2020–2030 (KILOTONS) 170
      230. TABLE 230 BENELUX: MARKET ESTIMATES, BY PRODUCT, 2020–2030 (USD MILLION) 171
      231. TABLE 231 BENELUX: MARKET ESTIMATES, BY PRODUCT, 2020–2030 (KILOTONS) 171
      232. TABLE 232 BENELUX: MARKET ESTIMATES, BY FORM, 2020–2030 (USD MILLION) 171
      233. TABLE 233 BENELUX: MARKET ESTIMATES, BY FORM, 2020–2030 (KILOTONS) 172
      234. TABLE 234 BENELUX: MARKET ESTIMATES, BY CATEGORY, 2020–2030 (USD MILLION) 172
      235. TABLE 235 BENELUX: MARKET ESTIMATES, BY CATEGORY, 2020–2030 (KILOTONS) 172
      236. TABLE 236 BENELUX: MARKET ESTIMATES, BY APPLICATION, 2020–2030 (USD MILLION) 172
      237. TABLE 237 BENELUX: MARKET ESTIMATES, BY APPLICATION, 2020–2030 (KILOTONS) 173
      238. TABLE 238 BENELUX: MARKET ESTIMATES & FORECAST, BY CATEGORY IN APPLICATION, 2020–2030 (USD MILLION) 173
      239. TABLE 239 BENELUX: MARKET ESTIMATES & FORECAST, BY CATEGORY IN APPLICATION, 2020–2030 (KILOTONS) 174
      240. TABLE 240 BENELUX: MARKET ESTIMATES, BY END USER, 2020–2030 (USD MILLION) 174
      241. TABLE 241 BENELUX: MARKET ESTIMATES, BY END USER, 2020–2030 (KILOTONS) 175
      242. TABLE 242 BENELUX: MARKET ESTIMATES, BY DISTRIBUTION CHANNEL, 2020–2030 (USD MILLION) 175
      243. TABLE 243 BENELUX: MARKET ESTIMATES, BY DISTRIBUTION CHANNEL, 2020–2030 (KILOTONS) 175
      244. TABLE 244 NORDICS: MARKET ESTIMATES, BY PRODUCT, 2020–2030 (USD MILLION) 176
      245. TABLE 245 NORDICS: MARKET ESTIMATES, BY PRODUCT, 2020–2030 (KILOTONS) 176
      246. TABLE 246 NORDICS: MARKET ESTIMATES, BY FORM, 2020–2030 (USD MILLION) 176
      247. TABLE 247 NORDICS: MARKET ESTIMATES, BY FORM, 2020–2030 (KILOTONS) 177
      248. TABLE 248 NORDICS: MARKET ESTIMATES, BY CATEGORY, 2020–2030 (USD MILLION) 177
      249. TABLE 249 NORDICS: MARKET ESTIMATES, BY CATEGORY, 2020–2030 (KILOTONS) 177
      250. TABLE 250 NORDICS: MARKET ESTIMATES, BY APPLICATION, 2020–2030 (USD MILLION) 177
      251. TABLE 251 NORDICS: MARKET ESTIMATES, BY APPLICATION, 2020–2030 (KILOTONS) 178
      252. TABLE 252 NORDICS: MARKET ESTIMATES & FORECAST, BY CATEGORY IN APPLICATION, 2020–2030 (USD MILLION) 178
      253. TABLE 253 NORDICS: MARKET ESTIMATES & FORECAST, BY CATEGORY IN APPLICATION, 2020–2030 (KILOTONS) 179
      254. TABLE 254 NORDICS: MARKET ESTIMATES, BY END USER, 2020–2030 (USD MILLION) 179
      255. TABLE 255 NORDICS: MARKET ESTIMATES, BY END USER, 2020–2030 (KILOTONS) 180
      256. TABLE 256 NORDICS: MARKET ESTIMATES, BY DISTRIBUTION CHANNEL, 2020–2030 (USD MILLION) 180
      257. TABLE 257 NORDICS: MARKET ESTIMATES, BY DISTRIBUTION CHANNEL, 2020–2030 (KILOTONS) 180
      258. TABLE 258 CENTRAL AND EASTERN EUROPE: MARKET ESTIMATES, BY PRODUCT, 2020–2030 (USD MILLION) 181
      259. TABLE 259 CENTRAL AND EASTERN EUROPE: MARKET ESTIMATES, BY PRODUCT, 2020–2030 (KILOTONS) 181
      260. TABLE 260 CENTRAL AND EASTERN EUROPE: MARKET ESTIMATES, BY FORM, 2020–2030 (USD MILLION) 181
      261. TABLE 261 CENTRAL AND EASTERN EUROPE: MARKET ESTIMATES, BY FORM, 2020–2030 (KILOTONS) 182
      262. TABLE 262 CENTRAL AND EASTERN EUROPE: MARKET ESTIMATES, BY CATEGORY, 2020–2030 (USD MILLION) 182
      263. TABLE 263 CENTRAL AND EASTERN EUROPE: MARKET ESTIMATES, BY CATEGORY, 2020–2030 (KILOTONS) 182
      264. TABLE 264 CENTRAL AND EASTERN EUROPE: MARKET ESTIMATES, BY APPLICATION, 2020–2030 (USD MILLION) 182
      265. TABLE 265 CENTRAL AND EASTERN EUROPE: MARKET ESTIMATES, BY APPLICATION, 2020–2030 (KILOTONS) 183
      266. TABLE 266 CENTRAL & EASTERN EUROPE: MARKET ESTIMATES & FORECAST, BY CATEGORY IN APPLICATION, 2020–2030 (USD MILLION) 183
      267. TABLE 267 CENTRAL & EASTERN EUROPE: MARKET ESTIMATES & FORECAST, BY CATEGORY IN APPLICATION, 2020–2030 (KILOTONS) 184
      268. TABLE 268 CENTRAL AND EASTERN EUROPE: MARKET ESTIMATES, BY END USER, 2020–2030 (USD MILLION) 184
      269. TABLE 269 CENTRAL AND EASTERN EUROPE: MARKET ESTIMATES, BY END USER, 2020–2030 (KILOTONS) 185
      270. TABLE 270 CENTRAL AND EASTERN EUROPE: MARKET ESTIMATES, BY DISTRIBUTION CHANNEL, 2020–2030 (USD MILLION) 185
      271. TABLE 271 CENTRAL AND EASTERN EUROPE: MARKET ESTIMATES, BY DISTRIBUTION CHANNEL, 2020–2030 (KILOTONS) 185
      272. TABLE 272 SOUTHERN EUROPE: MARKET ESTIMATES, BY PRODUCT, 2020–2030 (USD MILLION) 186
      273. TABLE 273 SOUTHERN EUROPE: MARKET ESTIMATES, BY PRODUCT, 2020–2030 (KILOTONS) 186
      274. TABLE 274 SOUTHERN EUROPE: MARKET ESTIMATES, BY FORM, 2020–2030 (USD MILLION) 186
      275. TABLE 275 SOUTHERN EUROPE: MARKET ESTIMATES, BY FORM, 2020–2030 (KILOTONS) 187
      276. TABLE 276 SOUTHERN EUROPE: MARKET ESTIMATES, BY CATEGORY, 2020–2030 (USD MILLION) 187
      277. TABLE 277 SOUTHERN EUROPE: MARKET ESTIMATES, BY CATEGORY, 2020–2030 (KILOTONS) 187
      278. TABLE 278 SOUTHERN EUROPE: MARKET ESTIMATES, BY APPLICATION, 2020–2030 (USD MILLION) 187
      279. TABLE 279 SOUTHERN EUROPE: MARKET ESTIMATES, BY APPLICATION, 2020–2030 (KILOTONS) 188
      280. TABLE 280 SOUTHERN EUROPE: MARKET ESTIMATES & FORECAST, BY CATEGORY IN APPLICATION, 2020–2030 (USD MILLION) 188
      281. TABLE 281 SOUTHERN EUROPE: MARKET ESTIMATES & FORECAST, BY CATEGORY IN APPLICATION, 2020–2030 (KILOTONS) 189
      282. TABLE 282 SOUTHERN EUROPE: MARKET ESTIMATES, BY END USER, 2020–2030 (USD MILLION) 189
      283. TABLE 283 SOUTHERN EUROPE: MARKET ESTIMATES, BY END USER, 2020–2030 (KILOTONS) 190
      284. TABLE 284 SOUTHERN EUROPE: MARKET ESTIMATES, BY DISTRIBUTION CHANNEL, 2020–2030 (USD MILLION) 190
      285. TABLE 285 SOUTHERN EUROPE: MARKET ESTIMATES, BY DISTRIBUTION CHANNEL, 2020–2030 (KILOTONS) 190
      286. TABLE 286 ASIA-PACIFIC: MARKET ESTIMATES & FORECAST, BY COUNTRY, 2020–2030 (USD MILLION) 192
      287. TABLE 287 ASIA-PACIFIC: MARKET ESTIMATES & FORECAST, BY COUNTRY, 2020–2030 (KILOTONS) 192
      288. TABLE 288 ASIA-PACIFIC: MARKET ESTIMATES, BY PRODUCT, 2020–2030 (USD MILLION) 192
      289. TABLE 289 ASIA-PACIFIC: MARKET ESTIMATES, BY PRODUCT, 2020–2030 (KILOTONS) 193
      290. TABLE 290 ASIA-PACIFIC: MARKET ESTIMATES, BY FORM, 2020–2030 (USD MILLION) 193
      291. TABLE 291 ASIA-PACIFIC: MARKET ESTIMATES, BY FORM, 2020–2030 (KILOTONS) 193
      292. TABLE 292 ASIA-PACIFIC: MARKET ESTIMATES, BY CATEGORY, 2020–2030 (USD MILLION) 194
      293. TABLE 293 ASIA-PACIFIC: MARKET ESTIMATES, BY CATEGORY, 2020–2030 (KILOTONS) 194
      294. TABLE 294 ASIA-PACIFIC: MARKET ESTIMATES, BY APPLICATION, 2020–2030 (USD MILLION) 194
      295. TABLE 295 ASIA-PACIFIC: MARKET ESTIMATES, BY APPLICATION, 2020–2030 (KILOTONS) 195
      296. TABLE 296 ASIA PACIFIC: MARKET ESTIMATES & FORECAST, BY CATEGORY IN APPLICATION, 2020–2030 (USD MILLION) 195
      297. TABLE 297 ASIA PACIFIC: MARKET ESTIMATES & FORECAST, BY CATEGORY IN APPLICATION, 2020–2030 (KILOTONS) 196
      298. TABLE 298 ASIA-PACIFIC: MARKET ESTIMATES, BY END USER, 2020–2030 (USD MILLION) 197
      299. TABLE 299 ASIA-PACIFIC: MARKET ESTIMATES, BY END USER, 2020–2030 (KILOTONS) 197
      300. TABLE 300 ASIA-PACIFIC: MARKET ESTIMATES, BY DISTRIBUTION CHANNEL, 2020–2030 (USD MILLION) 197
      301. TABLE 301 ASIA-PACIFIC: MARKET ESTIMATES, BY DISTRIBUTION CHANNEL, 2020–2030 (KILOTONS) 197
      302. TABLE 302 CHINA: MARKET ESTIMATES, BY PRODUCT, 2020–2030 (USD MILLION) 198
      303. TABLE 303 CHINA: MARKET ESTIMATES, BY PRODUCT, 2020–2030 (KILOTONS) 198
      304. TABLE 304 CHINA: MARKET ESTIMATES, BY FORM, 2020–2030 (USD MILLION) 198
      305. TABLE 305 CHINA: MARKET ESTIMATES, BY FORM, 2020–2030 (KILOTONS) 199
      306. TABLE 306 CHINA: MARKET ESTIMATES, BY CATEGORY, 2020–2030 (USD MILLION) 199
      307. TABLE 307 CHINA: MARKET ESTIMATES, BY CATEGORY, 2020–2030 (KILOTONS) 199
      308. TABLE 308 CHINA: MARKET ESTIMATES, BY APPLICATION, 2020–2030 (USD MILLION) 199
      309. TABLE 309 CHINA: MARKET ESTIMATES, BY APPLICATION, 2020–2030 (KILOTONS) 200
      310. TABLE 310 CHINA: MARKET ESTIMATES & FORECAST, BY CATEGORY IN APPLICATION, 2020–2030 (USD MILLION) 200
      311. TABLE 311 CHINA: MARKET ESTIMATES & FORECAST, BY CATEGORY IN APPLICATION, 2020–2030 (KILOTONS) 201
      312. TABLE 312 CHINA: MARKET ESTIMATES, BY END USER, 2020–2030 (USD MILLION) 201
      313. TABLE 313 CHINA: MARKET ESTIMATES, BY END USER, 2020–2030 (KILOTONS) 202
      314. TABLE 314 CHINA: MARKET ESTIMATES, BY DISTRIBUTION CHANNEL, 2020–2030 (USD MILLION) 202
      315. TABLE 315 CHINA: MARKET ESTIMATES, BY DISTRIBUTION CHANNEL, 2020–2030 (KILOTONS) 202
      316. TABLE 316 JAPAN: MARKET ESTIMATES, BY PRODUCT, 2020–2030 (USD MILLION) 203
      317. TABLE 317 JAPAN: MARKET ESTIMATES, BY PRODUCT, 2020–2030 (KILOTONS) 203
      318. TABLE 318 JAPAN: MARKET ESTIMATES, BY FORM, 2020–2030 (USD MILLION) 203
      319. TABLE 319 JAPAN: MARKET ESTIMATES, BY FORM, 2020–2030 (KILOTONS) 204
      320. TABLE 320 JAPAN: MARKET ESTIMATES, BY CATEGORY, 2020–2030 (USD MILLION) 204
      321. TABLE 321 JAPAN: MARKET ESTIMATES, BY CATEGORY, 2020–2030 (KILOTONS) 204
      322. TABLE 322 JAPAN: MARKET ESTIMATES, BY APPLICATION, 2020–2030 (USD MILLION) 204
      323. TABLE 323 JAPAN: MARKET ESTIMATES, BY APPLICATION, 2020–2030 (KILOTONS) 205
      324. TABLE 324 JAPAN: MARKET ESTIMATES & FORECAST, BY CATEGORY IN APPLICATION, 2020–2030 (USD MILLION) 205
      325. TABLE 325 JAPAN: MARKET ESTIMATES & FORECAST, BY CATEGORY IN APPLICATION, 2020–2030 (KILOTONS) 206
      326. TABLE 326 JAPAN: MARKET ESTIMATES, BY END USER, 2020–2030 (USD MILLION) 206
      327. TABLE 327 JAPAN: MARKET ESTIMATES, BY END USER, 2020–2030 (KILOTONS) 207
      328. TABLE 328 JAPAN: MARKET ESTIMATES, BY DISTRIBUTION CHANNEL, 2020–2030 (USD MILLION) 207
      329. TABLE 329 JAPAN: MARKET ESTIMATES, BY DISTRIBUTION CHANNEL, 2020–2030 (KILOTONS) 207
      330. TABLE 330 INDIA: MARKET ESTIMATES, BY PRODUCT, 2020–2030 (USD MILLION) 208
      331. TABLE 331 INDIA: MARKET ESTIMATES, BY PRODUCT, 2020–2030 (KILOTONS) 208
      332. TABLE 332 INDIA: MARKET ESTIMATES, BY FORM, 2020–2030 (USD MILLION) 208
      333. TABLE 333 INDIA: MARKET ESTIMATES, BY FORM, 2020–2030 (KILOTONS) 209
      334. TABLE 334 INDIA: MARKET ESTIMATES, BY CATEGORY, 2020–2030 (USD MILLION) 209
      335. TABLE 335 INDIA: MARKET ESTIMATES, BY CATEGORY, 2020–2030 (KILOTONS) 209
      336. TABLE 336 INDIA: MARKET ESTIMATES, BY APPLICATION, 2020–2030 (USD MILLION) 209
      337. TABLE 337 INDIA: MARKET ESTIMATES, BY APPLICATION, 2020–2030 (KILOTONS) 210
      338. TABLE 338 INDIA: MARKET ESTIMATES & FORECAST, BY CATEGORY IN APPLICATION, 2020–2030 (USD MILLION) 210
      339. TABLE 339 INDIA: MARKET ESTIMATES & FORECAST, BY CATEGORY IN APPLICATION, 2020–2030 (KILOTONS) 211
      340. TABLE 340 INDIA: MARKET ESTIMATES, BY END USER, 2020–2030 (USD MILLION) 211
      341. TABLE 341 INDIA: MARKET ESTIMATES, BY END USER, 2020–2030 (KILOTONS) 212
      342. TABLE 342 INDIA: MARKET ESTIMATES, BY DISTRIBUTION CHANNEL, 2020–2030 (USD MILLION) 212
      343. TABLE 343 INDIA: MARKET ESTIMATES, BY DISTRIBUTION CHANNEL, 2020–2030 (KILOTONS) 212
      344. TABLE 344 AUSTRALIA AND NEW ZEALAND: MARKET ESTIMATES, BY PRODUCT, 2020–2030 (USD MILLION) 213
      345. TABLE 345 AUSTRALIA AND NEW ZEALAND: MARKET ESTIMATES, BY PRODUCT, 2020–2030 (KILOTONS) 213
      346. TABLE 346 AUSTRALIA AND NEW ZEALAND: MARKET ESTIMATES, BY FORM, 2020–2030 (USD MILLION) 213
      347. TABLE 347 AUSTRALIA AND NEW ZEALAND: MARKET ESTIMATES, BY FORM, 2020–2030 (KILOTONS) 214
      348. TABLE 348 AUSTRALIA AND NEW ZEALAND: MARKET ESTIMATES, BY CATEGORY, 2020–2030 (USD MILLION) 214
      349. TABLE 349 AUSTRALIA AND NEW ZEALAND: MARKET ESTIMATES, BY CATEGORY, 2020–2030 (KILOTONS) 214
      350. TABLE 350 AUSTRALIA AND NEW ZEALAND: MARKET ESTIMATES, BY APPLICATION, 2020–2030 (USD MILLION) 214
      351. TABLE 351 AUSTRALIA AND NEW ZEALAND: MARKET ESTIMATES, BY APPLICATION, 2020–2030 (KILOTONS) 215
      352. TABLE 352 AUSTRALIA & NEW ZEALAND: MARKET ESTIMATES & FORECAST, BY CATEGORY IN APPLICATION, 2020–2030 (USD MILLION) 215
      353. TABLE 353 AUSTRALIA & NEW ZEALAND: MARKET ESTIMATES & FORECAST, BY CATEGORY IN APPLICATION, 2020–2030 (KILOTONS) 216
      354. TABLE 354 AUSTRALIA AND NEW ZEALAND: MARKET ESTIMATES, BY END USER, 2020–2030 (USD MILLION) 216
      355. TABLE 355 AUSTRALIA AND NEW ZEALAND: MARKET ESTIMATES, BY END USER, 2020–2030 (KILOTONS) 217
      356. TABLE 356 AUSTRALIA AND NEW ZEALAND: MARKET ESTIMATES, BY DISTRIBUTION CHANNEL, 2020–2030 (USD MILLION) 217
      357. TABLE 357 AUSTRALIA AND NEW ZEALAND: MARKET ESTIMATES, BY DISTRIBUTION CHANNEL, 2020–2030 (KILOTONS) 217
      358. TABLE 358 REST OF ASIA-PACIFIC: MARKET ESTIMATES, BY PRODUCT, 2020–2030 (USD MILLION) 218
      359. TABLE 359 REST OF ASIA-PACIFIC: MARKET ESTIMATES, BY PRODUCT, 2020–2030 (KILOTONS) 218
      360. TABLE 360 REST OF ASIA-PACIFIC: MARKET ESTIMATES, BY FORM, 2020–2030 (USD MILLION) 218
      361. TABLE 361 REST OF ASIA-PACIFIC: MARKET ESTIMATES, BY FORM, 2020–2030 (KILOTONS) 219
      362. TABLE 362 REST OF ASIA-PACIFIC: MARKET ESTIMATES, BY CATEGORY, 2020–2030 (USD MILLION) 219
      363. TABLE 363 REST OF ASIA-PACIFIC: MARKET ESTIMATES, BY CATEGORY, 2020–2030 (KILOTONS) 219
      364. TABLE 364 REST OF ASIA-PACIFIC: MARKET ESTIMATES, BY APPLICATION, 2020–2030 (USD MILLION) 219
      365. TABLE 365 REST OF ASIA-PACIFIC: MARKET ESTIMATES, BY APPLICATION, 2020–2030 (KILOTONS) 220
      366. TABLE 366 REST OF ASIA PACIFIC: MARKET ESTIMATES & FORECAST, BY CATEGORY IN APPLICATION, 2020–2030 (USD MILLION) 220
      367. TABLE 367 REST OF ASIA PACIFIC: MARKET ESTIMATES & FORECAST, BY CATEGORY IN APPLICATION, 2020–2030 (KILOTONS) 221
      368. TABLE 368 REST OF ASIA-PACIFIC: MARKET ESTIMATES, BY END USER, 2020–2030 (USD MILLION) 221
      369. TABLE 369 REST OF ASIA-PACIFIC: MARKET ESTIMATES, BY END USER, 2020–2030 (KILOTONS) 222
      370. TABLE 370 REST OF ASIA-PACIFIC: MARKET ESTIMATES, BY DISTRIBUTION CHANNEL, 2020–2030 (USD MILLION) 222
      371. TABLE 371 REST OF ASIA-PACIFIC: MARKET ESTIMATES, BY DISTRIBUTION CHANNEL, 2020–2030 (KILOTONS) 222
      372. TABLE 372 REST OF THE WORLD: MARKET ESTIMATES & FORECAST, BY REGION, 2020–2030 (USD MILLION) 223
      373. TABLE 373 REST OF THE WORLD: MARKET ESTIMATES & FORECAST, BY REGION, 2020–2030 (KILOTONS) 224
      374. TABLE 374 REST OF THE WORLD: MARKET ESTIMATES, BY PRODUCT, 2020–2030 (USD MILLION) 224
      375. TABLE 375 REST OF THE WORLD: MARKET ESTIMATES, BY PRODUCT, 2020–2030 (KILOTONS) 224
      376. TABLE 376 REST OF THE WORLD: MARKET ESTIMATES, BY FORM, 2020–2030 (USD MILLION) 225
      377. TABLE 377 REST OF THE WORLD: MARKET ESTIMATES, BY FORM, 2020–2030 (KILOTONS) 225
      378. TABLE 378 REST OF THE WORLD: MARKET ESTIMATES, BY CATEGORY, 2020–2030 (USD MILLION) 225
      379. TABLE 379 REST OF THE WORLD: MARKET ESTIMATES, BY CATEGORY, 2020–2030 (KILOTONS) 225
      380. TABLE 380 REST OF THE WORLD: MARKET ESTIMATES, BY APPLICATION, 2020–2030 (USD MILLION) 226
      381. TABLE 381 REST OF THE WORLD: MARKET ESTIMATES, BY APPLICATION, 2020–2030 (KILOTONS) 226
      382. TABLE 382 REST OF THE WORLD: MARKET ESTIMATES & FORECAST, BY CATEGORY IN APPLICATION, 2020–2030 (USD MILLION) 227
      383. TABLE 383 REST OF THE WORLD: MARKET ESTIMATES & FORECAST, BY CATEGORY IN APPLICATION, 2020–2030 (KILOTONS) 228
      384. TABLE 384 REST OF THE WORLD: MARKET ESTIMATES, BY END USER, 2020–2030 (USD MILLION) 228
      385. TABLE 385 REST OF THE WORLD: MARKET ESTIMATES, BY END USER, 2020–2030 (KILOTONS) 229
      386. TABLE 386 REST OF THE WORLD: MARKET ESTIMATES, BY DISTRIBUTION CHANNEL, 2020–2030 (USD MILLION) 229
      387. TABLE 387 REST OF THE WORLD: MARKET ESTIMATES, BY DISTRIBUTION CHANNEL, 2020–2030 (KILOTONS) 229
      388. TABLE 388 SOUTH AMERICA: MARKET ESTIMATES, BY PRODUCT, 2020–2030 (USD MILLION) 230
      389. TABLE 389 SOUTH AMERICA: MARKET ESTIMATES, BY PRODUCT, 2020–2030 (KILOTONS) 230
      390. TABLE 390 SOUTH AMERICA: MARKET ESTIMATES, BY FORM, 2020–2030 (USD MILLION) 230
      391. TABLE 391 SOUTH AMERICA: MARKET ESTIMATES, BY FORM, 2020–2030 (KILOTONS) 231
      392. TABLE 392 SOUTH AMERICA: MARKET ESTIMATES, BY CATEGORY, 2020–2030 (USD MILLION) 231
      393. TABLE 393 SOUTH AMERICA: MARKET ESTIMATES, BY CATEGORY, 2020–2030 (KILOTONS) 231
      394. TABLE 394 SOUTH AMERICA: MARKET ESTIMATES, BY APPLICATION, 2020–2030 (USD MILLION) 231
      395. TABLE 395 SOUTH AMERICA: MARKET ESTIMATES, BY APPLICATION, 2020–2030 (KILOTONS) 232
      396. TABLE 396 SOUTH AMERICA: MARKET ESTIMATES & FORECAST, BY CATEGORY IN APPLICATION, 2020–2030 (USD MILLION) 232
      397. TABLE 397 SOUTH AMERICA: MARKET ESTIMATES & FORECAST, BY CATEGORY IN APPLICATION, 2020–2030 (KILOTONS) 233
      398. TABLE 398 SOUTH AMERICA: MARKET ESTIMATES, BY END USER, 2020–2030 (USD MILLION) 233
      399. TABLE 399 SOUTH AMERICA: MARKET ESTIMATES, BY END USER, 2020–2030 (KILOTONS) 234
      400. TABLE 400 SOUTH AMERICA: MARKET ESTIMATES, BY DISTRIBUTION CHANNEL, 2020–2030 (USD MILLION) 234
      401. TABLE 401 SOUTH AMERICA: MARKET ESTIMATES, BY DISTRIBUTION CHANNEL, 2020–2030 (KILOTONS) 234
      402. TABLE 402 MIDDLE EAST: MARKET ESTIMATES, BY PRODUCT, 2020–2030 (USD MILLION) 235
      403. TABLE 403 MIDDLE EAST: MARKET ESTIMATES, BY PRODUCT, 2020–2030 (KILOTONS) 235
      404. TABLE 404 MIDDLE EAST: MARKET ESTIMATES, BY FORM, 2020–2030 (USD MILLION) 235
      405. TABLE 405 MIDDLE EAST: MARKET ESTIMATES, BY FORM, 2020–2030 (KILOTONS) 236
      406. TABLE 406 MIDDLE EAST: MARKET ESTIMATES, BY CATEGORY, 2020–2030 (USD MILLION) 236
      407. TABLE 407 MIDDLE EAST: MARKET ESTIMATES, BY CATEGORY, 2020–2030 (KILOTONS) 236
      408. TABLE 408 MIDDLE EAST: MARKET ESTIMATES, BY APPLICATION, 2020–2030 (USD MILLION) 236
      409. TABLE 409 MIDDLE EAST: MARKET ESTIMATES, BY APPLICATION, 2020–2030 (KILOTONS) 237
      410. TABLE 410 MIDDLE EAST: MARKET ESTIMATES & FORECAST, BY CATEGORY IN APPLICATION, 2020–2030 (USD MILLION) 237
      411. TABLE 411 MIDDLE EAST: MARKET ESTIMATES & FORECAST, BY CATEGORY IN APPLICATION, 2020–2030 (KILOTONS) 238
      412. TABLE 412 MIDDLE EAST: MARKET ESTIMATES, BY END USER, 2020–2030 (USD MILLION) 238
      413. TABLE 413 MIDDLE EAST: MARKET ESTIMATES, BY END USER, 2020–2030 (KILOTONS) 239
      414. TABLE 414 MIDDLE EAST: MARKET ESTIMATES, BY DISTRIBUTION CHANNEL, 2020–2030 (USD MILLION) 239
      415. TABLE 415 MIDDLE EAST: MARKET ESTIMATES, BY DISTRIBUTION CHANNEL, 2020–2030 (KILOTONS) 239
      416. TABLE 416 AFRICA: MARKET ESTIMATES, BY PRODUCT, 2020–2030 (USD MILLION) 240
      417. TABLE 417 AFRICA: MARKET ESTIMATES, BY PRODUCT, 2020–2030 (KILOTONS) 240
      418. TABLE 418 AFRICA: MARKET ESTIMATES, BY FORM, 2020–2030 (USD MILLION) 240
      419. TABLE 419 AFRICA: MARKET ESTIMATES, BY FORM, 2020–2030 (KILOTONS) 241
      420. TABLE 420 AFRICA: MARKET ESTIMATES, BY CATEGORY, 2020–2030 (USD MILLION) 241
      421. TABLE 421 AFRICA: MARKET ESTIMATES, BY CATEGORY, 2020–2030 (KILOTONS) 241
      422. TABLE 422 AFRICA: MARKET ESTIMATES, BY APPLICATION, 2020–2030 (USD MILLION) 241
      423. TABLE 423 AFRICA: MARKET ESTIMATES, BY APPLICATION, 2020–2030 (KILOTONS) 242
      424. TABLE 424 AFRICA: MARKET ESTIMATES & FORECAST, BY CATEGORY IN APPLICATION, 2020–2030 (USD MILLION) 242
      425. TABLE 425 AFRICA: MARKET ESTIMATES & FORECAST, BY CATEGORY IN APPLICATION, 2020–2030 (KILOTONS) 243
      426. TABLE 426 AFRICA: MARKET ESTIMATES, BY END USER, 2020–2030 (USD MILLION) 243
      427. TABLE 427 AFRICA: MARKET ESTIMATES, BY END USER, 2020–2030 (KILOTONS) 244
      428. TABLE 428 AFRICA: MARKET ESTIMATES, BY DISTRIBUTION CHANNEL, 2020–2030 (USD MILLION) 244
      429. TABLE 429 AFRICA: MARKET ESTIMATES, BY DISTRIBUTION CHANNEL, 2020–2030 (KILOTONS) 244
      430. TABLE 430 PRODUCT LAUNCH 247
      431. TABLE 431 ACQUISITION 247
      432. TABLE 432 INVESTMENT 248
      433. TABLE 433 EXPANSION 248
      434. TABLE 434 MERGER 249
      435. TABLE 435 AGREEMENT 249
      436. TABLE 436 PARTNERSHIP 249
      437. TABLE 437 TATE & LYLE: PRODUCTS OFFERED 252
      438. TABLE 438 TATE & LYLE: KEY DEVELOPMENTS 252
      439. TABLE 439 CARGILL INCORPORATED.: PRODUCTS OFFERED 255
      440. TABLE 440 CARGILL INCORPORATED.: KEY DEVELOPMENTS 255
      441. TABLE 441 INTERNATIONAL FLAVORS & FRAGRANCES INC.: PRODUCTS OFFERED 258
      442. TABLE 442 INTERNATIONAL FLAVORS & FRAGRANCES INC.: KEY DEVELOPMENTS 259
      443. TABLE 443 ARCHER-DANIELS-MIDLAND COMPANY (ADM): PRODUCTS OFFERED 263
      444. TABLE 444 ARCHER-DANIELS-MIDLAND COMPANY (ADM): KEY DEVELOPMENTS 263
      445. TABLE 445 INGREDION INCORPORATED: PRODUCTS OFFERED 266
      446. TABLE 446 INGREDION INCORPORATED: KEY DEVELOPMENTS 267
      447. TABLE 447 AJINOMOTO CO., INC.: PRODUCTS OFFERED 270
      448. TABLE 448 AJINOMOTO CO., INC.: KEY DEVELOPMENTS 271
      449. TABLE 449 HYET SWEET: PRODUCTS OFFERED 272
      450. TABLE 450 HERMES SWEETENERS LTD: PRODUCTS OFFERED 274
      451. TABLE 451 JK SUCRALOSE INC.: PRODUCTS OFFERED 276
      452. TABLE 452 HEARTLAND FOOD PRODUCTS GROUP: PRODUCTS OFFERED 278
    19. List of Tables and Figures
      1. FIGURE 1 MARKET SYNOPSIS 28
      2. FIGURE 2 GLOBAL HIGH-INTENSITY SWEETENERS MARKET ANALYSIS BY PRODUCT 29
      3. FIGURE 3 GLOBAL HIGH-INTENSITY SWEETENERS MARKET ANALYSIS BY FORM 30
      4. FIGURE 4 GLOBAL HIGH-INTENSITY SWEETENERS MARKET ANALYSIS BY CATEGORY 31
      5. FIGURE 5 GLOBAL HIGH-INTENSITY SWEETENERS MARKET ANALYSIS BY APPLICATION 32
      6. FIGURE 6 GLOBAL HIGH-INTENSITY SWEETENERS MARKET ANALYSIS BY END USER 33
      7. FIGURE 7 GLOBAL HIGH-INTENSITY SWEETENERS MARKET ANALYSIS BY DISTRIBUTION CHANNEL 34
      8. FIGURE 8 GLOBAL HIGH-INTENSITY SWEETENERS MARKET ANALYSIS BY REGION 35
      9. FIGURE 9 GLOBAL HIGH-INTENSITY SWEETENERS MARKET: STRUCTURE 37
      10. FIGURE 10 RESEARCH PROCESS 38
      11. FIGURE 11 TOP-DOWN & BOTTOM-UP APPROACHES 41
      12. FIGURE 12 MARKET DYNAMIC ANALYSIS OF THE GLOBAL HIGH-INTENSITY SWEETENERS MARKET 44
      13. FIGURE 13 VALUE CHAIN: GLOBAL HIGH-INTENSITY SWEETENERS MARKET 53
      14. FIGURE 14 GLOBAL HIGH-INTENSITY SWEETENERS FOOD MARKET: SUPPLY CHAIN ANALYSIS 56
      15. FIGURE 15 PORTER'S FIVE FORCES ANALYSIS OF THE GLOBAL HIGH-INTENSITY SWEETENERS MARKET 58
      16. FIGURE 16 GLOBAL HIGH-INTENSITY SWEETENERS DEMAND, BY REGION, 2020-2030 (KILOTONS) 64
      17. FIGURE 17 GLOBAL HIGH-INTENSITY SWEETENERS PRODUCTION ANALYSIS, BY REGION, 2021 65
      18. FIGURE 18 GLOBAL HIGH-INTENSITY SWEETENERS MARKET, BY PRODUCT, 2021 (% SHARE) 70
      19. FIGURE 19 GLOBAL HIGH-INTENSITY SWEETENERS MARKET, BY PRODUCT, 2020–2030 (USD MILLION) 70
      20. FIGURE 20 GLOBAL HIGH-INTENSITY SWEETENERS MARKET, BY FORM, 2021 (% SHARE) 80
      21. FIGURE 21 GLOBAL HIGH-INTENSITY SWEETENERS MARKET, BY FORM, 2020–2030 (USD MILLION) 80
      22. FIGURE 22 GLOBAL HIGH-INTENSITY SWEETENERS MARKET, BY CATEGORY, 2021 (% SHARE) 84
      23. FIGURE 23 GLOBAL HIGH-INTENSITY SWEETENERS MARKET, BY CATEGORY, 2020–2030 (USD MILLION) 84
      24. FIGURE 24 GLOBAL HIGH-INTENSITY SWEETENERS MARKET, BY APPLICATION, 2021 (% SHARE) 88
      25. FIGURE 25 GLOBAL HIGH-INTENSITY SWEETENERS MARKET, BY APPLICATION, 2020–2030 (USD MILLION) 88
      26. FIGURE 26 GLOBAL HIGH-INTENSITY SWEETENERS MARKET, BY END USER, 2021 (% SHARE) 98
      27. FIGURE 27 GLOBAL HIGH-INTENSITY SWEETENERS MARKET, BY END USER, 2020–2030 (USD MILLION) 98
      28. FIGURE 28 GLOBAL HIGH-INTENSITY SWEETENERS MARKET, BY DISTRIBUTION CHANNEL, 2021 (% SHARE) 101
      29. FIGURE 29 GLOBAL HIGH-INTENSITY SWEETENERS MARKET, BY DISTRIBUTION CHANNEL, 2020–2030 (USD MILLION) 102
      30. FIGURE 30 GLOBAL HIGH-INTENSITY SWEETENERS MARKET, BY REGION, 2021 (% SHARE) 109
      31. FIGURE 31 GLOBAL HIGH-INTENSITY SWEETENERS MARKET, BY REGION, 2020–2030 (USD MILLION) 109
      32. FIGURE 32 NORTH AMERICA: HIGH-INTENSITY SWEETENERS MARKET SHARE, BY COUNTRY, 2021 (% SHARE) 111
      33. FIGURE 33 EUROPE: HIGH-INTENSITY SWEETENERS MARKET SHARE, BY COUNTRY, 2021 (% SHARE) 133
      34. FIGURE 34 ASIA-PACIFIC: HIGH-INTENSITY SWEETENERS MARKET SHARE, BY COUNTRY, 2021 (% SHARE) 191
      35. FIGURE 35 REST OF THE WORLD: HIGH-INTENSITY SWEETENERS MARKET SHARE, BY COUNTRY, 2021 (% SHARE) 223
      36. FIGURE 36 TATE & LYLE: FINANCIAL OVERVIEW SNAPSHOT 251
      37. FIGURE 37 TATE & LYLE: SWOT ANALYSIS 253
      38. FIGURE 38 CARGILL INCORPORATED.: FINANCIAL OVERVIEW 255
      39. FIGURE 39 CARGILL INCORPORATED: SWOT ANALYSIS 256
      40. FIGURE 40 INTERNATIONAL FLAVORS & FRAGRANCES INC.: FINANCIAL OVERVIEW SNAPSHOT 258
      41. FIGURE 41 INTERNATIONAL FLAVORS & FRAGRANCES INC.: SWOT ANALYSIS 259
      42. FIGURE 42 ARCHER-DANIELS-MIDLAND COMPANY (ADM): FINANCIAL OVERVIEW SNAPSHOT 262
      43. FIGURE 43 ARCHER-DANIELS-MIDLAND COMPANY (ADM): SWOT ANALYSIS 264
      44. FIGURE 44 INGREDION INCORPORATED: FINANCIAL OVERVIEW SNAPSHOT 266
      45. FIGURE 45 INGREDION INCORPORATED: SWOT ANALYSIS 268
      46. FIGURE 46 AJINOMOTO CO., INC.: FINANCIAL OVERVIEW SNAPSHOT 270

    High-Intensity Sweeteners Market Segmentation

    High-Intensity Sweeteners Product Outlook (USD Million, 2019-2030)

    • Sucralose
    • Stevioside
    • Acesulfame K
    • Aspartame
    • Cyclamate
    • Glycyrrhizin
    • Saccharin
    • Others

    High-Intensity Sweeteners Form Outlook (USD Million, 2019-2030)

    • Dry
    • Liquid

    High-Intensity Sweeteners Category Outlook (USD Million, 2019-2030)

    • Artificial
    • Natural

    High-Intensity Sweeteners Application Outlook (USD Million, 2019-2030)

    • Bakery & Confectionery
    • Beverages
    • Dairy Products
    • Dietary Products
    • Pharmaceuticals
    • Tabletop Sweeteners
    • Processed Foods
    • Other

    High-Intensity Sweeteners End User Outlook (USD Million, 2019-2030)

    • Residential
    • Commercial

    High-Intensity Sweeteners Distribution Channel Outlook (USD Million, 2019-2030)

    • Supermarkets & Hypermarkets
    • Specialty Stores
    • Online
    • Others

    High-Intensity Sweeteners Regional Outlook (USD Million, 2019-2030)

    North America Outlook (USD Million, 2019-2030)

    • North America High-Intensity Sweeteners by Product
      • Sucralose
      • Stevioside
      • Acesulfame K
      • Aspartame
      • Cyclamate
      • Glycyrrhizin
      • Saccharin
      • Others
    • North America High-Intensity Sweeteners by Form
      • Dry
      • Liquid
    • North America High-Intensity Sweeteners by Category
      • Artificial
      • Natural
    • North America High-Intensity Sweeteners by Application
      • Bakery & Confectionery
      • Beverages
      • Dairy Products
      • Dietary Products
      • Pharmaceuticals
      • Tabletop Sweeteners
      • Processed Foods
      • Other
    • North America High-Intensity Sweeteners by End User
      • Residential
      • Commercial
    • North America High-Intensity Sweeteners by Distribution Channel
      • Supermarkets & Hypermarkets
      • Specialty Stores
      • Online
      • Others
    • US Outlook (USD Million, 2019-2030)
    • US High-Intensity Sweeteners by Product
      • Sucralose
      • Stevioside
      • Acesulfame K
      • Aspartame
      • Cyclamate
      • Glycyrrhizin
      • Saccharin
      • Others
    • US High-Intensity Sweeteners by Form
      • Dry
      • Liquid
    • US High-Intensity Sweeteners by Category
      • Artificial
      • Natural
    • US High-Intensity Sweeteners by Application
      • Bakery & Confectionery
      • Beverages
      • Dairy Products
      • Dietary Products
      • Pharmaceuticals
      • Tabletop Sweeteners
      • Processed Foods
      • Other
    • US High-Intensity Sweeteners by End User
      • Residential
      • Commercial
    • US High-Intensity Sweeteners by Distribution Channel
      • Supermarkets & Hypermarkets
      • Specialty Stores
      • Online
      • Others
    • Canada Outlook (USD Million, 2019-2030)
    • Canada High-Intensity Sweeteners by Product
      • Sucralose
      • Stevioside
      • Acesulfame K
      • Aspartame
      • Cyclamate
      • Glycyrrhizin
      • Saccharin
      • Others
    • Canada High-Intensity Sweeteners by Form
      • Dry
      • Liquid
    • Canada High-Intensity Sweeteners by Category
      • Artificial
      • Natural
    • Canada High-Intensity Sweeteners by Application
      • Bakery & Confectionery
      • Beverages
      • Dairy Products
      • Dietary Products
      • Pharmaceuticals
      • Tabletop Sweeteners
      • Processed Foods
      • Other
    • Canada High-Intensity Sweeteners by End User
      • Residential
      • Commercial
    • Canada High-Intensity Sweeteners by Distribution Channel
      • Supermarkets & Hypermarkets
      • Specialty Stores
      • Online
      • Others
    • Mexico Outlook (USD Million, 2019-2030)
    • Mexico High-Intensity Sweeteners by Product
      • Sucralose
      • Stevioside
      • Acesulfame K
      • Aspartame
      • Cyclamate
      • Glycyrrhizin
      • Saccharin
      • Others
    • Mexico High-Intensity Sweeteners by Form
      • Dry
      • Liquid
    • Mexico High-Intensity Sweeteners by Category
      • Artificial
      • Natural
    • Mexico High-Intensity Sweeteners by Application
      • Bakery & Confectionery
      • Beverages
      • Dairy Products
      • Dietary Products
      • Pharmaceuticals
      • Tabletop Sweeteners
      • Processed Foods
      • Other
    • Mexico High-Intensity Sweeteners by End User
      • Residential
      • Commercial
    • Mexico High-Intensity Sweeteners by Distribution Channel
      • Supermarkets & Hypermarkets
      • Specialty Stores
      • Online
      • Others

    Europe Outlook (USD Million, 2019-2030)

    • Europe High-Intensity Sweeteners by Product
      • Sucralose
      • Stevioside
      • Acesulfame K
      • Aspartame
      • Cyclamate
      • Glycyrrhizin
      • Saccharin
      • Others
    • Europe High-Intensity Sweeteners by Form
      • Dry
      • Liquid
    • Europe High-Intensity Sweeteners by Category
      • Artificial
      • Natural
    • Europe High-Intensity Sweeteners by Application
      • Bakery & Confectionery
      • Beverages
      • Dairy Products
      • Dietary Products
      • Pharmaceuticals
      • Tabletop Sweeteners
      • Processed Foods
      • Other
    • Europe High-Intensity Sweeteners by End User
      • Residential
      • Commercial
    • Europe High-Intensity Sweeteners by Distribution Channel
      • Supermarkets & Hypermarkets
      • Specialty Stores
      • Online
      • Others
    • Germany Outlook (USD Million, 2019-2030)
    • Germany High-Intensity Sweeteners by Product
      • Sucralose
      • Stevioside
      • Acesulfame K
      • Aspartame
      • Cyclamate
      • Glycyrrhizin
      • Saccharin
      • Others
    • Germany High-Intensity Sweeteners by Form
      • Dry
      • Liquid
    • Germany High-Intensity Sweeteners by Category
      • Artificial
      • Natural
    • Germany High-Intensity Sweeteners by Application
      • Bakery & Confectionery
      • Beverages
      • Dairy Products
      • Dietary Products
      • Pharmaceuticals
      • Tabletop Sweeteners
      • Processed Foods
      • Other
    • Germany High-Intensity Sweeteners by End User
      • Residential
      • Commercial
    • Germany High-Intensity Sweeteners by Distribution Channel
      • Supermarkets & Hypermarkets
      • Specialty Stores
      • Online
      • Others
    • Italy Outlook (USD Million, 2019-2030)
    • Italy High-Intensity Sweeteners by Product
      • Sucralose
      • Stevioside
      • Acesulfame K
      • Aspartame
      • Cyclamate
      • Glycyrrhizin
      • Saccharin
      • Others
    • Italy High-Intensity Sweeteners by Form
      • Dry
      • Liquid
    • Italy High-Intensity Sweeteners by Category
      • Artificial
      • Natural
    • Italy High-Intensity Sweeteners by Application
      • Bakery & Confectionery
      • Beverages
      • Dairy Products
      • Dietary Products
      • Pharmaceuticals
      • Tabletop Sweeteners
      • Processed Foods
      • Other
    • Italy High-Intensity Sweeteners by End User
      • Residential
      • Commercial
    • Italy High-Intensity Sweeteners by Distribution Channel
      • Supermarkets & Hypermarkets
      • Specialty Stores
      • Online
      • Others
    • Spain and Portugal Outlook (USD Million, 2019-2030)
    • Spain and Portugal High-Intensity Sweeteners by Product
      • Sucralose
      • Stevioside
      • Acesulfame K
      • Aspartame
      • Cyclamate
      • Glycyrrhizin
      • Saccharin
      • Others
    • Spain and Portugal High-Intensity Sweeteners by Form
      • Dry
      • Liquid
    • Spain and Portugal High-Intensity Sweeteners by Category
      • Artificial
      • Natural
    • Spain and Portugal High-Intensity Sweeteners by Application
      • Bakery & Confectionery
      • Beverages
      • Dairy Products
      • Dietary Products
      • Pharmaceuticals
      • Tabletop Sweeteners
      • Processed Foods
      • Other
    • Spain and Portugal High-Intensity Sweeteners by End User
      • Residential
      • Commercial
    • Spain and Portugal High-Intensity Sweeteners by Distribution Channel
      • Supermarkets & Hypermarkets
      • Specialty Stores
      • Online
      • Others
    • Austria and Switzerland Outlook (USD Million, 2019-2030)
    • Austria and Switzerland High-Intensity Sweeteners by Product
      • Sucralose
      • Stevioside
      • Acesulfame K
      • Aspartame
      • Cyclamate
      • Glycyrrhizin
      • Saccharin
      • Others
    • Austria and Switzerland High-Intensity Sweeteners by Form
      • Dry
      • Liquid
    • Austria and Switzerland High-Intensity Sweeteners by Category
      • Artificial
      • Natural
    • Austria and Switzerland High-Intensity Sweeteners by Application
      • Bakery & Confectionery
      • Beverages
      • Dairy Products
      • Dietary Products
      • Pharmaceuticals
      • Tabletop Sweeteners
      • Processed Foods
      • Other
    • Austria and Switzerland High-Intensity Sweeteners by End User
      • Residential
      • Commercial
    • Austria and Switzerland High-Intensity Sweeteners by Distribution Channel
      • Supermarkets & Hypermarkets
      • Specialty Stores
      • Online
      • Others
    • UK and Ireland Outlook (USD Million, 2019-2030)
    • UK & Ireland High-Intensity Sweeteners by Product
      • Sucralose
      • Stevioside
      • Acesulfame K
      • Aspartame
      • Cyclamate
      • Glycyrrhizin
      • Saccharin
      • Others
    • UK & Ireland High-Intensity Sweeteners by Form
      • Dry
      • Liquid
    • UK & Ireland High-Intensity Sweeteners by Category
      • Artificial
      • Natural
    • UK & Ireland High-Intensity Sweeteners by Application
      • Bakery & Confectionery
      • Beverages
      • Dairy Products
      • Dietary Products
      • Pharmaceuticals
      • Tabletop Sweeteners
      • Processed Foods
      • Other
    • UK & Ireland High-Intensity Sweeteners by End User
      • Residential
      • Commercial
    • UK & Ireland High-Intensity Sweeteners by Distribution Channel
      • Supermarkets & Hypermarkets
      • Specialty Stores
      • Online
      • Others
    • France Outlook (USD Million, 2019-2030)
    • France High-Intensity Sweeteners by Product
      • Sucralose
      • Stevioside
      • Acesulfame K
      • Aspartame
      • Cyclamate
      • Glycyrrhizin
      • Saccharin
      • Others
    • France High-Intensity Sweeteners by Form
      • Dry
      • Liquid
    • France High-Intensity Sweeteners by Category
      • Artificial
      • Natural
    • France High-Intensity Sweeteners by Application
      • Bakery & Confectionery
      • Beverages
      • Dairy Products
      • Dietary Products
      • Pharmaceuticals
      • Tabletop Sweeteners
      • Processed Foods
      • Other
    • France High-Intensity Sweeteners by End User
      • Residential
      • Commercial
    • France High-Intensity Sweeteners by Distribution Channel
      • Supermarkets & Hypermarkets
      • Specialty Stores
      • Online
      • Others
    • Benelux Outlook (USD Million, 2019-2030)
    • Benelux High-Intensity Sweeteners by Product
      • Sucralose
      • Stevioside
      • Acesulfame K
      • Aspartame
      • Cyclamate
      • Glycyrrhizin
      • Saccharin
      • Others
    • Benelux High-Intensity Sweeteners by Form
      • Dry
      • Liquid
    • Benelux High-Intensity Sweeteners by Category
      • Artificial
      • Natural
    • Benelux High-Intensity Sweeteners by Application
      • Bakery & Confectionery
      • Beverages
      • Dairy Products
      • Dietary Products
      • Pharmaceuticals
      • Tabletop Sweeteners
      • Processed Foods
      • Other
    • Benelux High-Intensity Sweeteners by End User
      • Residential
      • Commercial
    • Benelux High-Intensity Sweeteners by Distribution Channel
      • Supermarkets & Hypermarkets
      • Specialty Stores
      • Online
      • Others
    • Nordics Outlook (USD Million, 2019-2030)
    • Nordics High-Intensity Sweeteners by Product
      • Sucralose
      • Stevioside
      • Acesulfame K
      • Aspartame
      • Cyclamate
      • Glycyrrhizin
      • Saccharin
      • Others
    • Nordics High-Intensity Sweeteners by Form
      • Dry
      • Liquid
    • Nordics High-Intensity Sweeteners by Category
      • Artificial
      • Natural
    • Nordics High-Intensity Sweeteners by Application
      • Bakery & Confectionery
      • Beverages
      • Dairy Products
      • Dietary Products
      • Pharmaceuticals
      • Tabletop Sweeteners
      • Processed Foods
      • Other
    • Nordics High-Intensity Sweeteners by End User
      • Residential
      • Commercial
    • Nordics High-Intensity Sweeteners by Distribution Channel
      • Supermarkets & Hypermarkets
      • Specialty Stores
      • Online
      • Others
    • Central & Eastern Europe Outlook (USD Million, 2019-2030)
    • Central & Eastern Europe High-Intensity Sweeteners by Product
      • Sucralose
      • Stevioside
      • Acesulfame K
      • Aspartame
      • Cyclamate
      • Glycyrrhizin
      • Saccharin
      • Others
    • Central & Eastern Europe High-Intensity Sweeteners by Form
      • Dry
      • Liquid
    • Central & Eastern Europe High-Intensity Sweeteners by Category
      • Artificial
      • Natural
    • Central & Eastern Europe High-Intensity Sweeteners by Application
      • Bakery & Confectionery
      • Beverages
      • Dairy Products
      • Dietary Products
      • Pharmaceuticals
      • Tabletop Sweeteners
      • Processed Foods
      • Other
    • Central & Eastern Europe High-Intensity Sweeteners by End User
      • Residential
      • Commercial
    • Central & Eastern Europe High-Intensity Sweeteners by Distribution Channel
      • Supermarkets & Hypermarkets
      • Specialty Stores
      • Online
      • Others
    • Southern Europe Outlook (USD Million, 2019-2030)
    • Southern Europe High-Intensity Sweeteners by Product
      • Sucralose
      • Stevioside
      • Acesulfame K
      • Aspartame
      • Cyclamate
      • Glycyrrhizin
      • Saccharin
      • Others
    • Southern Europe High-Intensity Sweeteners by Form
      • Dry
      • Liquid
    • Southern Europe High-Intensity Sweeteners by Category
      • Artificial
      • Natural
    • Southern Europe High-Intensity Sweeteners by Application
      • Bakery & Confectionery
      • Beverages
      • Dairy Products
      • Dietary Products
      • Pharmaceuticals
      • Tabletop Sweeteners
      • Processed Foods
      • Other
    • Southern Europe High-Intensity Sweeteners by End User
      • Residential
      • Commercial
    • Southern Europe High-Intensity Sweeteners by Distribution Channel
      • Supermarkets & Hypermarkets
      • Specialty Stores
      • Online
      • Others

    Asia-Pacific Outlook (USD Million, 2019-2030)

    • Asia-Pacific High-Intensity Sweeteners by Product
      • Sucralose
      • Stevioside
      • Acesulfame K
      • Aspartame
      • Cyclamate
      • Glycyrrhizin
      • Saccharin
      • Others
    • Asia-Pacific High-Intensity Sweeteners by Form
      • Dry
      • Liquid
    • Asia-Pacific High-Intensity Sweeteners by Category
      • Artificial
      • Natural
    • Asia-Pacific High-Intensity Sweeteners by Application
      • Bakery & Confectionery
      • Beverages
      • Dairy Products
      • Dietary Products
      • Pharmaceuticals
      • Tabletop Sweeteners
      • Processed Foods
      • Other
    • Asia-Pacific High-Intensity Sweeteners by End User
      • Residential
      • Commercial
    • Asia-Pacific High-Intensity Sweeteners by Distribution Channel
      • Supermarkets & Hypermarkets
      • Specialty Stores
      • Online
      • Others
    • China Outlook (USD Million, 2019-2030)
    • China High-Intensity Sweeteners by Product
      • Sucralose
      • Stevioside
      • Acesulfame K
      • Aspartame
      • Cyclamate
      • Glycyrrhizin
      • Saccharin
      • Others
    • China High-Intensity Sweeteners by Form
      • Dry
      • Liquid
    • China High-Intensity Sweeteners by Category
      • Artificial
      • Natural
    • China High-Intensity Sweeteners by Application
      • Bakery & Confectionery
      • Beverages
      • Dairy Products
      • Dietary Products
      • Pharmaceuticals
      • Tabletop Sweeteners
      • Processed Foods
      • Other
    • China High-Intensity Sweeteners by End User
      • Residential
      • Commercial
    • China High-Intensity Sweeteners by Distribution Channel
      • Supermarkets & Hypermarkets
      • Specialty Stores
      • Online
      • Others
    • Japan Outlook (USD Million, 2019-2030)
    • Japan High-Intensity Sweeteners by Product
      • Sucralose
      • Stevioside
      • Acesulfame K
      • Aspartame
      • Cyclamate
      • Glycyrrhizin
      • Saccharin
      • Others
    • Japan High-Intensity Sweeteners by Form
      • Dry
      • Liquid
    • Japan High-Intensity Sweeteners by Category
      • Artificial
      • Natural
    • Japan High-Intensity Sweeteners by Application
      • Bakery & Confectionery
      • Beverages
      • Dairy Products
      • Dietary Products
      • Pharmaceuticals
      • Tabletop Sweeteners
      • Processed Foods
      • Other
    • Japan High-Intensity Sweeteners by End User
      • Residential
      • Commercial
    • Japan High-Intensity Sweeteners by Distribution Channel
      • Supermarkets & Hypermarkets
      • Specialty Stores
      • Online
      • Others
    • India Outlook (USD Million, 2019-2030)
    • India High-Intensity Sweeteners by Product
      • Sucralose
      • Stevioside
      • Acesulfame K
      • Aspartame
      • Cyclamate
      • Glycyrrhizin
      • Saccharin
      • Others
    • India High-Intensity Sweeteners by Form
      • Dry
      • Liquid
    • India High-Intensity Sweeteners by Category
      • Artificial
      • Natural
    • India High-Intensity Sweeteners by Application
      • Bakery & Confectionery
      • Beverages
      • Dairy Products
      • Dietary Products
      • Pharmaceuticals
      • Tabletop Sweeteners
      • Processed Foods
      • Other
    • India High-Intensity Sweeteners by End User
      • Residential
      • Commercial
    • India High-Intensity Sweeteners by Distribution Channel
      • Supermarkets & Hypermarkets
      • Specialty Stores
      • Online
      • Others
    • Australia & New Zealand Outlook (USD Million, 2019-2030)
    • Australia & New Zealand High-Intensity Sweeteners by Product
      • Sucralose
      • Stevioside
      • Acesulfame K
      • Aspartame
      • Cyclamate
      • Glycyrrhizin
      • Saccharin
      • Others
    • Australia & New Zealand High-Intensity Sweeteners by Form
      • Dry
      • Liquid
    • Australia & New Zealand High-Intensity Sweeteners by Category
      • Artificial
      • Natural
    • Australia & New Zealand High-Intensity Sweeteners by Application
      • Bakery & Confectionery
      • Beverages
      • Dairy Products
      • Dietary Products
      • Pharmaceuticals
      • Tabletop Sweeteners
      • Processed Foods
      • Other
    • Australia & New Zealand High-Intensity Sweeteners by End User
      • Residential
      • Commercial
    • Australia & New Zealand High-Intensity Sweeteners by Distribution Channel
      • Supermarkets & Hypermarkets
      • Specialty Stores
      • Online
      • Others
    • Rest of Asia-Pacific Outlook (USD Million, 2019-2030)
    • Rest of Asia-Pacific High-Intensity Sweeteners by Product
      • Sucralose
      • Stevioside
      • Acesulfame K
      • Aspartame
      • Cyclamate
      • Glycyrrhizin
      • Saccharin
      • Others
    • Rest of Asia-Pacific High-Intensity Sweeteners by Form
      • Dry
      • Liquid
    • Rest of Asia-Pacific High-Intensity Sweeteners by Category
      • Artificial
      • Natural
    • Rest of Asia-Pacific High-Intensity Sweeteners by Application
      • Bakery & Confectionery
      • Beverages
      • Dairy Products
      • Dietary Products
      • Pharmaceuticals
      • Tabletop Sweeteners
      • Processed Foods
      • Other
    • Rest of Asia-Pacific High-Intensity Sweeteners by End User
      • Residential
      • Commercial
    • Rest of Asia-Pacific High-Intensity Sweeteners by Distribution Channel
      • Supermarkets & Hypermarkets
      • Specialty Stores
      • Online
      • Others

    Rest of the World Outlook (USD Million, 2019-2030)

    Rest of the World High-Intensity Sweeteners by Product

    • Sucralose
    • Stevioside
    • Acesulfame K
    • Aspartame
    • Cyclamate
    • Glycyrrhizin
    • Saccharin
    • Others

    Rest of the World High-Intensity Sweeteners by Form

    • Dry
    • Liquid
    Rest of the World High-Intensity Sweeteners by Category
    • Artificial
    • Natural
    Rest of the World High-Intensity Sweeteners by Application
    • Bakery & Confectionery
    • Beverages
    • Dairy Products
    • Dietary Products
    • Pharmaceuticals
    • Tabletop Sweeteners
    • Processed Foods
    • Other
    Rest of the World High-Intensity Sweeteners by End User
    • Residential
    • Commercial
    Rest of the World High-Intensity Sweeteners by Distribution Channel
    • Supermarkets & Hypermarkets
    • Specialty Stores
    • Online
    • Others

    South America Outlook (USD Million, 2019-2030)

    South America High-Intensity Sweeteners by Product

    • Sucralose
    • Stevioside
    • Acesulfame K
    • Aspartame
    • Cyclamate
    • Glycyrrhizin
    • Saccharin
    • Others

    South America High-Intensity Sweeteners by Form

    • Dry
    • Liquid
    South America High-Intensity Sweeteners by Category
    • Artificial
    • Natural
    South America High-Intensity Sweeteners by Application
    • Bakery & Confectionery
    • Beverages
    • Dairy Products
    • Dietary Products
    • Pharmaceuticals
    • Tabletop Sweeteners
    • Processed Foods
    • Other
    South America High-Intensity Sweeteners by End User
    • Residential
    • Commercial
    South America High-Intensity Sweeteners by Distribution Channel
    • Supermarkets & Hypermarkets
    • Specialty Stores
    • Online
    • Others

    Middle East Outlook (USD Million, 2019-2030)

    Middle East High-Intensity Sweeteners by Product

    • Sucralose
    • Stevioside
    • Acesulfame K
    • Aspartame
    • Cyclamate
    • Glycyrrhizin
    • Saccharin
    • Others

    Middle East High-Intensity Sweeteners by Form

    • Dry
    • Liquid
    Middle East High-Intensity Sweeteners by Category
    • Artificial
    • Natural
    Middle East High-Intensity Sweeteners by Application
    • Bakery & Confectionery
    • Beverages
    • Dairy Products
    • Dietary Products
    • Pharmaceuticals
    • Tabletop Sweeteners
    • Processed Foods
    • Other
    Middle East High-Intensity Sweeteners by End User
    • Residential
    • Commercial
    Middle East High-Intensity Sweeteners by Distribution Channel
    • Supermarkets & Hypermarkets
    • Specialty Stores
    • Online
    • Others

    Africa Outlook (USD Million, 2019-2030)

    Africa High-Intensity Sweeteners by Product

    • Sucralose
    • Stevioside
    • Acesulfame K
    • Aspartame
    • Cyclamate
    • Glycyrrhizin
    • Saccharin
    • Others

    Africa High-Intensity Sweeteners by Form

    • Dry
    • Liquid
    Africa High-Intensity Sweeteners by Category
    • Artificial
    • Natural
    Africa High-Intensity Sweeteners by Application
    • Bakery & Confectionery
    • Beverages
    • Dairy Products
    • Dietary Products
    • Pharmaceuticals
    • Tabletop Sweeteners
    • Processed Foods
    • Other
    Africa High-Intensity Sweeteners by End User
    • Residential
    • Commercial
    Africa High-Intensity Sweeteners by Distribution Channel

    Supermarkets & Hypermarkets

    Specialty Stores

    Online

    Others

    Infographic

    Free Sample Request

    Kindly complete the form below to receive a free sample of this Report

    Get Free Sample

    Customer Strories

    “I am very pleased with how market segments have been defined in a relevant way for my purposes (such as "Portable Freezers & refrigerators" and "last-mile"). In general the report is well structured. Thanks very much for your efforts.”

    Victoria Milne

    Founder
    Case Study
    Chemicals and Materials