Horticulture Lighting Market (2026 - 2035)

Horticulture Lighting Market Size, Share and Research Report By Lighting Technology (LED, HID, Fluorescent, Plasma, Others), By Offering (Hardware, Software and Services), By Installation Type (New Builds, Retrofit), By Cultivation (Tomatoes and Peppers, Leafy Greens, Berries, Flowers, Cannabis, Others), By Application (Greenhouses, Vertical Farms, Others) and By Region (North America, Europe, Asia-Pacific, South America, Middle East & Africa) – Industry Forecast to 2035.
ID: MRFR/SEM/6369-CR
200 Pages
Nirmit Biswas, Aarti Dhapte
Last Updated: July 10, 2026
Horticulture Lighting Market
Market Size
Forecast Period2026-2035
CAGR (2026-2035)11.2%
2025 Market SizeUSD 10.46 Billion
2035 Market SizeUSD 30.52 Billion
Key Players
Signify N.V.
Fluence by OSRAM
Gavita
Samsung Electronics
Current
Heliospectra AB
Opportunities
  • Lighting-as-a-Service Business Models
  • Emerging-Market Greenhouse Expansion
  • Spectral-Data Monetization

Horticulture Lighting Market Summary

The global Horticulture Lighting Market reached an estimated USD 10.46 Billion in 2025, is projected to hit USD 11.74 Billion by 2026, and is forecast to grow to USD 30.52 Billion by 2035 at a CAGR of 11.2% during the 2026–2035 forecast window. Two catalysts are accelerating this trajectory: the wave of cannabis legalization across North American states—now encompassing over 40 U.S. jurisdictions with regulated adult-use programs—and the European Union's Fit-for-55 legislative package, which mandates aggressive energy-efficiency retrofits across commercial agriculture [1][2]. Together, these policy forces are pulling capital into advanced lighting systems at a pace the industry has rarely witnessed.

The technology backbone of the Horticulture Lighting Market is shifting decisively away from legacy high-intensity discharge (HID) fixtures toward precision-tuned LED platforms. Samsung and LG Innotek have scaled semiconductor wafer production to a point where fixture prices dropped an estimated 15–20% between 2024 and 2025, lowering the total cost of ownership for commercial growers [3]. Hardware commoditization, in turn, is pushing vendors upstream into cloud-based spectral analytics and subscription lighting-as-a-service models—a strategic pivot that mirrors broader platform-economy trends across industrial technology.

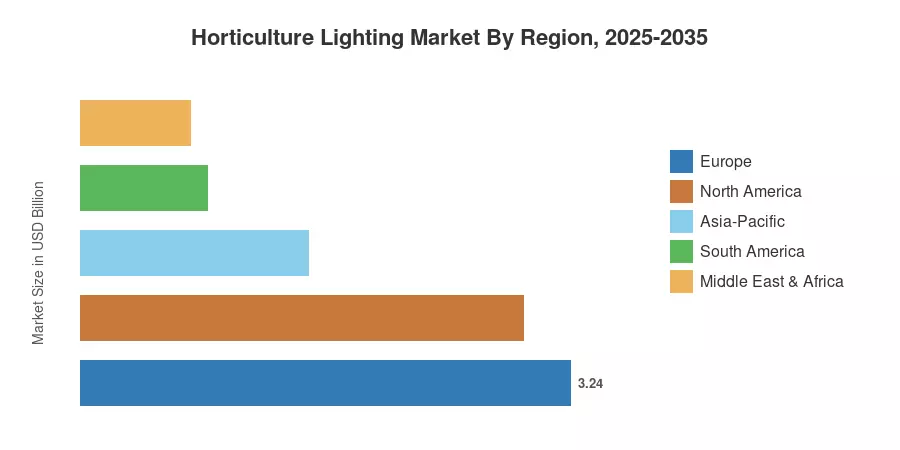
Europe remains the dominant region, accounting for roughly 31% of global Horticulture Lighting Market revenue in 2025, underpinned by Dutch greenhouse innovation and Scandinavian vertical-farm investment [4]. Asia-Pacific is the fastest-growing region with a projected CAGR of 14.4%, fueled by urban food-security mandates in Chinese and Japanese megacities. North America holds the second-largest share at approximately 28%, driven by cannabis cultivation infrastructure build-outs. The decade ahead will hinge on whether software-driven spectral intelligence can unlock yield improvements large enough to justify premium price points as LED hardware approaches commodity status.


Key Report Takeaways

• By Technology

  • LED systems commanded approximately 81% of the Horticulture Lighting Market in 2025, reinforcing their position as the default fixture across commercial grow operations.
  • Plasma and alternative light sources are projected to expand at a 13.4% CAGR through 2035, driven by research environments requiring continuous-spectrum output.

• By Offering

  • Hardware revenue represented roughly 67% of the Horticulture Lighting Market in 2025, though software and services are gaining share at a 13.4% CAGR.By Installation
  • Retrofit installations are forecast to grow at a 14.4% CAGR as growers replace aging HID systems under energy-efficiency mandates.

• By Region

  • Europe held a 31% share of the Horticulture Lighting Market in 2025, led by the Netherlands, Germany, and the Nordic countries.
  • Asia-Pacific is projected to register a 14.4% CAGR, the fastest among all regions.
  • North America contributed approximately USD 2.93 Billion in 2025 revenue.


Horticulture Lighting Market Size and Forecast (2021–2035)

Market Research Future's estimates blend primary supply-side data (manufacturer shipment records, channel surveys) with demand-side validation (grower CapEx disclosures, utility rebate databases). Historical figures are reconciled against customs trade codes and semiconductor production indices, while the forecast applies a bottom-up build across six segmentation dimensions calibrated to regional policy timelines.
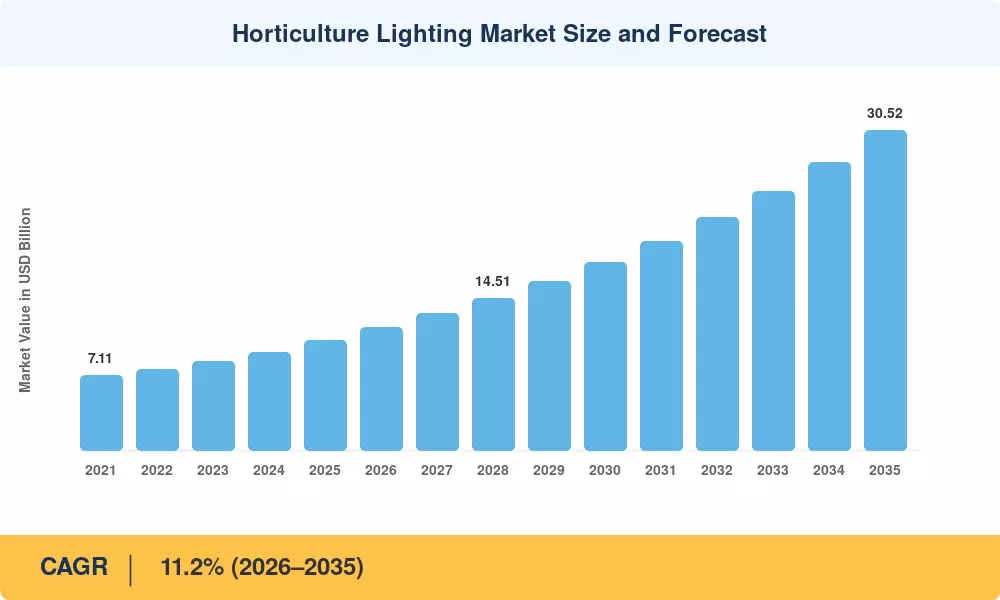
Horticulture Lighting Market Size and Forecast
Our Impact
Enabled $4.3B Revenue Impact for Fortune 500 and Leading Multinationals
Partnering with 2000+ Global Organizations Each Year
30K+ Citations by Top-Tier Firms in the Industry

Driver Impact Analysis

Driver ~% Impact on CAGR Geographic Relevance Impact Timeline
Cannabis legalization expansion 18–22% North America Short-term (≤2 yr)
EU Fit-for-55 retrofit mandates 15–18% Europe Medium-term (2–4 yr)
Urban food-security policies in Asia 14–17% Asia-Pacific Medium-term (2–4 yr)
LED semiconductor cost reductions 12–15% Global Short-term (≤2 yr)
Cloud-based spectral analytics adoption 10–13% North America, Europe Long-term (≥4 yr)
ESG green-bond financing for retrofits 8–11% Global Medium-term (2–4 yr)
Vertical-farm commissioning pipelines 7–10% Asia-Pacific, Europe Long-term (≥4 yr)


Cannabis Legalization and Controlled-Environment Agriculture

With over 120 million square feet of permitted canopy, the North American cannabis industry has shifted from a fast greenfield licensing period to an emphasis on operational efficiency and yield optimization. Although growth continues in developing state markets, the main factor driving lighting demand is now the retrofitting of existing facilities with high-efficiency, spectrum-tunable LED arrays rather than the activation of new licenses. Due to industry consolidation, yield-per-watt metrics and total cost of ownership are becoming more important factors in procurement decisions than the initial capital expenditure of building new facilities.


European Energy-Efficiency Mandates

Greenhouse operators now have to deal with a far stricter compliance environment after the European Climate Law was amended in April 2026, codifying a legally obligatory 90% net emissions reduction target for 2040. Operators in the Netherlands and Spain, who produce more than 40% of Europe's horticultural products, are moving from optional energy-efficiency programs to required, extensive LED retrofits. These businesses are giving priority to lighting systems that provide measurable energy savings and are compatible with the long-term climate reporting requirements required by the EU's updated industrial and agricultural policies, thanks to targeted Horizon Europe funding.


Asian Urban Food-Security Mandates

China's 14th Five-Year Plan earmarked CNY 80 Billion for smart-agriculture infrastructure, with indoor-farming pilots in Shenzhen, Shanghai, and Beijing receiving dedicated municipal subsidies for LED lighting installations [6]. Japan's Ministry of Agriculture reported that plant-factory acreage grew 22% year-over-year in 2024, a pace that positions the country as the world's densest vertical-farm market per capita [11]. These policy-driven build-outs are anchoring Asia-Pacific's position as the fastest-growing contributor to the Horticulture Lighting Market.

LED Semiconductor Cost Deflation

Samsung Electronics and LG Innotek expanded mid-power LED chip capacity by an estimated 35% between 2023 and 2025, triggering a price-per-watt decline of roughly 18% across horticultural-grade modules [3]. This cost deflation lowers payback periods for commercial growers from 3.5 years to under 2.5 years on average, crossing a critical adoption threshold that finance teams in large agricultural operations regard as the hurdle rate for CapEx approval.


Restraints Impact Analysis

Restraint ~% Impact on CAGR Geographic Relevance Impact Timeline
High upfront CapEx for full-facility retrofits –3 to –5% Global Short-term (≤2 yr)
Electricity cost volatility –2 to –4% Europe, Asia-Pacific Medium-term (2–4 yr)
Fragmented certification standards –2 to –3% Global Long-term (≥4 yr)
Thermal management complexity –1 to –2% Global Medium-term (2–4 yr)
Skilled labor shortages in controlled-environment agriculture –1 to –2% North America, Europe Long-term (≥4 yr)


High Upfront Capital Requirements

It still costs millions of dollars to retrofit a 10-hectare complex. But after the CEA sector consolidations of 2024–2025 and the accompanying tightening of federal credit guarantees, the main obstacle to adoption has changed from raw capital costs to "bankability." Lenders now use strict underwriting methods that need verifiable information on operating margins and debt serviceability instead of speculative lending. In order to obtain the funding required for extensive lighting retrofits, growers now have to provide thorough business cases, frequently supported by AI-driven production estimates.


Electricity Cost Volatility

Even though LED lighting uses 40–60% less energy than its HID counterparts, a major indoor enterprise still has an annual electricity cost of USD 15–25 per square foot [13]. ROI modeling is made more difficult for farmers in markets with unstable energy prices, such as Germany, the UK, and Japan. Despite being somewhat addressed, the European energy crisis of 2022–2024 had a long-lasting psychological impact on investment committees, delaying the horticultural lighting market's decision-making timeline.


Fragmented Certification and Interoperability Standards

No single global standard governs horticultural lighting performance claims. The Design Lights Consortium (DLC) in North America, the European Committee for Electrotechnical Standardization (CENELEC), and various Asian national bodies each maintain different testing protocols [14]. This fragmentation forces manufacturers to carry multiple SKUs and complicates procurement decisions for multinational agribusinesses scaling operations across regions.


Horticulture Lighting Market Opportunities

Lighting-as-a-Service Business Models

As hardware margins compress, vendors can pivot to recurring-revenue models that bundle fixtures, spectral-analytics software, and ongoing optimization services into monthly subscription contracts. Early movers such as Signify's GrowWise platform have demonstrated that subscription models reduce grower churn and increase lifetime customer value by 40–50% compared to one-time fixture sales[7].

Emerging-Market Greenhouse Expansion

Countries across the Middle East, North Africa, and Southeast Asia are investing heavily in climate-controlled agriculture to offset water scarcity and arable-land constraints. Saudi Arabia's NEOM project and the UAE's Food Tech Valley initiative have collectively committed over USD 3 Billion to indoor-farming infrastructure, a fraction of which will flow directly into advanced lighting procurement[17].

Spectral-Data Monetization

Growers generate terabytes of spectral, environmental, and yield data annually. Aggregated and anonymized, this data has commercial value for seed companies, agrochemical firms, and insurance underwriters seeking to model crop-performance risk. Lighting vendors that control the sensor-to-cloud data pipeline can build secondary revenue streams from analytics licensing[7].

Integration with Autonomous Greenhouse Controls

AI-driven climate-control platforms from companies such as Priva and Ridder are increasingly tightly coupled with lighting systems for closed-loop optimization. The Horticulture Lighting Market stands to benefit as autonomous greenhouse platforms become the default control layer, creating pull-through demand for API-compatible LED fixtures and spectral modules[9].

Cannabis Micro-Cultivation Licensing

Several Canadian provinces and U.S. states are issuing micro-cultivation licenses designed for small-batch premium cannabis production. These facilities—typically 200 to 2,000 square feet—require specialized multi-zone lighting that commands higher per-unit margins than commodity greenhouse fixtures, opening a profitable niche within the Horticulture Lighting Market[5].


Horticulture Lighting Market Future Outlook

AI-Driven Spectral Optimization

Machine-learning algorithms capable of dynamically adjusting light recipes in real time—based on plant-growth-stage sensors, ambient climate data, and yield-prediction models—will reshape the Horticulture Lighting Market by mid-decade. The International Energy Agency projects that AI-managed agricultural systems can cut energy waste by up to 30% while boosting crop yields 10–15%, creating a compelling value proposition for growers evaluating next-generation fixtures [20].

Platform Economics and Lighting-as-a-Service

The shift from capital-expenditure hardware sales to operating-expenditure subscription models will accelerate through 2030. Vendors that embed sensors, edge-computing modules, and API connectivity into fixtures will control recurring data-service revenue, potentially capturing 25–35% of total lifetime customer value from software alone [7]. This dynamic will reshape competitive positioning in the Horticulture Lighting Market.

Electrification and Renewable-Energy Integration

As on-site solar and battery-storage costs decline—BloombergNEF projects a further 40% drop in lithium-ion pack prices by 2030—commercial greenhouses will increasingly self-generate the electricity their lighting systems consume [21]. This convergence of distributed energy and controlled-environment agriculture will lower operating costs and strengthen the ROI case for the Horticulture Lighting Market in energy-sensitive regions.

ESG Reporting and Green-Bond Capital Flows

Corporate sustainability disclosure requirements under the EU's Corporate Sustainability Reporting Directive (CSRD) and the U.S. SEC's climate-risk rules are making LED retrofit investments directly reportable as Scope 2 emission reductions [8]. Green-bond issuance earmarked for agricultural sustainability surpassed USD 12 Billion globally in 2024, and a growing share of that capital is flowing into lighting-system upgrades across the Horticulture Lighting Market.


Horticulture Lighting Market Segmentation

By Lighting Technology

Segment Key Metric Primary Demand Driver
LED 81% share (2025) Cost deflation, spectral tunability, energy savings
HID USD 1.15 Billion (2025) Legacy installed base in older greenhouses
Fluorescent 5.8% CAGR Propagation and seedling applications
Plasma 13.4% CAGR Research facilities requiring continuous spectra
Others USD 0.08 Billion (2025) Niche experimental applications


LED technology dominates the Horticulture Lighting Market because of its unmatched combination of spectral precision, thermal efficiency, and declining cost per photon. Growers can tune wavelength output to optimize photosynthetic photon flux density for specific crops—a capability that HID and fluorescent fixtures cannot replicate. Plasma fixtures, though a small share, are gaining traction in academic and pharmaceutical research settings where broad-spectrum fidelity is non-negotiable.

By Offering

Segment Key Metric Primary Demand Driver
Hardware 67% share (2025) Fixture demand from new builds and retrofits
Software and Services 13.4% CAGR Spectral analytics, remote monitoring, subscription models


Hardware still captures the majority of the Horticulture Lighting Market, but software-and-services revenue is expanding as growers adopt cloud-based platforms for light-recipe management. Recurring subscription revenue is becoming a strategic priority for lighting OEMs seeking margin resilience amid hardware commoditization.

By Installation Type

Segment Key Metric Primary Demand Driver
New Builds 55% share (2025) Vertical-farm and cannabis facility construction
Retrofit 14.4% CAGR EU energy mandates, utility rebate incentives


By Cultivation

Segment Key Metric Primary Demand Driver
Tomatoes and Peppers 22% share (2025) Year-round greenhouse production
Leafy Greens 13.8% CAGR Vertical-farm expansion
Berries 16.1% CAGR Premium export markets
Flowers USD 0.94 Billion (2025) Dutch and South American floriculture
Cannabis USD 1.78 Billion (2025) North American legalization
Others 10.5% CAGR Herbs, microgreens, specialty crops


Tomatoes and peppers lead the Horticulture Lighting Market by cultivation category owing to the sheer scale of year-round greenhouse production in Europe and North America. Cannabis represents the fastest value-growth category in absolute dollar terms, driven by North American licensing.

By Application

Segment Key Metric Primary Demand Driver
Greenhouses 46% share (2025) Established commercial growing infrastructure
Vertical Farms 16.3% CAGR Urban food security, controlled-environment agriculture
Others USD 0.63 Billion (2025) Research labs, tissue culture, indoor gardens


Greenhouses anchor the Horticulture Lighting Market by application because of their vast installed base, but vertical farms are the definitive growth story of the forecast period. Multi-story indoor operations require lighting on every cultivation tier, multiplying fixture demand per square meter of floor space.


Regional Market Share Analysis

Region Key Metric (2025) Primary Investment Themes
North America USD 2.93 Billion Cannabis facility build-outs, utility LED rebate programs
Europe 31% share Fit-for-55 retrofits, Dutch greenhouse modernization
Asia-Pacific 14.4% CAGR (2026–2035) Urban food security, vertical-farm commissioning
South America USD 0.84 Billion Floriculture exports, tropical berry cultivation
Middle East & Africa 7% share Arid-climate indoor farming, sovereign food programs
Total USD 10.46 Billion

The Horticulture Lighting Market exhibits a clear regional hierarchy, with Europe maintaining legacy leadership, Asia-Pacific accelerating rapidly, and North America anchored by cannabis-driven demand.


North America

Country Key Metric Key Driver
US 72% of regional share Cannabis licensing, controlled-environment agriculture investment
Canada 14.2% CAGR Licensed producer expansion, federal cultivation incentives
Mexico USD 0.12 Billion Protected-agriculture corridor in Sinaloa and Jalisco


The United States dominates the North American Horticulture Lighting Market, with cannabis cultivation states—California, Colorado, Michigan, and Illinois—accounting for the bulk of LED fixture demand. Canada's established licensed-producer ecosystem continues to upgrade aging facilities, and Mexico's protected-agriculture sector is adopting LED solutions for premium vegetable exports to the U.S. market [5][18].

Europe

Country Key Metric Key Driver
Germany 21% of regional share Energiewende agricultural subsidies
UK 11.8% CAGR Vertical-farm investment post-Brexit
France USD 0.38 Billion Wine and floral production under LED transition
Italy 9% of regional share Mediterranean greenhouse retrofits
Spain 12.1% CAGR Almería greenhouse cluster modernization
Nordic Countries USD 0.41 Billion Year-round indoor cultivation, high electricity access
Russia 5% of regional share Import-substitution agricultural policy
Rest of Europe USD 0.29 Billion CEE greenhouse expansion


Europe's position in the Horticulture Lighting Market rests on the Netherlands' role as the global epicenter of greenhouse innovation—Wageningen University research feeds directly into commercial LED deployments across Westland and the broader South Holland corridor [4]. Germany's Energiewende-linked agricultural subsidies and Spain's Almería cluster are secondary engines, while the UK's post-Brexit food-security focus is channeling private-equity capital into vertical-farm ventures.

Asia-Pacific

Country Key Metric Key Driver
China 38% of regional share 14th Five-Year Plan smart-agriculture subsidies
India 16.2% CAGR Polyhouse expansion in Maharashtra and Karnataka
Japan USD 0.52 Billion Plant-factory density, aging farmer demographics
South Korea 13.8% CAGR Smart-farm complexes under Ministry of Agriculture
ASEAN USD 0.22 Billion Tropical indoor-farming pilots in Singapore and Thailand
Rest of Asia-Pacific 11.5% CAGR Emerging market penetration


China anchors Asia-Pacific's Horticulture Lighting Market through a combination of sovereign food-security mandates and aggressive municipal subsidies. Japan's plant-factory count surpassed 400 commercial facilities in 2024 [11], and South Korea's government-backed smart-farm complexes are driving LED adoption in leafy-green and strawberry production.

South America

Country Key Metric Key Driver
Brazil 52% of regional share Export-oriented berry and floriculture production
Argentina 12.4% CAGR Protected horticulture expansion in Mendoza
Rest of South America USD 0.14 Billion Colombia and Ecuador flower exports


Brazil's floriculture sector—centered in Holambra, São Paulo state—is the primary demand center, increasingly replacing HPS fixtures with LED systems to meet European import sustainability certifications [19].

Middle East & Africa

Country Key Metric Key Driver
Saudi Arabia 31% of regional share NEOM and indoor-farming sovereign investment
UAE 13.5% CAGR Food Tech Valley, Masdar City agri-tech
South Africa USD 0.09 Billion Cape Town vertical-farm startups
Egypt 10.8% CAGR Nile Delta greenhouse modernization
Rest of MEA USD 0.07 Billion Early-stage market development


Saudi Arabia and the UAE are deploying sovereign-wealth capital into indoor agriculture at scale, with the Horticulture Lighting Market directly benefiting from multi-billion-dollar food-security programs designed to reduce dependence on imports in arid climates [17].


Horticulture Lighting Market By Region, 2025-2035

Competitive Benchmarking

The Horticulture Lighting Market exhibits medium concentration: the top five players collectively hold an estimated 35–42% revenue share, while a long tail of regional specialists and startup lighting companies serves niche segments. The Herfindahl-Hirschman Index sits in the 800–1,200 range, indicating a moderately fragmented landscape where scale advantages in LED chip procurement coexist with differentiation opportunities in software and crop-specific spectral expertise.

Company Est. Revenue Share Range Key Offerings Strategic Positioning
Signify N.V. (Philips) ~10–14% GreenPower LED, GrowWise spectral platform Full-stack hardware + analytics leader
Fluence by OSRAM ~7–10% VYPR, RAZR, and SPYDR LED series Cannabis and leafy-green specialization
Gavita (Hawthorne) ~5–8% Pro 1700e LED, environmental controllers Premium cannabis cultivation brand
Samsung Electronics ~4–7% Mid-power LED chip modules, LM301H Upstream component supplier
Current (by GE) ~3–5% Arize LED solutions for horticulture Broad commercial lighting ecosystem
Heliospectra AB ~2–4% ELIXIA, DYNA, LightBar series Intelligent light-management software
California LightWorks ~2–3% SolarSystem series, MegaDrive North American cannabis market focus
Hortilux Schréder ~2–3% HortiLED Top, FSE LED fixtures European greenhouse expertise
LumiGrow Inc. ~1–3% SmartPAR wireless lighting system Data-driven lighting control
Illumitex (now Vypr) ~1–2% Power Harvest, HarvestEdge Controlled-environment vertical farms


Recent News & Developments


  • Heliospectra AB (April 2024): Partnered with Priva B.V. to integrate spectral-control APIs into Priva's greenhouse climate-management platform, enabling closed-loop lighting optimization [24].
  • November 2025: Signify announced plans to add 40% more capacity for GreenPower modules at its Piń, Poland plant for EUR 85 million (USD 92 million), with commissioning scheduled for Q3 2026.
  • October 2025: Samsung invested USD 15 million with Bowery Farming to install LM301H LEDs on 12 hectares of vertical farms in Georgia and Texas.
  • September 2025: California LightWorks closed a USD 22 million Series C to construct a 28,000-square-foot SolarSystem fixture facility in Sacramento.


Horticulture Lighting Market Report Scope

Parameter Detail
Market Scope Global Horticulture Lighting Market covering hardware, software, services, and installation
Study Period 2021–2035
CAGR (Forecast) 11.2% (2026–2035)
Base Year Market Size USD 10.46 Billion (2025)
Forecast-End Market Size USD 30.52 Billion (2035)
Fastest Growing Segment Vertical Farms by Application (16.3% CAGR); Berries by Cultivation (16.1% CAGR)
Companies Profiled 10 (Signify, Fluence, Gavita, Samsung, Current, Heliospectra, California LightWorks, Hortilux Schréder, LumiGrow, Illumitex)
Valuation Currency USD Billion


FAQs

What payback period should a commercial grower expect when switching from HID to LED fixtures?
Most operations recoup LED retrofit costs within 2.0–2.8 years through energy savings of 40–60% and reduced HVAC loads. Utility rebate programs in North America and Europe can shorten this to under 18 months [12].
How do procurement teams evaluate spectral claims from competing lighting vendors?
Request third-party photon-efficacy test reports verified under DLC or CENELEC protocols. Independent lab data on photosynthetic photon flux density at canopy level matters more than manufacturer-reported wall-plug efficiency [14].
Which financing structures are most effective for large-scale lighting retrofits?
ESG-linked green bonds and equipment-as-a-service leases dominate current deal structures. Green bonds offer 50–80 basis points of interest savings versus conventional debt for qualifying agricultural projects [8].
How does fixture selection differ between single-tier greenhouses and multi-tier vertical farms?
Greenhouses typically use high-output toplighting fixtures spaced at wide intervals. Vertical farms require compact interlighting bars on each rack tier with precise beam control to avoid cross-tier light contamination [15].
What cybersecurity risks arise from cloud-connected lighting systems in commercial agriculture?
Networked fixtures create attack surfaces for operational-technology intrusion. Growers should mandate TLS 1.3 encryption, isolated VLAN segmentation, and regular firmware patching in procurement specifications [7].
Are plasma fixtures a viable alternative for any commercial-scale applications?
Plasma remains confined to research and breeding programs requiring continuous broadband spectra. Unit economics and fixture lifespan do not yet support commercial-scale deployment beyond pilot installations [24].
How will carbon-credit markets affect lighting investment decisions by 2030?
Verified Scope 2 emission reductions from LED conversions are increasingly tradable under voluntary carbon registries. Early adopters can monetize credits worth USD 8–15 per metric ton of CO₂ avoided annually [8].    
Author
Author
Author Profile
Nirmit Biswas LinkedIn
Senior Research Analyst
With 5+ years of expertise in Market Intelligence and Strategic Research, Nirmit Biswas specializes in ICT, Semiconductors, and BFSI. Backed by an MBA in Financial Services and a Computer Science foundation, Nirmit blends technical depth with business acumen. He has successfully led 100+ projects for global enterprises and startups, including Amazon, Cisco, L&T and Huawei, delivering market estimations, competitive benchmarking, and GTM strategies. His focus lies in transforming complex data into clear, actionable insights that drive growth, innovation, and investment decisions. Recognized for bridging engineering innovation with executive strategy, Nirmit helps businesses navigate dynamic markets with confidence.
Co-Author
Co-Author Profile
Aarti Dhapte LinkedIn
AVP - Research
A consulting professional focused on helping businesses navigate complex markets through structured research and strategic insights. I partner with clients to solve high-impact business problems across market entry strategy, competitive intelligence, and opportunity assessment. Over the course of my experience, I have led and contributed to 100+ market research and consulting engagements, delivering insights across multiple industries and geographies, and supporting strategic decisions linked to $500M+ market opportunities. My core expertise lies in building robust market sizing, forecasting, and commercial models (top-down and bottom-up), alongside deep-dive competitive and industry analysis. I have played a key role in shaping go-to-market strategies, investment cases, and growth roadmaps, enabling clients to make confident, data-backed decisions in dynamic markets.

Research Approach


Secondary Research

The secondary research process involved comprehensive analysis of agricultural technology databases, peer-reviewed horticultural journals, energy efficiency publications, and authoritative agricultural organizations. Key sources included the US Department of Agriculture (USDA), National Institute of Food and Agriculture (NIFA), Agricultural Research Service (ARS), US Department of Energy (DOE) Office of Energy Efficiency & Renewable Energy, Environmental Protection Agency (EPA) Energy Star Program, European Commission Directorate-General for Agriculture and Rural Development (DG AGRI), European Environment Agency (EEA), International Society for Horticultural Science (ISHS), American Society of Agricultural and Biological Engineers (ASABE), Controlled Environment Agriculture Association (CEA), National Renewable Energy Laboratory (NREL), Lawrence Berkeley National Laboratory (LBNL), International Energy Agency (IEA) Energy Efficiency Division, Food and Agriculture Organization (FAO) of the United Nations, OECD Agricultural Statistics, Eurostat Agricultural Database, and national agricultural ministry reports from key markets. These sources were used to collect crop yield statistics, energy consumption data, regulatory compliance standards, adoption trends for controlled environment agriculture, and market landscape analysis for LED, high-intensity discharge, fluorescent, and laser lighting technologies across greenhouse, vertical farming, and indoor gardening applications.


Primary Research

Qualitative and quantitative insights were obtained by interviewing supply-side and demand-side stakeholders during the primary research process. The supply-side sources consisted of CEOs, VPs of Product Development, chief technology officers, and commercial directors from horticulture lighting manufacturers, LED chip suppliers, and greenhouse technology integrators. The demand-side sources included commercial greenhouse operators, vertical farm founders, indoor farming facility managers, agricultural research scientists, and procurement leaders from large-scale agricultural cooperatives, cannabis cultivation facilities, and university research stations. Market segmentation was validated across lighting types and spectrums, product development timelines were confirmed, and insights regarding technology adoption patterns, energy efficiency ROI, utility rebate programs, and spectral optimization strategies for various crop varieties were garnered through primary research.

Primary Respondent Breakdown:

By Designation: C-level Primaries (32%), Director Level (30%), Others (38%)

By Region: North America (32%), Europe (30%), Asia-Pacific (33%), Rest of World (5%)


Market Size Estimation

Global market valuation was derived through revenue mapping and installation volume analysis across greenhouse, vertical farming, indoor gardening, horticultural research, and plant propagation segments. The methodology included:

The identification of over 50 key manufacturers in North America, Europe, Asia-Pacific, and Latin America

Product mapping across LED, high-intensity discharge (HID), fluorescent, incandescent, and laser lighting categories

Spectrum analysis across full spectrum, red and blue spectrum, white spectrum, ultraviolet spectrum, and far-red spectrum offerings

Analysis of reported and modeled annual revenues specific to horticulture lighting portfolios

Coverage of manufacturers representing 72-78% of global market share in 2024

Extrapolation using bottom-up (installation volume × ASP by application and region) and top-down (manufacturer revenue validation) approaches to derive segment-specific valuations for commercial growers, residential users, research institutions, and agricultural cooperatives

Download Free Sample

Kindly complete the form below to receive a free sample of this Report

Download PDF ×

We do not share your information with anyone. However, we may send you emails based on your report interest from time to time. You may contact us at any time to opt-out.

















