LED Lighting Market (2026 - 2035)

LED Lighting Market Size, Share and Research Report By Installation Type (New Installation, Retrofit), By Product Type (Lamps, Luminaries), By Distribution Channel (Store Based, Non-Store Based), By End-Use Application (Indoor Lighting, Outdoor Lighting), and By Regional (North America, Europe, South America, Asia Pacific, Middle East and Africa) - Industry Forecast Till 2035
ID: MRFR/SEM/2114-CR
200 Pages
Ankit Gupta
Last Updated: July 29, 2026
LED Lighting Market
Market Size
Forecast Period2026-2035
CAGR (2026-2035)6.0%
2025 Market SizeUSD 112.30 Billion
2035 Market SizeUSD 201.12 Billion
Key Players
Signify
Acuity Brands
ams-OSRAM
Cree Lighting
Zumtobel Group
Hubbell Incorporated
Opportunities
  • Lighting-as-a-Service (LaaS) Business Models
  • Horticultural and Specialty LED Applications
  • Emerging-Market Electrification Programs

LED Lighting Market Summary

The LED Lighting Market was valued at USD 112.30 Billion in 2025 and is projected to reach USD 119.04 Billion in 2026 before climbing to USD 201.12 Billion by 2035, registering a CAGR of 6.0% during the 2026–2035 forecast period. Government phase-outs of incandescent and halogen lamps across the EU, North America, and parts of Asia have created a regulatory floor beneath demand. At the same time, smart-city investment programs—estimated at over USD 800 Billion cumulatively through 2030 [1]—embed LED infrastructure into municipal budgets as a core utility expenditure rather than a discretionary upgrade.

The underlying technology revolution has gone well beyond simple lamp replacement. First-generation LED retrofits done from 2014 to 2017 are currently undergoing a second replacement cycle. The replacement units that are appearing on spec sheets now include sensors, wireless connection and adaptive dimming that the legacy lights never offered. Advanced LED systems can lower lighting energy use by an additional 40–60% compared with early-generation LEDs, according to the U.S. Department of Energy’s Solid-State Lighting Program [2], giving building operators a new economic reason to update again.

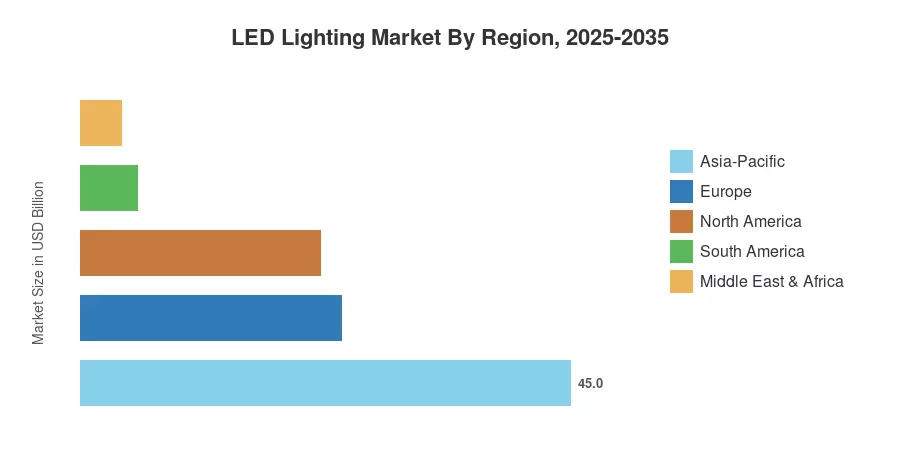
Asia-Pacific leads the LED Lighting Market and is anticipated to account for almost 45.0% of the global revenue in 2025, owing to China’s manufacturing base and large-scale public procurement projects in India. The region is also the fastest expanding with a CAGR of around 7.0% until 2035. Europe is the second largest market at about 24% due to high energy-performance requirements under the EU Ecodesign Directive. As connected-lighting platforms become more developed and utility rebate programs grow, the LED Lighting Market will be positioned to take an increasing share of overall building construction costs over the next decade.


Key Report Takeaways

• By Product Type

  • Luminaires captured an estimated 65.8% revenue share in the LED Lighting Market in 2025, reflecting the preference for integrated fixture solutions across commercial projects.
  • LED lamps are forecast to grow at a 7.8% CAGR through 2035, driven by retail-channel demand and residential retrofit activity.

• By Installation Type

  • Retrofit installations accounted for approximately 72.3% of LED Lighting Market revenue in 2025 as building operators replaced aging first-generation LED and fluorescent systems.
  • New installations are projected to expand at a 7.7% CAGR, buoyed by green-building codes mandating LED-ready electrical design in commercial construction.

• By Region

  • Asia-Pacific led the LED Lighting Market with a 45.0% revenue share in 2025, anchored by government procurement tenders in China and India.
  • Highway and roadway lighting applications are expected to advance at an 8.4% CAGR, reflecting accelerated smart-city infrastructure rollouts across emerging economies.


Market Size and Forecast (2021–2035)

Market Research Future's estimates draw on primary surveys of LED module producers, luminaire OEMs, and distribution partners, cross-referenced with customs trade data and regional construction spending indices. Historical figures (2021–2024) are derived from audited company filings and industry association reports, while forecast values (2026–2035) apply econometric models that incorporate regulatory timelines, raw-material pricing, and replacement-cycle assumptions.
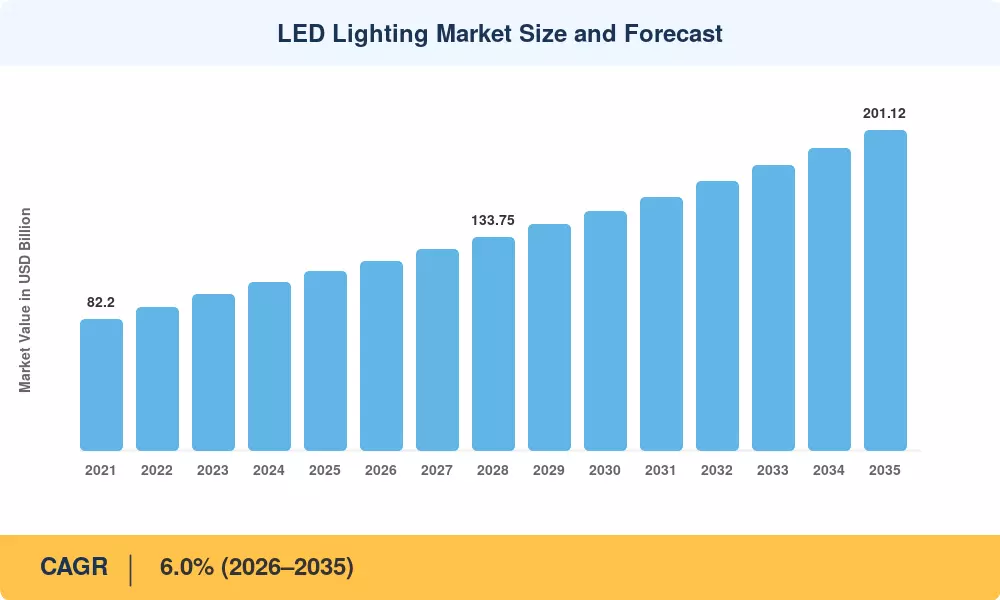
LED Lighting Market Size and Forecast
Our Impact
Enabled $4.3B Revenue Impact for Fortune 500 and Leading Multinationals
Partnering with 2000+ Global Organizations Each Year
30K+ Citations by Top-Tier Firms in the Industry

Driver Impact Analysis

Driver ~% Impact on CAGR Geographic Relevance Impact Timeline
Government phase-out mandates for inefficient lamps +1.2% Global Short-term (≤2 yr)
Smart-city and connected-infrastructure programs +1.0% Asia-Pacific, Europe Medium-term (2–4 yr)
Secondary replacement cycle (2014–2017 installs) +0.8% North America, Europe Short-term (≤2 yr)
Commercial construction and green-building codes +0.7% North America, APAC Medium-term (2–4 yr)
Utility rebate and incentive programs +0.5% North America Short-term (≤2 yr)
Horticultural and specialty LED application growth +0.4% Europe, North America Long-term (≥4 yr)
Declining LED chip costs and efficacy improvements +0.3% Global Long-term (≥4 yr)


Government Phase-Out Mandates

Regulatory bans on halogen and compact fluorescent lamps remain the single most powerful demand catalyst for the LED Lighting Market. The EU's updated Ecodesign Regulation (EU 2019/2020) eliminated most remaining exemptions for linear fluorescent tubes in September 2023, affecting an estimated 2.5 billion lamp sockets across European commercial buildings [4]. In the United States, the DOE's backstop rule, effective from July 2023, set a minimum efficacy standard of 45 lumens per watt, effectively banning incandescent and halogen A-type lamps [10]. These mandates convert discretionary upgrades into compliance-driven purchases, compressing sales cycles and expanding addressable volume.

Smart-City and Connected-Infrastructure Programs

Municipal governments worldwide are bundling LED street-light conversions with sensor networks, traffic-management systems, and environmental monitors. The combined global smart-city technology spend is projected to exceed USD 800 billion by 2030 [1], with outdoor lighting frequently serving as the backbone infrastructure for IoT sensor nodes. Cities such as Barcelona, Singapore, and Pune have piloted adaptive street-lighting grids that adjust output based on real-time pedestrian and traffic density, cutting energy use by up to 70% versus static HPS fixtures [11]. For the LED Lighting Market, this bundling strategy elevates the average contract value per fixture and locks in multi-year service agreements.

Secondary Replacement Cycle

The large-scale commercial and municipal LED retrofits carried out between 2014 and 2017 are approaching the end of their rated lifetimes. The DOE estimates that roughly 35% of commercial LED fixtures installed before 2016 operate below current efficiency benchmarks [2], and their replacement opens a second wave of demand that differs from the first in one critical respect: buyers now expect integrated controls, occupancy sensing, and network connectivity as standard features rather than premium add-ons.


Restraints Impact Analysis

The restraint-impact percentages below reflect Market Research Future's assessment of headwinds that temper the LED Lighting Market's growth trajectory. These are directional indicators, not subtractive adjustments to the CAGR.

Restraint ~% Impact on CAGR Geographic Relevance Impact Timeline
Margin pressure from low-cost commodity producers −0.6% Global Short-term (≤2 yr)
LED longevity reducing replacement frequency −0.5% North America, Europe Long-term (≥4 yr)
High upfront cost of advanced connected fixtures −0.4% Emerging Markets Medium-term (2–4 yr)
Interoperability fragmentation in smart-lighting protocols −0.3% Global Medium-term (2–4 yr)
Supply-chain disruption for phosphor and rare-earth materials −0.2% Global Short-term (≤2 yr)


Commodity Price Compression

Aggressive capacity expansion by manufacturers in Guangdong and Zhejiang has pushed average selling prices for basic LED lamps below USD 1.50 per unit in several Asian and African markets [12]. While lower prices expand addressable volume, they erode manufacturer margins and discourage R&D investment in premium features. Samsung's planned exit from the LED chip business by 2030 [16] illustrates how persistent pricing pressure can make participation uneconomic even for well-capitalized conglomerates. The LED Lighting Market's long-term health depends on whether quality differentiation can offset this commoditization trend.

LED Longevity Paradox

A 50,000-hour rated life means a typical commercial LED luminaire lasts 10–12 years under normal operating conditions, significantly longer than the fluorescent and HID lamps it replaces. This durability dampens recurring replacement revenue and extends the gap between purchase cycles [9]. Manufacturers have responded by shifting toward lighting-as-a-service contracts and firmware-upgradable fixtures, but adoption of these models remains concentrated among large enterprise accounts.


LED Lighting Market Opportunities

Lighting-as-a-Service (LaaS) Business Models

Subscription-based lighting models eliminate upfront capital barriers and generate recurring revenue streams. Signify's Interact platform and Current's Daintree system both offer managed-service packages that bundle fixtures, sensors, and analytics dashboards for a monthly fee [17]. As CFOs increasingly prefer OpEx over CapEx treatment for building systems, LaaS adoption in the LED Lighting Market is positioned to grow rapidly, particularly in multi-tenant office and retail environments.

Horticultural and Specialty LED Applications

The controlled-environment agriculture sector is projected to reach USD 25 billion by 2030, and purpose-built LED grow lights represent the fastest-growing specialty segment. Tunable-spectrum fixtures that optimize photosynthetic photon flux for specific crop stages offer yield improvements of 20–30% versus broadband alternatives, creating a high-value niche within the broader LED Lighting Market.

Emerging-Market Electrification Programs

Sub-Saharan Africa and South Asia contain over 700 million people without reliable electricity access [18]. Off-grid and micro-grid solar-LED kits, priced at USD 10–50 per household unit, represent a significant volume opportunity. The World Bank's Lighting Global program has certified over 200 million solar-LED products since inception [18], and continued donor and private-sector investment positions the LED Lighting Market to capture demand in regions bypassing legacy grid infrastructure entirely.

Li-Fi and Optical Wireless Communication

LED fixtures capable of modulating light at frequencies imperceptible to the human eye can serve as high-bandwidth data-transmission points. Early enterprise trials by pureLiFi report speeds exceeding 150 Mbps per access point [19]. While commercial scale remains nascent, the integration of data delivery into lighting infrastructure could redefine the value proposition of LED installations in the LED Lighting Market over the long term.

Circular-Economy and Design-for-Disassembly Standards

The EU's proposed Ecodesign for Sustainable Products Regulation will extend recyclability and repairability requirements to luminaires by 2028 [20]. Manufacturers that design modular, serviceable fixtures will gain preferential access to European public-procurement tenders, creating a competitive moat for early movers in the LED Lighting Market.


LED Lighting Market Future Outlook

AI-Driven Adaptive Lighting Ecosystems

Machine-learning algorithms embedded in building-management systems will increasingly optimize LED output in real time based on occupancy patterns, daylight availability, and even circadian health parameters. estimates that by 2030, over 50% of new commercial lighting installations will include some form of AI-based control logic [23], transforming luminaires from static light sources into dynamic environmental management nodes within the LED Lighting Market.

Platform Economics and Data Monetization

As connected LED fixtures proliferate, the data streams they generate—foot traffic, occupancy density, environmental conditions—become commercially valuable beyond their primary illumination function. Retailers already use ceiling-mounted LED sensor arrays to map in-store customer journeys, and property managers leverage occupancy analytics to optimize space utilization [17]. This shift from product to platform economics is expected to reshape competitive positioning in the LED Lighting Market through 2035.

Electrification and Net-Zero Building Mandates

The IEA's Net Zero by 2050 scenario requires global building-sector emissions to fall by 50% before 2030 [24]. Because lighting accounts for roughly 15% of total building electricity consumption, high-efficacy LED systems paired with daylight harvesting and occupancy sensing represent low-hanging-fruit decarbonization measures. The LED Lighting Market stands to capture accelerating investment as jurisdictions tighten building-performance standards in pursuit of Paris Agreement commitments.

Circular Design and Extended Producer Responsibility

Emerging EU and APAC regulations will mandate recyclability targets and take-back obligations for luminaire manufacturers within the next five years [20]. Modular LED fixtures designed for component-level repair and upgrade—rather than whole-unit disposal—will gain specification preference in public-sector procurement. The LED Lighting Market's design paradigm is shifting from lowest-first-cost toward lowest-lifecycle-cost, rewarding manufacturers that invest in serviceability and material traceability.


LED Lighting Market Segmentation

By Product Type

Segment Metric Primary Demand Driver
Luminaires/Fixtures 65.8% share (2025) Integrated commercial solutions with embedded controls
Lamps 7.8% CAGR (2026–2035) Retail and residential replacement demand


Luminaires dominate the LED Lighting Market because commercial, industrial, and municipal buyers overwhelmingly purchase complete fixture assemblies rather than standalone bulbs. Integrated luminaires allow manufacturers to bundle drivers, optics, thermal management, and connectivity modules into a single SKU, simplifying specification and installation. The lamps segment, while smaller in revenue share, grows faster as retail consumers upgrade legacy sockets and as e-commerce platforms expand access in developing markets where per-unit price sensitivity favors standalone bulbs over full fixture replacement.

By Installation Type

Segment Metric Primary Demand Driver
Retrofit 72.3% share (2025) Replacement of first-generation LED and fluorescent systems
New Installation 7.7% CAGR (2026–2035) Green-building code requirements in new construction


Retrofit activity continues to underpin the LED Lighting Market, as the installed base of sub-optimal lighting in commercial buildings remains vast. The shift from first-generation to advanced LED fixtures is particularly active in North America and Europe, where utility incentives partially defray upgrade costs. New installations grow faster on a percentage basis because green-building standards in Asia-Pacific and the Middle East now require LED-ready electrical design as a permitting prerequisite, embedding demand at the project specification stage.

By End User

Segment Metric Primary Demand Driver
Indoor 58.3% share (2025) Office, retail, healthcare, and industrial facility upgrades
Outdoor 9.2% CAGR (2026–2035) Smart-city street-lighting and highway programs


Indoor applications represent the majority of LED Lighting Market revenue, encompassing office buildings, retail stores, warehouses, and healthcare facilities where lighting quality directly affects productivity and occupant well-being. Outdoor applications—street lighting, architectural façades, parking structures, and sports venues—are growing faster due to municipal smart-lighting programs that pair LED fixtures with IoT sensors for adaptive brightness, traffic monitoring, and public safety.


Regional Market Share Analysis

Region Metric Primary Investment Themes
Asia-Pacific 45.0% share (2025) Government procurement, manufacturing scale, urbanization
Europe 24.0% share (2025) Ecodesign compliance, energy-efficiency retrofits
North America 22.0% share (2025) Utility rebates, commercial construction, smart buildings
South America 5.2% share (2025) Urban infrastructure modernization, residential adoption
Middle East & Africa 3.8% share (2025) Smart-city mega-projects, off-grid solar-LED deployment
Total 100%

The LED Lighting Market exhibits a clear geographic hierarchy, with Asia-Pacific accounting for the largest share of global revenue and also posting the highest forecast CAGR. Regional dynamics differ substantially: mature markets in North America and Europe are driven by replacement and compliance, while growth in South America and the Middle East & Africa depends on electrification investment and urbanization.


North America

Country Metric Key Driver
U.S. 78% of regional revenue DOE efficacy standards and utility incentive programs [10]
Canada 6.2% CAGR (2026–2035) Federal carbon-pricing framework incentivizing retrofits
Mexico USD 2.85 Billion (2025) Industrial corridor expansion and nearshoring construction


The LED Lighting Market in North America benefits from a mature electrical infrastructure and well-funded utility rebate programs that subsidize commercial and municipal LED conversions. The Inflation Reduction Act's tax incentives for energy-efficient building systems have further accelerated adoption in the commercial office and healthcare verticals [7]. Canada's updated National Energy Code for Buildings now references LED-specific performance benchmarks, while Mexico's growing manufacturing sector attracts greenfield factory construction that specifies LED from the outset.

Europe

Country Metric Key Driver
Germany 22% of regional revenue Energiewende-driven efficiency mandates
UK 5.8% CAGR (2026–2035) Post-Brexit independent product standards [21]
France USD 3.60 Billion (2025) RE2020 building-energy regulation
Italy 12% of regional revenue Superbonus 110% renovation incentive
Spain 5.5% CAGR (2026–2035) Tourism infrastructure modernization
Nordic Countries USD 2.80 Billion (2025) Climate targets and high electricity prices
Russia 3.8% of regional revenue Import substitution and domestic LED fabrication
Rest of Europe 5.3% CAGR (2026–2035) EU cohesion-fund renovation programs


Europe's LED Lighting Market is shaped by some of the world's most stringent building-energy codes. The EU's phasedown of fluorescent tubes in 2023 converted a large installed base into immediate LED demand [4]. Germany's Energiewende policy framework and France's RE2020 standard both embed lighting-efficiency thresholds into new construction and major renovation permits, ensuring steady project-driven demand across the forecast period.

Asia-Pacific

Country Metric Key Driver
China 48% of regional revenue Domestic manufacturing dominance and public-sector tenders
India 8.2% CAGR (2026–2035) UJALA and SLNP mass-procurement schemes [5]
Japan USD 7.10 Billion (2025) Aging infrastructure replacement and ZEB targets
South Korea 11% of regional revenue Semiconductor-ecosystem synergies
ASEAN 7.5% CAGR (2026–2035) Urbanization and commercial real-estate growth
Rest of Asia-Pacific USD 3.20 Billion (2025) Rural electrification and off-grid solar-LED kits


China's dual role defines the LED Lighting Market in Asia-Pacific as the world's largest producer and consumer of LED products. India's UJALA program has distributed over 370 million LED bulbs since 2015 [5], making it the largest single-country public lighting initiative globally. Japan's push toward net-zero energy buildings (ZEB) by 2030 sustains demand for high-efficacy luminaires, while Southeast Asian nations are investing heavily in commercial and retail construction that defaults to LED specification.

South America

Country Metric Key Driver
Brazil 62% of regional revenue Municipal street-lighting PPP concessions
Argentina 5.9% CAGR (2026–2035) Utility tariff reform encouraging efficiency investments
Rest of South America USD 1.10 Billion (2025) Urban migration and residential electrification


Brazil dominates the South American LED Lighting Market through large-scale public-private partnership concessions for municipal street-lighting conversion. The country's PROCEL program labels and promotes energy-efficient lighting products, driving consumer awareness and retail penetration. Argentina's recent tariff reforms that bring electricity prices closer to cost-recovery levels have sharpened the economic case for LED upgrades in commercial and residential buildings.

Middle East & Africa

Country Metric Key Driver
Saudi Arabia 30% of regional revenue Vision 2030 mega-project construction [22]
UAE 6.8% CAGR (2026–2035) Smart-city deployments in Dubai and Abu Dhabi
South Africa USD 0.55 Billion (2025) Load-shedding driving off-grid and battery-LED adoption
Egypt 5.6% CAGR (2026–2035) New Administrative Capital construction
Rest of MEA 28% of regional revenue Donor-funded rural electrification programs [18]


The Middle East & Africa represents the smallest but one of the most dynamic segments of the LED Lighting Market. Saudi Arabia's Vision 2030 and NEOM projects specify LED as the baseline illumination standard across all new construction. In Sub-Saharan Africa, solar-LED lanterns and home systems continue to displace kerosene in communities beyond the grid, supported by the World Bank and off-grid solar financing facilities.


LED Lighting Market By Region, 2025-2035

Competitive Benchmarking

The LED Lighting Market displays medium concentration, with the top five players holding an estimated 30–38% combined revenue share. The Herfindahl-Hirschman Index sits in the moderate range, reflecting a market that includes global conglomerates, regional specialists, and a long tail of local assemblers. Competition increasingly hinges on software-platform capabilities and channel partnerships rather than hardware specs alone.

Company Est. Revenue Share Range Key Offerings Strategic Positioning
Signify (Philips Lighting) 8–12% Interact IoT platform, Philips Hue, professional luminaires Platform-led ecosystem; largest global footprint
Acuity Brands 5–8% Atrius IoT, commercial and industrial luminaires North America–focused controls integration
ams-OSRAM 4–7% LED components, automotive and specialty lighting Component-level innovation; vertical integration
Cree Lighting (IDEAL Industries) 3–6% High-bay, troffer, and outdoor LED fixtures Value-tier commercial segment strength
Zumtobel Group 2–4% Tridonic drivers, premium architectural luminaires European specification market; design-led
Hubbell Incorporated 2–4% Industrial and hazardous-location LED solutions Utility and heavy-industrial channel depth
Eaton Lighting 2–4% Commercial and residential LED fixtures, controls Broad electrical-distribution ecosystem
Nichia Corporation 3–5% LED chips, phosphor technology Upstream component leader; IP portfolio
Current (GE Lighting) 2–4% Daintree IoT, commercial and municipal luminaires Smart-building platform transition
Savant (formerly GE Consumer) 1–3% Consumer LED lamps, smart-home integration Retail and e-commerce channel presence


Recent News & Developments

  • Luminii- (July 8, 2026)--The company acquired Filix Lighting, a Croatian manufacturer, to expand its expertise into marine/underwater lighting and strengthen its European and Middle Eastern presence.
  • LEDVANCE- (July 2026)--The company officially partnered with FC Bayern Munich, becoming the club's lighting partner to integrate advanced, energy-efficient LED lighting solutions across their facilities.
  • Sustainder- (July 2026)--The company launched the Avance modular street lighting system, an initiative designed to provide scalable and upgradeable smart lighting infrastructure for modern city projects.


LED Lighting Market Report Scope

Parameter Detail
Market Scope Global LED Lighting Market — lamps, luminaires, controls, and associated services
Study Period 2021–2035
CAGR (Forecast Window) 6.0% (2026–2035)
Base-Year Market Size USD 112.30 Billion (2025)
Forecast-End Market Size USD 201.12 Billion (2035)
Fastest Growing Segment Outdoor end-user segment (9.2% CAGR)
Companies Profiled 10 (Signify, Acuity Brands, ams-OSRAM, Cree Lighting, Zumtobel, Hubbell, Eaton, Nichia, Current, Savant)
Valuation Currency USD Billion


FAQs

How do LED total-cost-of-ownership calculations differ for retrofit versus new-build projects?
Retrofit projects carry removal and disposal costs for legacy fixtures, adding 15–25% to labor budgets compared with new-build installations that specify LED from the design stage [6]. New-build projects benefit from optimized wiring layouts that lower driver and dimming infrastructure expenses.
What procurement strategies help municipal buyers avoid vendor lock-in on smart LED street-lighting platforms?
Municipalities should mandate Zhaga-D4i-compliant luminaires, which allow sensor and driver modules to be swapped between manufacturers [14]. Open-protocol specifications in tender documents preserve competitive bidding across future upgrade cycles.
How does phosphor supply-chain concentration affect LED pricing stability?
China controls roughly 85% of rare-earth phosphor production, creating single-source risk for color-rendering quality [15]. Buyers can hedge by qualifying dual-source luminaire suppliers and negotiating fixed-price contracts of 12–18 months.
What differentiates lighting-as-a-service contracts from traditional equipment leases?
LaaS bundles fixtures, installation, maintenance, monitoring, and energy-performance guarantees into a single monthly payment, unlike leases that transfer maintenance risk to the buyer [17]. LaaS providers absorb technology-obsolescence risk, making upgrades economically neutral for the building owner.
How do tunable-white LED fixtures impact occupant productivity in office environments?
Studies by the Lighting Research Center show that dynamic correlated color temperature adjustments between 3,000 K and 6,500 K improve alertness scores by 10–15% during afternoon hours [2]. The incremental fixture premium typically ranges from 20–30% over static-white equivalents.
What minimum certifications should specifiers require when sourcing LED products for healthcare facilities?
Healthcare LED fixtures should carry UL 1598 safety listing, FCC Part 15 EMI compliance, and IEC 62471 photobiological safety classification at the exempt or risk-group-0 level [10]. Flicker performance below 1% at 100 Hz is essential for patient-care and surgical environments.
How does Samsung's LED chip exit reshape upstream supply dynamics?
Samsung's withdrawal removes an estimated 8–10% of global mid-power LED chip capacity by 2030, shifting volume toward Nichia, Seoul Semiconductor, and Lumileds [16]. Downstream luminaire OEMs should diversify chip sourcing now to avoid allocation shortfalls during the transition.    
Author
Author
Author Profile
Ankit Gupta LinkedIn
Team Lead - Research
Ankit Gupta is a seasoned market intelligence and strategic research professional with over six plus years of experience in the ICT and Semiconductor industries. With academic roots in Telecom, Marketing, and Electronics, he blends technical insight with business strategy. Ankit has led 200+ projects, including work for Fortune 500 clients like Microsoft and Rio Tinto, covering market sizing, tech forecasting, and go-to-market strategies. Known for bridging engineering and enterprise decision-making, his insights support growth, innovation, and investment planning across diverse technology markets.

Research Approach


Secondary Research

The secondary research process involved comprehensive analysis of regulatory databases, industry publications, technical standards, and authoritative energy organizations. Key sources included the US Department of Energy (DOE) Office of Energy Efficiency & Renewable Energy, Environmental Protection Agency (EPA) Energy Star Program, International Energy Agency (IEA), International Electrotechnical Commission (IEC), Illuminating Engineering Society (IES), International Association of Lighting Designers (IALD), Lighting Research Center (LRC), US Energy Information Administration (EIA), European Commission Ecodesign Directive & Energy Labelling Framework, China National Institute of Standardization (CNIS), Bureau of Indian Standards (BIS), National Electrical Manufacturers Association (NEMA), American Lighting Association (ALA), Global Lighting Association (GLA), and national energy ministry reports from key markets. These sources were used to collect energy efficiency regulations, product standards compliance data, technological advancement studies, installation statistics, and market landscape analysis for lamps, luminaries, new installations, and retrofit applications.


Primary Research

To gather both qualitative and quantitative insights, supply-side and demand-side stakeholders were interviewed during the primary research phase. CEOs, VPs of Product Development, heads of research and development, and supply chain directors from LED chip, lighting fixture, and OEM companies were examples of supply-side sources. Demand-side sources included facility managers from retail chains and industrial complexes, sustainability officers from corporate businesses, electrical contractors, lighting designers, and procurement managers from commercial real estate developers. Market segmentation was established, adoption timetables for smart lighting technologies were confirmed, and information on pricing tactics, installation patterns, and regulatory compliance dynamics was obtained through primary research.

Primary Respondent Breakdown:

By Designation: C-level Primaries (42%), Director Level (25%), Others (33%)

By Region: North America (32%), Europe (29%), Asia-Pacific (31%), Rest of World (8%)


Market Size Estimation

Global market valuation was derived through revenue mapping and installation volume analysis. The methodology included:

Identification of 50+ key manufacturers across North America, Europe, Asia-Pacific, and Latin America

Product mapping across LED lamps, LED luminaries, new installation projects, and retrofit conversion categories

Analysis of reported and modeled annual revenues specific to LED lighting portfolios

Coverage of manufacturers representing 72-77% of global market share in 2024

Extrapolation using bottom-up (installation volume × ASP by country/region) and top-down (manufacturer revenue validation) approaches to derive segment-specific valuations for indoor lighting, outdoor lighting, store-based distribution, and non-store-based channels

Download Free Sample

Kindly complete the form below to receive a free sample of this Report

Download PDF ×

We do not share your information with anyone. However, we may send you emails based on your report interest from time to time. You may contact us at any time to opt-out.
















