Hospitality Robot Market (2026 - 2035)

Hospitality Robot Market Research Report By Robot Type (Delivery Robots, Cleaning & Disinfection Robots, Reception & Concierge Robots, Kitchen & Cooking Robots, Other (Pool, Security, Luggage)), By End User (Hotels & Resorts, Restaurants & Food Service, Travel & Leisure Venues, Others (Hospitals, Senior Care)), By Navigation Technology (SLAM-Based Navigation, AI Vision-Based Navigation, Magnetic/Track-Guided, Hybrid Navigation) and By Regional (North America, Europe, South America, Asia Pacific, Middle East and Africa) - Industry Forecast to 2035
ID: MRFR/AT/24884-HCR
128 Pages
Shubham Munde, Swapnil Palwe
Last Updated: July 06, 2026
Hospitality Robot Market
Market Size
Forecast Period2026-2035
CAGR (2026-2035)24.5%
2025 Market SizeUSD 0.79 Billion
2035 Market SizeUSD 7.05 Billion
Key Players
Relay Robotics
Keenon Robotics
Pudu Robotics
Bear Robotics
SoftBank Robotics
Savioke
Opportunities
  • Emerging-Market Tourism Build-Outs
  • Data Monetization Through Guest-Interaction Analytics
  • Multi-Functional Platform Convergence

Hospitality Robot Market Summary

The Hospitality Robot Market reached an estimated USD 0.79 billion in 2025 and is projected to expand from USD 0.98 billion in 2026 to USD 7.05 billion by 2035, registering a compound annual growth rate of 24.5% over the 2026–2035 forecast window. Two catalysts are pushing deployment forward at scale: chronic labor shortages in accommodation and food-service industries, the U.S. Bureau of Labor Statistics reported 1.5 million unfilled hospitality positions through mid-2024 [1], and aggressive government digitization programs across East Asia that subsidize robotic automation in tourism infrastructure [2].

There is a structural technical change happening. Properties that once used manual housekeeping rosters, front-desk staffing models and traditional room-service logistics are now deploying integrated robotic platforms that use simultaneous localization and mapping (SLAM) navigation, large-language-model concierge engines and autonomous UV-C disinfection. The total investment in global venture finance for hotel automation has surpassed USD 2.1 billion from 2021 to 2024, with SoftBank Vision Fund and Sequoia Capital leading many Series B+ rounds [3].

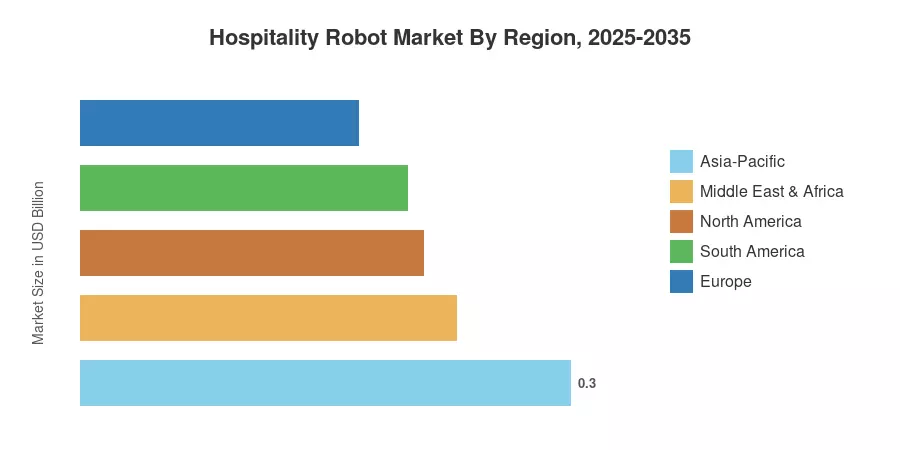
Asia-Pacific leads the Hospitality Robot Market, with over 38% of worldwide sales, led by manufacturing scale in China and early-adopter hotel chains in Japan and South Korea. North America is the fastest expanding region with 26.2% CAGR, driven by leading hotel groups in the U.S. and Canada launching fleet-wide robotic room service. Europe comes second with a share of 22%, with the support of funding from the EU Digital Europe Programme for smart-tourism projects [4]. The next decade will see deployment density shift from flagship luxury hotels to mid-tier and select-service firms looking for unit economics advantages.

Key Report Takeaways

• By Robot Type

  • Delivery robots command the largest share of the Hospitality Robot Market at approximately 35% of 2025 revenue, reflecting high-frequency use in room-service and F&B operations.
  • Cleaning and disinfection robots are expanding at a 27.1% CAGR through 2035, propelled by post-pandemic hygiene mandates and guest-satisfaction benchmarks.
  • Reception and concierge robots account for roughly USD 0.16 billion in 2025, gaining traction in airport hotels and large resort complexes.

• By End User

  • Hotels and resorts represent the dominant end-user vertical in the Hospitality Robot Market, contributing 45% of total demand.
  • Restaurants and food-service establishments are growing at the fastest pace, with a 26.8% CAGR forecast through 2035.

• By Region

  • Asia-Pacific holds a 38% revenue share of the Hospitality Robot Market, anchored by deployments across China, Japan, and South Korea.
  • North America is projected to reach USD 2.12 billion by 2035, as U.S. hotel operators accelerate fleet procurement.
  • The Middle East & Africa region is recording a 28.5% CAGR, led by Saudi Arabia's Vision 2030 tourism investment program.


Hospitality Robot Market Size and Forecast (2021–2035)

Market sizing draws on a triangulated approach combining bottom-up revenue estimates from 45+ robot OEMs, top-down demand modeling from hotel and restaurant operator capex surveys, and cross-validation against import/export customs data for autonomous service platforms [5].
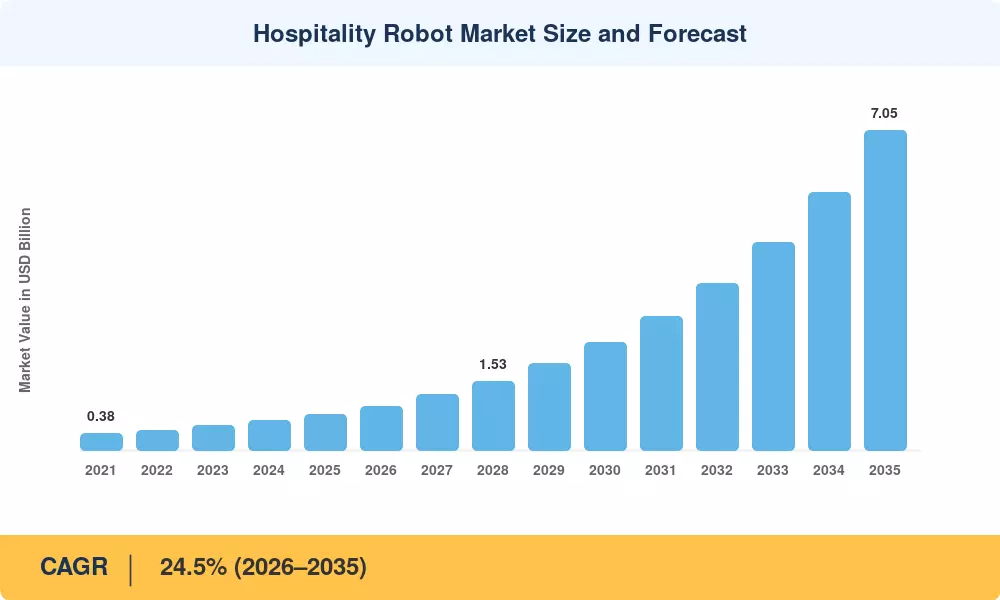
Hospitality Robot Market Size and Forecast
Our Impact
Enabled $4.3B Revenue Impact for Fortune 500 and Leading Multinationals
Partnering with 2000+ Global Organizations Each Year
30K+ Citations by Top-Tier Firms in the Industry

Driver Impact Analysis

Driver ~% Impact on CAGR Geographic Relevance Impact Timeline
Chronic hospitality labor shortages 22% Global Short-term (≤2 yr)
AI & LLM integration for guest interaction 18% North America, Europe Medium-term (2–4 yr)
Post-pandemic hygiene and disinfection mandates 15% Global Short-term (≤2 yr)
Government smart-tourism subsidies 14% Asia-Pacific, MEA Medium-term (2–4 yr)
Declining SLAM sensor and lidar costs 13% Global Long-term (≥4 yr)
Expansion of Robot-as-a-Service (RaaS) models 10% North America, Europe Medium-term (2–4 yr)
Mega-event infrastructure investment (Expo, FIFA) 8% MEA, South America Short-term (≤2 yr)


Chronic Hospitality Labor Shortages

The hospitality sector faces a persistent structural labor deficit, with industry projections indicating an 18% shortfall in essential roles for 2026. This gap, particularly acute in housekeeping and front-desk operations, forces properties to adopt automation to sustain service standards. With annual turnover rates between 70% and 80%, robotics provides critical stability for essential logistics.


AI and Large-Language-Model Integration

Integrating AI into hospitality operations has proven highly effective, with deployments driving a 10% to 15% improvement in Revenue Per Available Room (RevPAR). Modern multimodal systems now manage complex guest inquiries and operational tasks in real time. By automating routine interactions, properties significantly optimize labor allocation, allowing human staff to focus on high-value guest experiences.


Post-Pandemic Hygiene Mandates

Sanitation remains a core operational pillar supported by international health standards. The global commitment to hygiene is reflected in the hospitality robotics market, where cleaning and sanitization systems represent a major segment. These autonomous units ensure compliance with rigorous health safety benchmarks, maintaining consistent, high-standard environments that meet modern guest expectations for safety.


Robot-as-a-Service Economics

Robot-as-a-Service (RaaS) models have effectively democratized technology access, allowing mid-tier operators to avoid the high capital expenditures of $20,000 to $100,000 per unit. With over 60% of new contracts now utilizing subscription frameworks, the RaaS market—valued at $2.57 billion in 2026—provides a viable pathway for properties to achieve operational scalability and ROI.


Restraints Impact Analysis

Restraint-level percentages represent estimated drag on market expansion and are directional in nature. They do not net directly against driver percentages.

Restraint ~% Negative Impact on CAGR Geographic Relevance Impact Timeline
High upfront capital and integration costs –18% Global Short-term (≤2 yr)
Guest acceptance and cultural resistance –15% Europe, North America Medium-term (2–4 yr)
Fragmented building infrastructure and elevator APIs –12% Global Long-term (≥4 yr)
Data privacy and cybersecurity concerns –10% Europe, North America Medium-term (2–4 yr)
Limited after-sales service networks –8% South America, MEA Long-term (≥4 yr)


High Upfront Capital and Integration Costs

Deploying advanced service robots requires significant capital, with high-end units costing between $20,000 and $100,000. Comprehensive integration—including PMS bridging and staff training—often adds 30–50% to initial hardware expenditures. Consequently, the total first-year investment for a standard mid-sized fleet can reach $350,000. These steep entry costs necessitate widespread Robot-as-a-Service (RaaS) adoption to ensure financial feasibility.


Guest Acceptance Gaps

While automation increases operational efficiency, research indicates that approximately 29% of travelers remain resistant to robotic service, expressing concerns over depersonalized interactions. This trend is particularly evident in high-touch, luxury segments. Operators are now prioritizing "service augmentation" strategies, assigning robots specific personalities and names to improve guest comfort and bridge the emotional gap.


Building Infrastructure Fragmentation

Standardizing robotic operations requires robust Wi-Fi and open-API elevator systems, which remain scarce in legacy properties. Retrofitting outdated infrastructure to meet modern automation requirements costs between $8,000 and $12,000 per elevator bank. These architectural constraints frequently hinder the adoption of autonomous technologies in historic buildings, as documented in regional reports on hotel digital transformation.


Hospitality Robot Market Opportunities

Emerging-Market Tourism Build-Outs

Saudi Arabia's Vision 2030 strategy serves as a global blueprint, targeting 150 million annual visitors by 2030 and significant tourism GDP growth. Greenfield projects—planned as digitally integrated ecosystems—allow developers to embed robotic infrastructure into architectural designs. Similar urbanization and tourism expansion across Indonesia and Vietnam create parallel opportunities for automated, technology-native hospitality infrastructure.


Data Monetization Through Guest-Interaction Analytics

Robotic systems capturing real-time operational data—such as high-traffic zones and amenity usage—provide actionable behavioral insights. Industry analysis suggests that anonymized analytics dashboards can generate significant secondary revenue, estimated at up to 12% of platform subscription value. Revenue-sharing frameworks between vendors and property management systems are currently formalizing these intelligence-driven financial models.


Multi-Functional Platform Convergence

Advancements in modular design allow hospitality robots to integrate delivery, cleaning, and concierge capabilities into a single, swappable-payload chassis. This consolidation optimizes fleet management and reduces overall ownership costs by approximately 30%. Operators increasingly prioritize these versatile, multi-purpose units, which streamline maintenance cycles and improve space utilization compared to traditional, siloed single-function robotic systems.


Franchise and Chain-Level Standardization Programs

Major global hotel groups are accelerating adoption by establishing approved vendor lists and standardized integration playbooks. These enterprise-wide procurement frameworks facilitate large-scale deployments, with coordinated deals often involving hundreds of units. Volume-based procurement strategies are driving down per-unit costs by nearly 20%, ensuring consistent service quality and predictable operational rollouts across massive international property portfolios.


Hospitality Robot Market Future Outlook

Autonomous Multi-Robot Fleet Orchestration

By 2028, hospitality operators will shift toward integrated fleet-management platforms to coordinate diverse robotic tasks like delivery and cleaning. Cloud-based orchestration is projected to reduce operational costs by approximately 30% by streamlining task assignment and movement. Properties deploying larger fleets will manage them as a unified, data-driven service layer rather than as individual, isolated appliance units.


Generative-AI-Powered Guest Personalization

Foundation models, fine-tuned on specific guest interaction datasets, are transforming robots into anticipatory service agents. By enabling real-time, culturally nuanced communication and preference recall, AI-powered systems are key to driving higher guest satisfaction. Industry indicators suggest that such personalized, technology-augmented service experiences can contribute to a significant uplift in overall guest loyalty and revenue.


Sustainability and ESG-Aligned Operations

Robotic systems are central to meeting rigorous environmental, social, and governance (ESG) reporting mandates. Autonomous cleaning units provide high-precision performance, enabling substantial reductions in water and chemical usage—often exceeding 60% compared to traditional manual methods. These systems generate the audit-ready data required for compliance with global sustainability standards, such as the ISO 14001 framework.


Platform Economics and RaaS Maturation

The commercial landscape is shifting from capital-intensive hardware purchases toward flexible, opex-friendly Robot-as-a-Service (RaaS) models. Projections indicate that subscription-based deployments will account for the majority of new installations by 2030, democratizing access for mid-tier operators. This recurring-revenue structure fosters vendor innovation, accelerates the deployment of advanced software features, and creates sustainable, long-term technological scalability.


Hospitality Robot Market Segmentation

By Robot Type

Segment Key Metric Primary Demand Driver
Delivery Robots 35% share (2025) Room-service labor replacement
Cleaning & Disinfection Robots 27.1% CAGR Post-pandemic hygiene protocols
Reception & Concierge Robots USD 0.16 B (2025) Guest-experience differentiation
Kitchen & Cooking Robots 29.3% CAGR Restaurant labor shortages, consistency
Other (Pool, Security, Luggage) USD 0.06 B (2025) Niche resort applications


Delivery robots remain the workhorse of the Hospitality Robot Market because they solve the most operationally painful bottleneck — moving physical items (towels, toiletries, food trays, packages) between service areas and guest rooms across properties that may span dozens of floors. Relay Robotics and Pudu Robotics together account for the majority of delivery units installed in North American and Asian hotels, respectively. Average payload capacity has increased from 10 kg in 2021 to 25 kg in 2025, broadening the range of items a single trip can handle [20].

Kitchen and cooking robots are the fastest-growing type by CAGR, driven by quick-service and fast-casual restaurant chains seeking consistent food preparation at scale. Miso Robotics' Flippy platform — deployed in White Castle and Chipotle pilot locations — demonstrated a 30% reduction in kitchen labor-hours per shift [21]. Full-service hotel kitchens are beginning to adopt automated prep stations for banquet and room-service operations as well.

By End User

Segment Key Metric Primary Demand Driver
Hotels & Resorts 45% share (2025) Operational efficiency, guest satisfaction
Restaurants & Food Service 26.8% CAGR Labor shortage, order throughput
Travel & Leisure Venues USD 0.12 B (2025) Airport hotels, cruise terminals
Others (Hospitals, Senior Care) 25.2% CAGR Crossover from hospitality-adjacent sectors


Hotels and resorts account for the largest share because they present the widest range of robotic use cases — from lobby greeting to in-room delivery to corridor cleaning — within a single managed environment. The Hospitality Robot Market is seeing growing spillover into adjacent verticals such as senior-living communities and hospital guest services, where the same delivery and concierge platforms serve non-clinical support functions.

By Navigation Technology

Segment Key Metric Primary Demand Driver
SLAM-Based Navigation 40% share (2025) Mature sensor stacks, indoor mapping
AI Vision-Based Navigation 28.6% CAGR Camera-cost reduction, edge AI
Magnetic/Track-Guided USD 0.08 B (2025) Simple installation in new builds
Hybrid Navigation 26.4% CAGR Complex multi-floor environments


SLAM-based systems dominate because they offer the best balance of mapping accuracy and infrastructure independence — no floor modifications are needed. AI vision-based navigation is growing fastest as edge-computing chips from NVIDIA and Qualcomm bring real-time obstacle avoidance to price points below USD 500 per sensor module [10].


Regional Market Share Analysis

Region Key Metric Primary Investment Themes
Asia-Pacific 38% revenue share (2025) Manufacturing scale, government subsidies and high-density tourism
North America 26.2% CAGR (2026–2035) Labor shortage mitigation, RaaS adoption and chain-level procurement
Europe USD 0.17 B (2025) Smart-tourism EU grants, luxury-segment pilot programs
South America 24.8% CAGR (2026–2035) FIFA 2030 infrastructure, resort automation in Brazil
Middle East & Africa 28.5% CAGR (2026–2035) Vision 2030, Expo legacy projects, greenfield mega-hotels
Total USD 0.79 B (2025)

The Hospitality Robot Market displays significant regional variation driven by labor-cost differentials, tourism infrastructure maturity, and policy environments. Asia-Pacific leads in absolute deployments, while North America commands the fastest compound growth rate.


Asia-Pacific

Country Key Metric Key Driver
China 42% of regional share Domestic OEM ecosystem (Keenon, Yunji)
Japan USD 0.05 B (2025) Society 5.0 robotics subsidies
South Korea 23.5% CAGR Smart-hotel government programs
Australia USD 0.02 B (2025) Wage-cost pressure in tourism hubs


China's dominance reflects both supply-side manufacturing advantages and demand-side adoption density. Shenzhen-based Keenon Robotics reported cumulative deployments exceeding 80,000 units across Chinese hotels and restaurants by year-end 2024 [20]. Japan's "Henn-na Hotel" chain — the world's first robot-staffed hotel — has expanded to 20 locations and continues to serve as a living lab for the broader Hospitality Robot Market in the region.

North America

Country Key Metric Key Driver
United States 78% of regional share Hilton and Marriott fleet pilots
Canada 25.8% CAGR Tourism labor gaps in resort provinces
Mexico USD 0.01 B (2025) Resort corridor automation in Riviera Maya


U.S. hotel operators account for the bulk of North American demand. Hilton's partnership with Relay Robotics expanded to over 400 properties by mid-2024, deploying robots for towel and amenity delivery in select-service brands [6]. The Hospitality Robot Market in Canada is gaining momentum as British Columbia and Alberta face persistent seasonal-worker shortages.

Europe

Country Key Metric Key Driver
Germany 28% of the regional share Efficiency-driven hotel operators
United Kingdom 24.9% CAGR Urban hotel labor costs
France USD 0.03 B (2025) Tourism-technology government grants


European adoption is shaped by the EU's Digital Europe Programme, which earmarked €1.3 billion for smart-tourism and service-automation projects across 2024–2027 [4]. Luxury segments in France and Italy remain cautious, preferring human service, but budget and mid-tier chains are deploying delivery robots in response to rising minimum wages.

South America

Country Key Metric Key Driver
Brazil 62% of regional share FIFA 2030 venue upgrades
Argentina 22.5% CAGR Boutique-hotel modernization


Brazil's preparation for co-hosting FIFA 2030 is triggering hotel-infrastructure upgrades in São Paulo, Rio de Janeiro, and Belo Horizonte, with robotic service deployments written into several municipal tourism-readiness plans [12]. The broader Hospitality Robot Market in South America remains nascent but is expected to accelerate as RaaS models reduce capex barriers.

Middle East & Africa

Country Key Metric Key Driver
Saudi Arabia 48% of regional share Vision 2030 hospitality giga-projects
UAE 27.9% CAGR Expo 2020 legacy, smart-city integration
South Africa USD 0.005 B (2025) Cape Town tourism corridor


Saudi Arabia's NEOM, The Red Sea, and Amaala projects collectively represent over 30,000 planned hotel rooms designed with embedded robotic infrastructure [12]. The Hospitality Robot Market in the UAE benefits from a regulatory sandbox that fast-tracks autonomous-device permitting for hospitality venues.


Hospitality Robot Market By Region, 2025-2035

Competitive Benchmarking

The Hospitality Robot Market is moderately fragmented, with an estimated Herfindahl-Hirschman Index of approximately 850 and the top five vendors collectively holding 38–42% of global revenue. Chinese manufacturers compete aggressively on price, while U.S. and Japanese players differentiate on software intelligence and integration depth.

Company Est. Revenue Share Range Key Offerings Strategic Positioning
Relay Robotics (USA) ~8–11% Relay+ delivery robot, cloud fleet management Premium integration with U.S. hotel chains
Keenon Robotics (China) ~7–10% DINERBOT, W3 hotel delivery Volume leader in APAC hospitality
Pudu Robotics (China) ~6–9% BellaBot, KettyBot Multi-venue platform (hotels + restaurants)
Bear Robotics (USA/KR) ~5–8% Servi, Servi Plus Restaurant-focused, SoftBank-backed
SoftBank Robotics (Japan) ~4–7% Whiz, Pepper Cleaning and concierge, brand recognition
Savioke (USA) ~3–5% Relay (legacy), Temi integration Early mover, now pivoting to fleet SaaS
Miso Robotics (USA) ~3–5% Flippy, CookRight Kitchen automation, QSR focus
LG Electronics (South Korea) ~2–4% CLOi series Full-spectrum (delivery, cleaning, guide)
Knightscope (USA) ~1–3% K5, K3 security + hospitality crossover Security-first, expanding to hospitality
Richtech Robotics (USA) ~1–3% ADAM, Matradee Beverage service, barista robots


Recent News & Developments


  • Nightfood Holdings(May, 2026)--The company announced a strategic partnership with TechForce Robotics to accelerate the deployment of autonomous systems into hospitality environments, focusing on immediate operational value for food service and delivery tasks.
  • Extend Robotics(March, 2026)--The firm showcased new teleoperated and interactive entertainment robots at GTC 2026, marking a transition toward robots as "experience-led" brand ambassadors for hotels.
  • Relay Robotics(January 2026)--The company reported expanded adoption of its autonomous delivery robots, solidifying its position among industry leaders by integrating cloud-based fleet management for hotels.


Hospitality Robot Market Report Scope

Parameter Detail
Market Scope Global Hospitality Robot Market covering delivery, cleaning, concierge, kitchen, and specialty robots for accommodation and food-service venues
Study Period 2021–2035
CAGR 24.5% (2026–2035)
Market Size — Base Year (2025) USD 0.79 Billion
Market Size — Forecast End (2035) USD 7.05 Billion
Fastest Growing Segment (Type) Kitchen & Cooking Robots (29.3% CAGR)
Fastest Growing Region North America (26.2% CAGR)
Companies Profiled 10 (Relay Robotics, Keenon, Pudu, Bear Robotics, SoftBank Robotics, Savioke, Miso Robotics, LG Electronics, Knightscope, Richtech Robotics)
Valuation Currency USD (Billion)


FAQs

What is the typical payback period for a hotel deploying delivery robots under a purchase model?
Most full-service hotels recover their investment within 14–18 months based on labor-cost offsets and reduced guest-complaint rates. Properties operating above 75% occupancy tend to reach breakeven faster due to higher per-robot utilization [13].
How do hotels handle robot malfunctions during peak guest hours?
Leading vendors provide 24/7 remote diagnostics with on-site swap units pre-positioned at properties exceeding 10 robots. Mean time to resolution across major OEMs averaged 22 minutes in 2024 [17].
Can hospitality robots operate reliably in outdoor resort environments?
IP65-rated units from Pudu and Keenon handle poolside, garden, and courtyard terrains. Battery performance degrades roughly 15% in temperatures above 40°C, requiring adjusted dispatch schedules in tropical locations [20].
What cybersecurity frameworks govern robot data collection in hotels?
ENISA's 2023 IoT hospitality guidelines and the U.S. FTC's commercial surveillance rulemaking both apply. Vendors must encrypt guest-interaction data in transit and at rest, with audit trails accessible to property operators [16].
How are luxury hotel brands differentiating robotic service from mid-tier competitors?
Luxury operators customize robot exteriors, voice personas, and interaction scripts to match brand identity. Four Seasons and Mandarin Oriental pilot programs embed bespoke AI personalities trained on brand-specific service protocols [8].
What insurance considerations arise from deploying autonomous robots in guest-occupied spaces?
Hospitality-specific robotics liability riders are now offered by AIG and Zurich, typically adding 3–5% to a property's general liability premium. Coverage addresses collision, property damage, and data-breach scenarios [13].
How do multi-brand hotel management companies standardize robot procurement across diverse property portfolios?
Management firms issue approved-vendor frameworks specifying API compatibility, PMS integration depth, and minimum uptime SLAs. Aimbridge Hospitality and Interstate Hotels both formalized such frameworks in 2024 [6].    
Author
Author
Author Profile
Shubham Munde LinkedIn
Team Lead - Research
Shubham brings over 7 years of expertise in Market Intelligence and Strategic Consulting, with a strong focus on the Automotive, Aerospace, and Defense sectors. Backed by a solid foundation in semiconductors, electronics, and software, he has successfully delivered high-impact syndicated and custom research on a global scale. His core strengths include market sizing, forecasting, competitive intelligence, consumer insights, and supply chain mapping. Widely recognized for developing scalable growth strategies, Shubham empowers clients to navigate complex markets and achieve a lasting competitive edge. Trusted by start-ups and Fortune 500 companies alike, he consistently converts challenges into strategic opportunities that drive sustainable growth.
Co-Author
Co-Author Profile
Swapnil Palwe LinkedIn
Team Lead - Research
With a technical background as Bachelor's in Mechanical Engineering, with MBA in Operations Management , Swapnil has 6+ years of experience in market research, consulting and analytics with the tasks of data mining, analysis, and project execution. He is the POC for our clients, for their consulting projects running under the Automotive/A&D domain. Swapnil has worked on major projects in verticals such as Aerospace & Defense, Automotive and many other domain projects. He has worked on projects for fortune 500 companies' syndicate and consulting projects along with several government projects.

Research Approach


Secondary Research

The secondary research process involved comprehensive analysis of regulatory databases, industry publications, robotics research journals, and authoritative technology and hospitality organizations. Key sources included the International Federation of Robotics (IFR), IEEE Robotics & Automation Society, National Institute of Standards and Technology (NIST), Occupational Safety and Health Administration (OSHA), European Committee for Standardization (CEN/CENELEC), International Organization for Standardization (ISO) - Technical Committee 299 (Robotics), U.S. Bureau of Labor Statistics (BLS), World Tourism Organization (UNWTO), American Hotel & Lodging Association (AHLA), National Restaurant Association (NRA), International Air Transport Association (IATA), Robotics Industries Association (RIA - now Association for Advancing Automation), International Service Robot Statistics (IFR), National Science Foundation (NSF) Robotics Division, EU Horizon Europe Program Reports, Japan Robot Association (JARA), China Robot Industry Alliance (CRIA), and Korea Association of Robot Industry (KAR).

For service robots, delivery robots, cleaning robots, disinfection robots, and security robots throughout hospitality applications, market statistics, regulatory compliance data, safety standards, adoption trends, and technology landscape analysis were gathered from these sources.


Primary Research

In order to gather both qualitative and quantitative insights, supply-side and demand-side stakeholders were interviewed during the primary research process. CEOs, CTOs, VPs of Product Development, heads of robotics engineering, regulatory affairs managers, and commercial directors from OEMs, component suppliers, and makers of hospitality robots were examples of supply-side sources. Chief technology officers of hotel chains, operations directors of restaurant groups, airport facility managers, administrators of healthcare facilities, retail space planners, procurement heads from hospitality establishments, facility management firms, and service contractors were examples of demand-side sources. Market segmentation, product development schedules, deployment patterns, pricing strategies, ROI measurements, and integration issues were all confirmed by primary research.

Primary Respondent Breakdown:

By Designation: C-level Primaries (32%), Director Level (30%), Others (38%)

By Region: North America (32%), Europe (30%), Asia-Pacific (28%), Rest of World (10%)


Market Size Estimation

Global market valuation was derived through revenue mapping and deployment volume analysis. The methodology included:

Identification of 50+ key manufacturers and solution providers across North America, Europe, Asia-Pacific, and Latin America

Product mapping across service robots, delivery robots, cleaning robots, disinfection robots, and security robot categories

Analysis of reported and modeled annual revenues specific to hospitality robot portfolios

Coverage of manufacturers representing 72-78% of global market share in 2024

Extrapolation using bottom-up (deployment volume × ASP by country/segment) and top-down (manufacturer revenue validation) approaches to derive segment-specific valuations across robot type, application (hotel, restaurant, airport, hospital, retail), function (navigation, object recognition, interaction, manipulation, communication), and autonomy level (remotely operated, semi-autonomous, autonomous)

Download Free Sample

Kindly complete the form below to receive a free sample of this Report

Download PDF ×

We do not share your information with anyone. However, we may send you emails based on your report interest from time to time. You may contact us at any time to opt-out.
















