Robotics Market (2026 - 2035)

Robotics Market Size, Share and Research Report By Type (Autonomous Mobile Robots (AMRs), Automated Guided Vehicles (AGVs), Articulated Robots, Humanoids, Collaborative Robots (Cobots) and Others), By Environment (Aerial, Ground and Marine) By Mobility (Mobile Robotics and Fixed Robotics) By Application (Material Handling, Assembling & Disassembling, Welding & Soldering, Dispensing & Processing, Security & Inspection, Cleaning & Sanitization, Personal Assistance and Others), By End User (Domestic/Household, Industrial, Medical & Healthcare, Farming and Agriculture, Retail and Hospitality, Logistics & Warehousing, Military & Defense, Construction & Infrastructure, Marine, Education, Sports & Entertainment and Others), And By Region (North America, Europe, Asia-Pacific, Middle East & Africa, and South America) –Industry Forecast Till 2035
ID: MRFR/SEM/3310-CR
284 Pages
Nirmit Biswas, Aarti Dhapte
Last Updated: July 02, 2026
Robotics Market
Market Size
Forecast Period2026-2035
CAGR (2026-2035)18.2%
2025 Market SizeUSD 79.10 Billion
2035 Market SizeUSD 421.10 Billion
Key Players
Fanuc Corporation
ABB Ltd
KUKA AG
Yaskawa Electric
Universal Robots
Intuitive Surgical
Opportunities
  • Robot-as-a-Service and Subscription Models
  • Surgical and Rehabilitation Robotics
  • Emerging-Market Agricultural Automation

Robotics Market Summary

The global Robotics Market reached USD 79.10 Billion in 2025 and is projected to climb from USD 93.50 Billion in 2026 to USD 421.10 Billion by 2035, registering an 18.2% CAGR across the forecast window. Structural labor shortages across OECD economies, combined with government-backed reshoring mandates such as the U.S. CHIPS and Science Act and the EU Horizon Europe robotics allocations exceeding EUR 2.3 Billion, are converting automation from a discretionary upgrade into a strategic imperative [1][2]. This Robotics Market expansion is not cyclical — it reflects a permanent recalibration of how goods are manufactured, moved, and maintained.

A generational technology shift underpins the growth. Legacy fixed-sequence industrial arms are giving way to sensor-rich, AI-enabled platforms capable of real-time decision-making. Robot-as-a-Service (RaaS) contracts have lowered entry barriers for small and mid-sized enterprises, while component cost deflation — servo motor prices dropped roughly 14% between 2022 and 2024 — continues to improve unit economics [3]. Software intelligence now commands a rising share of total system value, unlocking recurring revenue for vendors that pair hardware with cloud-based analytics.

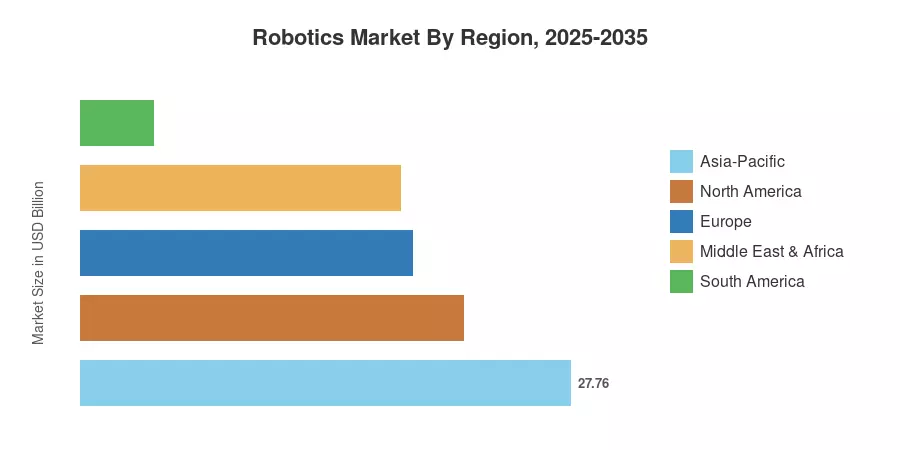
Asia-Pacific dominates the Robotics Market with an estimated 35.1% revenue share, anchored by China's installed base of over 1.5 million operational units and Japan's leadership in precision assembly robots [4]. The Middle East & Africa region is expanding fastest at a 22.9% CAGR, fueled by sovereign-wealth diversification programs in Saudi Arabia and the UAE. Europe holds the second-largest share at approximately 23.8%, supported by Germany's Industrie 4.0 framework and accelerating adoption in food-processing automation. The decade ahead will test whether supply chains can deliver enough skilled integrators to match surging demand.


Key Report Takeaways

• By Robot Type

  • Industrial robots captured 66.2% of the Robotics Market revenue share in 2025, driven by automotive and electronics assembly demand.
  • Collaborative robots are on track to register a 23.8% CAGR through 2035 as safety-rated designs open new floor-plan configurations for SMEs.


• By Component

  • Hardware accounted for 58.7% of total Robotics Market value in 2025, though software is emerging as the fastest-growing component at a 21.3% CAGR.
  • Services — spanning integration, maintenance, and training — represent the stickiest revenue layer for OEMs.

• By Application

  • Logistics and warehousing held a 36.4% share of the Robotics Market in 2025, reflecting the e-commerce fulfilment build-out.
  • Medical and surgical robotics are advancing at a 23.1% CAGR, propelled by minimally invasive procedure adoption.

• By End-User Industry

  • Automotive led end-user segments with a 26.8% share in 2025.
  • Healthcare providers are forecast to expand at a 23.2% CAGR, the fastest among all end-user verticals.

• By Region

  • Asia-Pacific commanded 35.1% of the global Robotics Market share in 2025.
  • The Middle East & Africa registers the quickest regional expansion at a 22.9% CAGR between 2026 and 2035.


Robotics Market Size and Forecast (2021–2035)

Market sizing draws on a triangulated methodology combining bottom-up revenue analysis of leading OEMs and integrators, top-down validation through national industrial automation statistics, and cross-referencing with trade association shipment data from the International Federation of Robotics (IFR). All forecast figures assume no major global recessionary shock and incorporate current policy trajectories for automation incentives.
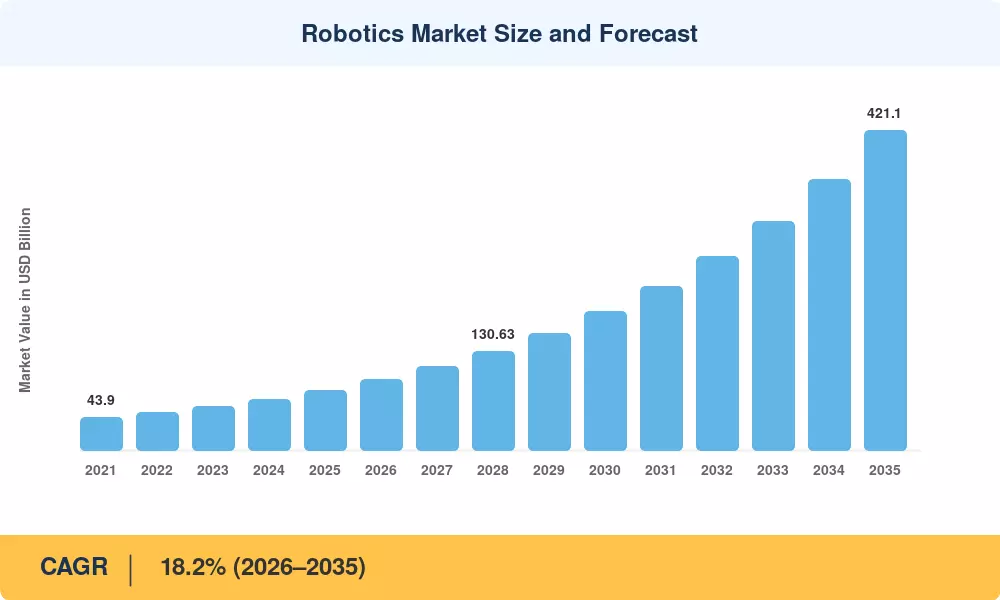
Robotics Market Size and Forecast
Our Impact
Enabled $4.3B Revenue Impact for Fortune 500 and Leading Multinationals
Partnering with 2000+ Global Organizations Each Year
30K+ Citations by Top-Tier Firms in the Industry

Driver Impact Analysis

Driver ~% Impact on CAGR Geographic Relevance Impact Timeline
Structural labor shortages in manufacturing +3.5% North America, Europe, Japan Short-term (≤2 yr)
AI and machine-vision integration +3.2% Global Medium-term (2–4 yr)
E-commerce warehouse automation wave +2.8% North America, Asia-Pacific Short-term (≤2 yr)
Government reshoring and industrial policy +2.4% US, EU, India Medium-term (2–4 yr)
Declining component and sensor costs +2.1% Global Long-term (≥4 yr)
Surgical and rehabilitation robot adoption +1.8% North America, Europe Long-term (≥4 yr)
RaaS and subscription-based deployment models +1.5% Global Medium-term (2–4 yr)


Structural Labor Shortages

Early in 2026, there were more than 460,000 manufacturing job opportunities in the US, and according to the DIHK study conducted in Germany, more than one-third of industrial enterprises are still having trouble filling positions despite a slowdown in the economy. The aging populations of South Korea, Japan, and Western Europe are the cause of these structural rather than cyclical differences. As a result, businesses that previously saw robotics as a way to increase productivity now consider them as standard operating insurance.


AI and Machine-Vision Integration

Repetitive pick-and-place tasks are no longer the only addressable activities thanks to the confluence of robotic actuation with deep learning perception. Reinforcement-learning controllers adjust to part variability in real-time, and vision-guided systems now perform intricate bin-picking with almost flawless precision. As platforms like Google DeepMind's RT-2 and NVIDIA's Isaac move from research labs to manufacturing facilities, typical selling prices for intelligent equipment rise by 18–22% while deployment times are shortened by up to 40%.


E-Commerce Warehouse Automation

Global e-commerce fulfilment volumes grew at roughly 11% annually between 2021 and 2024, and logistics operators responded by tripling autonomous mobile robot (AMR) orders [10]. Amazon alone operates over 750,000 robotic units across its network. The Robotics Market benefits from this structural shift toward same-day and next-day delivery commitments, which make manual sortation economically unviable at scale. Third-party logistics providers now allocate 25–30% of capital budgets to robotic systems.

Government Reshoring and Industrial Policy

The U.S. CHIPS and Science Act earmarked USD 52.7 Billion for semiconductor manufacturing, much of which flows into automated fab equipment [2]. India's Production-Linked Incentive (PLI) scheme has disbursed over INR 760 Billion to electronics and automotive manufacturers, with robotics density targets embedded in scheme guidelines. These policy-driven capital flows create a multiplier effect — every dollar of public subsidy triggers an estimated USD 3–4 of private automation investment.


Restraints Impact Analysis

Restraint impact percentages are directional estimates of downward pressure on Robotics Market growth. They reflect adoption friction rather than absolute market contraction and are not directly subtracted from the headline CAGR.

Restraint ~% Impact on CAGR Geographic Relevance Impact Timeline
High upfront capital expenditure −1.8% SMEs globally Short-term (≤2 yr)
Cybersecurity vulnerabilities in connected robots −1.2% Global Medium-term (2–4 yr)
Integration complexity and skill gaps −1.0% Emerging markets Long-term (≥4 yr)
Export-control and geopolitical friction −0.8% US-China corridor Medium-term (2–4 yr)
Regulatory fragmentation across jurisdictions −0.6% Europe, Asia-Pacific Long-term (≥4 yr)


High Upfront Capital Expenditure

The normal cost of a six-axis industrial robot cell, including end-effectors, safety fencing, and integration manpower, is between USD 150,000 and USD 350,000, which frequently causes payback periods for mid-sized enterprises to exceed 24 months. Although this barrier is rapidly being lowered by Robotics-as-a-Service (RaaS) models, capital restrictions continue to be a major obstacle for businesses with fewer than 250 people. Leasing penetration is still modest outside of Germany and Japan, currently ranging from 12 to 15%.


Cybersecurity Vulnerabilities

The attack surface for manufacturers has significantly increased due to the convergence of enterprise IT networks and connected robotic equipment. Production lines are becoming a prime target due to hundreds of vulnerabilities found in commercial robot controllers, ranging from unpatched firmware to insecure industrial communication protocols. Insurance underwriters are increasingly factoring cyber risk into industrial policies, frequently adding 3–5% to the total cost of ownership, as production-line ransomware events continue to cause expensive downtime.


Integration Complexity and Skill Gaps

Deploying a robotic work cell requires mechanical, electrical, and software engineering expertise that smaller integrators in Southeast Asia, Latin America, and Africa often lack. The IFR estimates the global robotics-engineer deficit at approximately 80,000 professionals as of 2024 [17]. Until vocational training pipelines and low-code programming platforms mature sufficiently, this human-capital bottleneck will cap Robotics Market growth in the fastest-growing geographies.


Robotics Market Opportunities

Robot-as-a-Service and Subscription Models

RaaS contracts convert prohibitive capital outlays into predictable monthly operating expenses, unlocking access for small manufacturers and agricultural cooperatives that traditional leasing never reached [14]. Forager, Locus Robotics, and several emerging players now offer per-pick or per-hour pricing, with contract lengths averaging 24–36 months. The Robotics Market stands to gain an estimated USD 18–22 Billion in incremental revenue by 2035 from subscription-based deployments alone.

Surgical and Rehabilitation Robotics

Minimally invasive surgical robots reduce patient recovery times by 30–50% compared with open procedures, and reimbursement pathways in the U.S. (CMS) and Europe (G-DRG) are expanding coverage to new procedure categories [11]. Orthopedic and neurosurgical platforms represent the next wave beyond general-surgery systems, while rehabilitation exoskeletons gain traction in stroke-recovery clinics across Asia-Pacific. This clinical frontier offers the Robotics Market a high-margin, regulation-protected growth vector.

Emerging-Market Agricultural Automation

Sub-Saharan Africa and South Asia face simultaneous food-security pressures and rural labor migration. Low-cost autonomous weeding and harvesting robots priced below USD 25,000 are entering pilot programs in India, Kenya, and Nigeria, backed by World Bank agricultural modernization loans totaling USD 4.2 Billion between 2023 and 2028 [19]. These geographies could replicate the rapid adoption trajectory that China's manufacturing sector experienced between 2015 and 2022.

Data Monetization Through Fleet Analytics

Robotic systems generate terabytes of operational telemetry — cycle times, torque profiles, defect rates — that hold value well beyond the shop floor. OEMs that build cloud analytics platforms around this data can sell predictive-maintenance subscriptions, benchmark services, and digital-twin licensing. The Robotics Market is beginning to mirror the industrial-IoT playbook, where hardware margins compress while software and data revenues expand.

Collaborative Robots in Food and Beverage Processing

The food-processing industry faces uniquely challenging hygiene requirements that have historically limited robotic penetration. New IP69K-rated collaborative arms designed for washdown environments are now handling protein portioning, bakery decoration, and fresh-produce packaging at speeds competitive with manual labor [20]. With food-safety regulations tightening in the EU and North America, this niche within the Robotics Market is positioned for double-digit growth through the forecast period.


Robotics Market Future Outlook

AI-Native Autonomous Operations

Foundation models trained on multimodal industrial data are enabling robots to generalize across tasks without explicit programming for each scenario. By 2030, an estimated 35% of newly shipped industrial robots will incorporate large-language-model-based instruction interfaces, allowing operators to issue natural-language commands rather than writing motion scripts [13]. This shift will compress deployment timelines from weeks to hours and reshape the Robotics Market value chain toward software licensing and cloud compute fees.

Platform Economics and Ecosystem Lock-In

The industry is migrating toward platform architectures — NVIDIA Isaac, Siemens Xcelerator, ABB RobotStudio — where hardware interoperability depends on software ecosystem participation. Vendors that control the simulation, training, and fleet-management layers will capture disproportionate margin, mirroring the platform dynamics seen in smartphones and cloud computing. For the Robotics Market, this implies rising switching costs, higher customer lifetime value, and a gradual consolidation around three or four dominant platforms by the early 2030s [22].

Electrification and Energy-Efficiency Mandates

The IEA projects that industrial electricity consumption will rise 28% by 2035 under current trajectories, and energy-efficiency regulations — including the EU Energy Efficiency Directive and U.S. DOE motor-efficiency standards — are tightening [23]. Next-generation servo drives consuming 15–20% less power per cycle are already in development at major motor manufacturers. The Robotics Market will see energy performance become a purchasing criterion on par with speed and payload, particularly in Europe and Japan where carbon pricing inflates operational costs.

ESG Reporting and Responsible Automation

Mandatory sustainability disclosure frameworks — the EU Corporate Sustainability Reporting Directive (CSRD) and the SEC's climate-risk rules — require companies to quantify the environmental footprint of their production systems [24]. Robotic installations that reduce scrap rates, lower energy consumption per unit produced, and improve worker safety metrics contribute directly to reportable ESG key performance indicators. The Robotics Market benefits as procurement teams weigh automation investments partly through an ESG compliance lens, adding a non-financial justification layer that strengthens capital-expenditure approvals.


Robotics Market Segmentation

By Robot Type

Segment Key Metric Primary Demand Driver
Industrial Robots 66.2% revenue share (2025) Automotive, electronics, and metal-fabrication assembly
Service Robots USD 22.40 Billion (2025) Logistics AMRs, cleaning, inspection
Collaborative Robots 23.8% CAGR (2026–2035) SME adoption, human-robot shared workspaces


Industrial robots remain the revenue backbone of the Robotics Market, dominating high-throughput tasks like welding, painting, and palletizing in automotive and electronics plants. Six-axis articulated arms from established OEMs continue to command premium pricing due to precision, payload capacity, and proven reliability over 60,000-hour operational lifespans. Collaborative robots, however, are rewriting the growth narrative — their inherent force-limiting safety features eliminate the need for physical guarding, cutting deployment footprint by up to 60% and enabling placement alongside human workers on mixed-task lines.

By Component

Segment Key Metric Primary Demand Driver
Hardware 58.7% revenue share (2025) Arms, controllers, end-effectors, sensors
Software 21.3% CAGR (2026–2035) AI analytics, fleet orchestration, digital twins
Services USD 11.80 Billion (2025) Integration, maintenance, operator training


Hardware — encompassing robotic arms, controllers, drives, and sensors — generates the majority of upfront revenue, though its share within the Robotics Market is gradually compressing as software and services gain traction. The software segment is expanding most rapidly, fueled by demand for offline programming suites, cloud-based fleet-management dashboards, and AI-driven quality-inspection modules. Services revenue, while smaller in absolute terms, carries the highest gross margins and offers OEMs recurring income through multi-year maintenance agreements.

By Application

Segment Key Metric Primary Demand Driver
Manufacturing and Assembly USD 28.50 Billion (2025) Precision, throughput, and labor substitution
Logistics and Warehousing 36.4% revenue share (2025) E-commerce fulfilment, same-day delivery
Medical and Surgical 23.1% CAGR (2026–2035) Minimally invasive procedures, reimbursement expansion
Other Applications USD 6.30 Billion (2025) Agriculture, construction, defense, inspection


Logistics and warehousing represent the largest single application within the Robotics Market, driven by relentless e-commerce volume growth and the economic impossibility of scaling manual sortation to meet same-day delivery promises. Autonomous mobile robots, robotic arms for goods-to-person systems, and automated storage-and-retrieval systems form the core technology stack. Medical and surgical robotics, while smaller in absolute revenue, carry significantly higher average selling prices — a da Vinci surgical system lists above USD 1.5 million — and benefit from clinical-evidence barriers that protect incumbents from low-cost competition [11].

By End-User Industry

Segment Key Metric Primary Demand Driver
Automotive 26.8% revenue share (2025) Body-in-white welding, EV battery assembly
Electronics and Semiconductor USD 14.20 Billion (2025) Chip-fab precision handling, PCB assembly
Food and Beverage 19.5% CAGR (2026–2035) Hygiene compliance, labor turnover reduction
Healthcare 23.2% CAGR (2026–2035) Surgical platforms, pharmacy dispensing
Other Industries USD 9.80 Billion (2025) Aerospace, metals, plastics, textiles


Automotive remains the foundational end-user segment of the Robotics Market, though its share has been gradually ceding ground as non-automotive sectors accelerate adoption. The transition to electric vehicles is particularly catalytic: EV battery-module assembly requires high-precision, contamination-free handling that strongly favors robotic over manual methods. Healthcare providers, on the other hand, represent the fastest-growing end-user category, propelled by an expanding menu of robot-assisted surgical procedures and an aging global population that increases procedure volumes across orthopedics, urology, and general surgery.


Regional Market Share Analysis

Region Key Metric Primary Investment Themes
Asia-Pacific 35.1% revenue share (2025) Electronics assembly, automotive OEM capacity, government density targets
North America 27.4% revenue share (2025) Warehouse automation, reshoring incentives, surgical robotics
Europe 23.8% revenue share (2025) Industrie 4.0, food processing, collaborative safety standards
South America 5.2% revenue share (2025) Agritech modernization, mining automation
Middle East & Africa 22.9% CAGR (2026–2035) Vision 2030 programs, oil-to-tech diversification, construction robotics
Total USD 79.10 Billion (2025)

The Robotics Market exhibits a concentrated yet evolving regional structure, with three regions — Asia-Pacific, North America, and Europe — collectively accounting for over 86% of global revenue. Growth momentum, however, is shifting toward the Middle East & Africa and South America, where industrialization programs and sovereign-wealth investments are accelerating automation adoption.


North America

Country Key Metric Key Driver
United States 78.3% of regional share Reshoring mandates, e-commerce fulfilment density
Canada 12.1% of regional share Mining and natural-resource automation
Mexico 9.6% of regional share Nearshoring automotive assembly expansion


The United States remains the Robotics Market anchor in North America, with over 395,000 new industrial robot installations between 2021 and 2024 [9]. Federal tax incentives under Section 179 allow full first-year depreciation of robotic equipment, directly lowering effective acquisition costs. Canada's mining sector is deploying autonomous haul trucks and drill rigs across remote operations in Ontario and British Columbia, while Mexico benefits from OEM plant relocations that carry embedded automation specifications.

Europe

Country Key Metric Key Driver
Germany 31.5% of regional share Automotive OEM integration, SME cobot adoption
United Kingdom 14.8% of regional share Post-Brexit manufacturing self-sufficiency push
France 13.2% of regional share Aerospace and nuclear maintenance robotics
Italy 11.4% of regional share Packaging, ceramics, and textile automation
Spain 7.3% of regional share Agri-food processing modernization
Nordic Countries 8.9% of regional share High wage floors accelerating automation ROI
Russia 4.1% of regional share Sanctions-era import substitution efforts
Rest of Europe 8.8% of regional share Eastern European electronics assembly growth


Germany's Robotics Market footprint reflects its automotive heritage — Volkswagen, BMW, and Mercedes-Benz operate some of the most robot-dense plants globally [4]. The EU Machinery Regulation (2023/1230), effective from January 2027, introduces updated safety and cybersecurity requirements that will drive a refresh cycle across installed bases [12]. Nordic countries, facing labor costs exceeding EUR 45 per hour in manufacturing, achieve payback on cobot investments within 8–14 months, among the shortest globally.

Asia-Pacific

Country Key Metric Key Driver
China 19.4% CAGR (2026–2035) "Made in China 2025" sequel policies, domestic OEM scaling
India 22.1% CAGR (2026–2035) PLI scheme, electronics manufacturing expansion
Japan USD 8.90 Billion (2025) Precision assembly, demographic labor decline
South Korea USD 5.40 Billion (2025) Semiconductor fab automation, shipbuilding
ASEAN 20.8% CAGR (2026–2035) Electronics FDI, Thai and Vietnamese factory build-outs
Rest of Asia-Pacific USD 2.10 Billion (2025) Australia mining, New Zealand agritech


China installed over 290,000 industrial robots in 2024 alone, accounting for roughly 52% of global shipments that year [7]. Government subsidies covering up to 30% of automation equipment costs in designated industrial zones continue to compress payback periods for domestic manufacturers. India is emerging as a high-growth corridor within the Robotics Market, with robot density rising from 4 units per 10,000 workers in 2020 to an estimated 12 by 2025, still far below the global average of 151 [9].

South America

Country Key Metric Key Driver
Brazil 62.4% of regional share Automotive and agribusiness automation
Argentina 18.7% of regional share Food-processing export compliance
Rest of South America 18.9% of regional share Mining operations in Chile and Peru


Brazil anchors the South American Robotics Market, driven by São Paulo's automotive cluster and large-scale grain-handling operations in Mato Grosso [19]. Currency volatility and import tariffs on finished robotic cells remain headwinds, though local integrators are assembling systems from imported components to bypass duties. Chile's copper-mining sector is piloting autonomous drilling and haulage in the Atacama region, with BHP and Codelco together budgeting over USD 1.2 Billion for mine-automation projects through 2028.

Middle East & Africa

Country Key Metric Key Driver
Saudi Arabia 34.8% of regional share Vision 2030, NEOM smart-city construction
UAE 28.5% of regional share Logistics hub automation, healthcare modernization
South Africa 16.2% of regional share Mining and automotive assembly
Egypt 10.3% of regional share Suez Canal logistics corridor, textiles
Rest of MEA 10.2% of regional share Infrastructure build-out, agriculture pilots


The Middle East & Africa is the fastest-growing region in the Robotics Market, propelled by sovereign-wealth capital in the Gulf states. Saudi Arabia's Public Investment Fund has committed over USD 3.5 Billion to advanced manufacturing and robotics ventures as part of NEOM and related giga-projects [21]. The UAE's Ministry of Industry and Advanced Technology targets a 30% increase in manufacturing robot density by 2030, while South Africa's mining houses are deploying underground inspection robots to address safety and productivity gaps.


Robotics Market By Region, 2025-2035

Competitive Benchmarking

The Robotics Market exhibits medium concentration, with the top five players accounting for an estimated 38–44% of global revenue. The competitive field spans century-old industrial conglomerates (Fanuc, ABB), specialized surgical-robotics firms (Intuitive Surgical), and venture-backed new entrants focused on collaborative and mobile platforms. Mergers, joint ventures, and acqui-hires of AI startups are reshaping positioning as software capability becomes a differentiator alongside mechanical heritage.

Company Est. Revenue Share Range Key Offerings for Robotics Market Strategic Positioning
Fanuc Corporation ~8–11% CNC-integrated industrial arms, cobots, IoT platform (FIELD) Vertically integrated; dominant in CNC-robot combination cells
ABB Ltd ~7–10% IRB series industrial robots, GoFa/SWIFTI cobots, RobotStudio Broad portfolio spanning power and automation; strong European base
KUKA AG (Midea Group) ~5–8% Industrial arms, mobile platforms, cloud-based fleet management Chinese-ownership leverage for Asia-Pacific market access
Yaskawa Electric ~5–7% Motoman industrial arms, servo drives, Sigma-7 controllers Servo-motor vertical integration; cost-competitive in high-volume orders
Universal Robots (Teradyne) ~4–6% UR3e/UR5e/UR10e/UR20 cobots, UR+ ecosystem Category creator in collaborative robots; ecosystem-driven lock-in
Intuitive Surgical ~4–6% da Vinci surgical systems, Ion bronchoscopy platform Installed-base moat; recurring instrument and service revenue
Boston Dynamics (Hyundai) ~2–4% Spot, Stretch, Atlas; warehouse and inspection solutions Brand recognition; transitioning from R&D to commercial scale
Mitsubishi Electric ~3–5% MELFA industrial arms, e-F@ctory IoT integration Tight integration with Mitsubishi FA ecosystem
Denso Robotics ~2–4% Compact SCARA and six-axis arms, cobots for electronics Automotive Tier-1 pedigree; strong in micro-assembly
Kawasaki Heavy Industries ~2–3% duAro dual-arm cobots, high-payload industrial arms Diversified heavy-industry parent; niche in large-payload applications


Recent News & Developments


  • Boston Dynamics (February 2024): Began commercial deployment of the Stretch warehouse robot at DHL Supply Chain facilities in North America, marking the company's first large-scale logistics contract [10].


  • In order to separate high-growth automation assets and improve investor strategic clarity, ABB announced in May 2025 that it would list its Robotics division by Q2 2026.
  • In order to show state support for ruggedized autonomous systems with potential dual-use applications, DARPA's RACER program entered Phase 2 in May 2025 with 12-ton off-road platforms.
  • In April 2025, Standard Bots raised USD 63 million to accelerate AI-native control stacks, and RLWRLD raised USD 14.8 million, demonstrating the appetite of venture capitalists for software-first robotics companies.


Robotics Market Report Scope

Parameter Details
Market Scope Global Robotics Market covering industrial, service, and collaborative robot segments
Study Period 2021–2035
CAGR (Forecast Window) 18.2% (2026–2035)
Base Year Market Size USD 79.10 Billion (2025)
Forecast Endpoint Market Size USD 421.10 Billion (2035)
Fastest Growing Segment (Robot Type) Collaborative Robots (23.8% CAGR)
Fastest Growing End-User Healthcare Providers (23.2% CAGR)
Companies Profiled 10 (Fanuc, ABB, KUKA, Yaskawa, Universal Robots, Intuitive Surgical, Boston Dynamics, Mitsubishi Electric, Denso Robotics, Kawasaki Heavy Industries)
Valuation Currency USD Billion


FAQs

How does Robot-as-a-Service pricing compare to outright purchase for a mid-sized manufacturer?
RaaS monthly fees typically range from USD 2,000–5,000 per unit, yielding total three-year costs 15–25% above outright purchase. The trade-off is zero upfront capital and included maintenance, making RaaS attractive where cash-flow flexibility outweighs lifetime cost savings [14].
Which cobot safety standard should procurement teams prioritize when evaluating vendors?
ISO/TS 15066 defines force and pressure limits for collaborative operation and remains the benchmark globally. Vendors whose systems carry third-party ISO/TS 15066 certification reduce buyer liability exposure and simplify facility insurance approvals [15].
What integration timeline should a first-time buyer expect for a six-axis industrial robot cell?
Typical deployments take 12–20 weeks from purchase order to full production, including mechanical installation, software commissioning, and operator training. Facilities with existing PLC infrastructure can shave 3–4 weeks from that timeline [17].
How are export controls affecting cross-border procurement of advanced robotic components?
U.S. Bureau of Industry and Security restrictions limit shipment of certain AI-capable controllers and high-precision actuators to designated countries. Buyers in affected regions face 8–14 week lead-time extensions and should engage compliance counsel early [18].
What minimum robot density indicates a factory has reached automation maturity?
IFR benchmarks suggest 150 robots per 10,000 manufacturing employees as the threshold where automation yields consistent productivity gains. South Korea leads globally at over 1,000, while most emerging economies remain below 30 [9].
How do cybersecurity insurance requirements differ for connected versus standalone robotic installations?
Connected systems trigger industrial-cyber policy riders that add 3–5% to annual premiums. Standalone cells operating on air-gapped networks generally qualify for standard equipment coverage without cyber surcharges [16].
What ROI timeframe do surgical-robot installations typically achieve in community hospitals?
Community hospitals performing 150–200 robot-assisted procedures annually report payback within 3–5 years. Higher volumes compress that to under 3 years due to favorable per-procedure instrument amortization [11].    
Author
Author
Author Profile
Nirmit Biswas LinkedIn
Senior Research Analyst
With 5+ years of expertise in Market Intelligence and Strategic Research, Nirmit Biswas specializes in ICT, Semiconductors, and BFSI. Backed by an MBA in Financial Services and a Computer Science foundation, Nirmit blends technical depth with business acumen. He has successfully led 100+ projects for global enterprises and startups, including Amazon, Cisco, L&T and Huawei, delivering market estimations, competitive benchmarking, and GTM strategies. His focus lies in transforming complex data into clear, actionable insights that drive growth, innovation, and investment decisions. Recognized for bridging engineering innovation with executive strategy, Nirmit helps businesses navigate dynamic markets with confidence.
Co-Author
Co-Author Profile
Aarti Dhapte LinkedIn
AVP - Research
A consulting professional focused on helping businesses navigate complex markets through structured research and strategic insights. I partner with clients to solve high-impact business problems across market entry strategy, competitive intelligence, and opportunity assessment. Over the course of my experience, I have led and contributed to 100+ market research and consulting engagements, delivering insights across multiple industries and geographies, and supporting strategic decisions linked to $500M+ market opportunities. My core expertise lies in building robust market sizing, forecasting, and commercial models (top-down and bottom-up), alongside deep-dive competitive and industry analysis. I have played a key role in shaping go-to-market strategies, investment cases, and growth roadmaps, enabling clients to make confident, data-backed decisions in dynamic markets.

Research Approach


Secondary Research

The secondary research process involved comprehensive analysis of regulatory databases, industry standards organizations, peer-reviewed engineering journals, technical publications, and authoritative industrial technology organizations. Key sources included the International Federation of Robotics (IFR), International Organization for Standardization (ISO) – Technical Committee 299 on Robotics, IEEE Robotics & Automation Society, Robotics Industry Association (RIA - A3), Occupational Safety and Health Administration (OSHA), National Institute of Standards and Technology (NIST), US Patent and Trademark Office (USPTO), European Patent Office (EPO), National Science Foundation (NSF) Directorate for Engineering, National Center for Science and Engineering Statistics (NCSES), EU Eurostat Industrial Production Database, Organization for Economic Co-operation and Development (OECD) Robotics Statistics, and national industrial ministry reports from key manufacturing markets including Germany's Federal Ministry for Economic Affairs and Climate Action (BMWK), Japan's Ministry of Economy, Trade and Industry (METI), and China's Ministry of Industry and Information Technology (MIIT). These sources were used to collect industrial automation statistics, robotics adoption rates, patent filings and technological innovation data, safety compliance standards, demographic labor trends, and competitive landscape analysis for articulated robots, collaborative robots (cobots), autonomous mobile robots (AMRs), automated guided vehicles (AGVs), humanoids, and other robotic systems.


Primary Research

Qualitative and quantitative insights were obtained by interviewing supply-side and demand-side stakeholders during the primary research process. From robotics manufacturers, system integrators, and component suppliers, supply-side sources comprised CEOs, VPs of Engineering & Product Development, chief technology officers (CTOs), regulatory compliance leaders, and commercial directors. Chief operations officers (COOs), plant managers, automation directors, procurement leads from automotive manufacturers, electronics assembly firms, logistics and warehousing operators, healthcare facility administrators, agricultural enterprises, and defense contractors constituted demand-side sources. Primary research has confirmed product development roadmaps and technology pipeline timelines, as well as gathered insights on adoption barriers, integration challenges, pricing strategies, total cost of ownership models, and return on investment metrics. Additionally, market segmentation has been validated across type (AMRs, AGVs, articulated robots, humanoids, cobots), environment (aerial, ground, marine), mobility (mobile vs. fixed), application (material handling, welding, assembly, security, cleaning, personal assistance), and end-user verticals using primary research.

Primary Respondent Breakdown:

By Designation: C-level Executives (40%), Director Level (25%), Others (35%)

By Region: North America (32%), Europe (30%), Asia-Pacific (30%), Rest of World (8%)


Market Size Estimation

Global market valuation was derived through revenue mapping, unit shipment analysis, and deployment volume assessment. The methodology included:

Identification of 50+ key robotics manufacturers and system integrators across North America, Europe, Asia-Pacific, Latin America, and Middle East & Africa

Product mapping across articulated robots, collaborative robots, SCARA robots, delta robots, mobile robots, and specialized robotic systems for industrial, service, medical, agricultural, and military applications

Analysis of reported and modeled annual revenues specific to robotics product portfolios and automation solution offerings

Coverage of manufacturers representing 72-78% of global market share in 2024

Extrapolation using bottom-up (unit shipments × average selling price by country/application) and top-down (manufacturer revenue validation and supply chain analysis) approaches to derive segment-specific valuations across type, environment, mobility, application, and end-user categories

Download Free Sample

Kindly complete the form below to receive a free sample of this Report

Download PDF ×

We do not share your information with anyone. However, we may send you emails based on your report interest from time to time. You may contact us at any time to opt-out.

















