Cloud Robotics Market (2026 - 2035)

Cloud Robotics Market Size, Share and Research Report By Physics Sets a Hard Boundary, By Sovereignty Fragments the Platform Layer, By The Brownfield Problem and By Regional (North America, Europe, South America, South Africa, Asia Pacific, Middle East and Africa) - Industry Forecast to 2035.
ID: MRFR/ICT/1712-HCR
100 Pages
Ankit Gupta
Last Updated: August 24, 2026
Cloud Robotics Market
Market Size
Forecast Period2026-2035
CAGR (2026-2035)23.1%
2025 Market SizeUSD 11.5 Billion
2035 Market SizeUSD 92.1 Billion
Key Players
Amazon Web Services
NVIDIA Corporation
Google
Microsoft Corporation
ABB Ltd
Huawei Technologies
Opportunities
  • Simulation-to-Deployment Pipelines
  • Emerging Market Leapfrogging
  • Fleet Data Monetisation

Cloud Robotics Market Summary

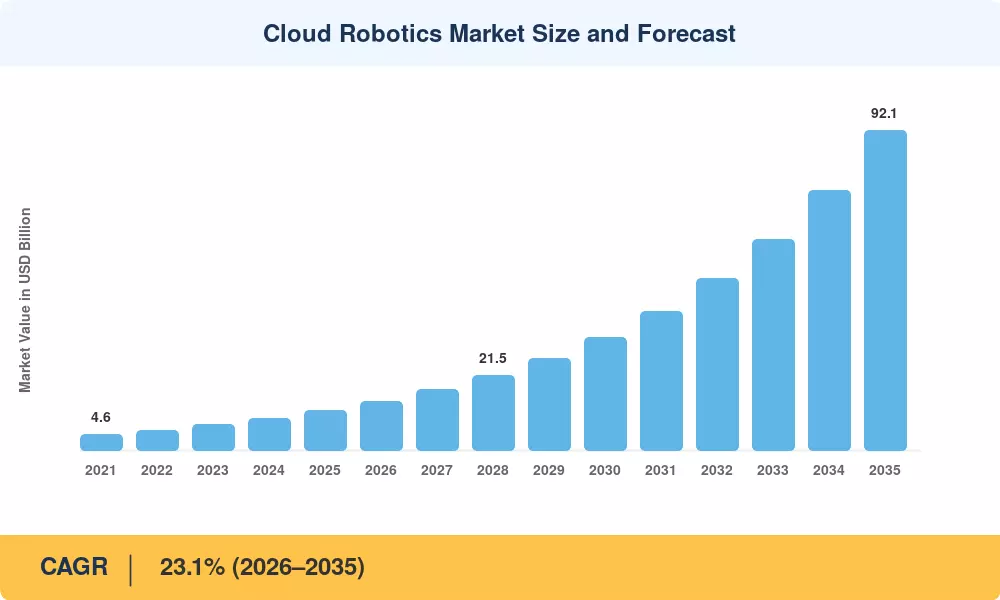
The Cloud Robotics Market reached USD 11.5 billion in 2025 and opens the forecast window at USD 14.2 billion in 2026, climbing to USD 92.1 billion by 2035 at a 23.1% CAGR. Two catalysts anchor that trajectory. China's Humanoid Robot Action Plan, issued in 2025 by the Ministry of Industry and Information Technology alongside five other ministries, targets 100,000 deployed humanoid units by 2027 [12]. Washington's parallel push — documented in ITIF's July 2025 policy assessment — reflects growing concern that the United States trails badly on robot density despite owning most of the cloud infrastructure layer [9]. Buyers are no longer purchasing robots. They are subscribing to fleets.

Legacy architecture is what the Cloud Robotics Market is dismantling. Controllers with fixed onboard compute, vendor-locked teach pendants, and isolated fieldbus networks are giving way to containerised control stacks where perception, path planning, and skill learning execute off-robot. NVIDIA's December 2024 move to run Isaac Sim on Amazon EC2 G6e instances, paired with its OSMO orchestration layer, put industrial-grade simulation into rented GPU capacity for the first time at scale [4]. Training runs that once required months of physical data collection now compress into days.

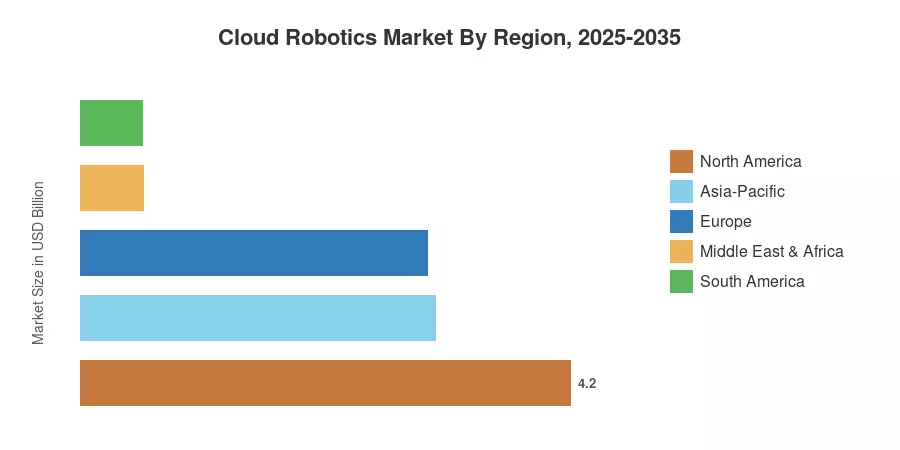
North America holds 36.5% of 2025 revenue, supported by hyperscaler proximity and a mature systems-integrator base. Asia-Pacific grows fastest at a 26.4% CAGR through 2035, propelled by China's 295,000 industrial robot installations in 2024 — 54% of the global total [1]. Europe ranks second on value at USD 2.97 billion, though its growth is shaped as much by compliance architecture as by demand. Whoever solves latency, liability, and portability together will define the next decade of the Cloud Robotics Market.


Key Report Takeaways

The Cloud Robotics Market splits cleanly along three axes, each with a distinct growth signature.

• By Offering

  • Software commands 61.3% of 2025 Cloud Robotics Market revenue, reflecting the shift of fleet intelligence from firmware to subscription platforms
  • Service expands at a 24.9% CAGR as integration, managed operations, and remote support become recurring line items

• By Sector

  • Manufacturing holds 33.8% share, still the anchor vertical despite faster percentage growth elsewhere
  • Healthcare and Life Sciences grows at 27.9% CAGR, tracking the 91% jump in medical robot sales recorded for 2024
  • Military and Defense contributes USD 1.28 billion, concentrated in sovereign-cloud deployments

• By Region

  • North America leads the Cloud Robotics Market with 36.5% of 2025 revenue
  • Asia-Pacific posts the fastest regional CAGR at 26.4%
  • Middle East & Africa reaches USD 0.54 billion in 2025, small but strategically funded


Market Size and Forecast (2021–2035)

Figures below blend supply-side revenue mapping across platform vendors, robotics OEMs, and managed-service providers with demand-side validation from installed-base statistics published by the International Federation of Robotics and regional automation associations [1][8]. Historical values were reconciled against reported cloud infrastructure consumption attributable to robotics workloads.
Cloud Robotics Market Size and Forecast
Our Impact
Enabled $4.3B Revenue Impact for Fortune 500 and Leading Multinationals
Partnering with 2000+ Global Organizations Each Year
30K+ Citations by Top-Tier Firms in the Industry

Driver Impact Analysis

Driver ~% Impact on CAGR Geographic Relevance Impact Timeline
Subscription economics lowering capex barriers ~4.8% Global Medium-term (2–4 yr)
5G and edge densification cutting control latency ~4.1% APAC, North America Medium-term (2–4 yr)
Foundation models for perception and manipulation ~3.9% North America, APAC Long-term (≥4 yr)
Warehouse and fulfilment automation ~3.4% North America, Europe, China Short-term (≤2 yr)
Industrial labour shortage and wage inflation ~2.9% Europe, Japan, North America Short-term (≤2 yr)
National robotics strategies and subsidies ~2.6% China, India, South Korea Long-term (≥4 yr)
Connected surgical and clinical robot fleets ~2.1% North America, Europe Long-term (≥4 yr)


Subscription Economics Reset the Buying Decision

Subscription economics and shifting capital expenditure models are quickly changing how robotics deployments are financed, acting as a foundational market driver. By lowering initial capex barriers, subscription frameworks have unlocked an estimated 4.8% impact on the Compound Annual Growth Rate globally, making advanced robotic infrastructure accessible to a much broader range of enterprises. This financial shift is playing out across a medium-term impact timeline of two to four years, effectively smoothing the path for widespread adoption much like simulation workloads accelerated early development.

Compute Migration Off the Robot

Simulation and training workloads left the workshop first. NVIDIA's Isaac GR00T-Dreams blueprint, unveiled at Computex in May 2025, generated the synthetic data behind GR00T N1.5 in 36 hours — work that manual human data collection would have stretched across roughly three months [5]. Boston Dynamics, Agility Robotics, Foxconn, NEURA Robotics and XPENG Robotics all adopted the platform. Inference is following the same path, which is what converts the Cloud Robotics Market from a tooling category into an operating dependency.

Policy as Demand Floor

Beijing treats embodied AI as a named priority in the 15th Five-Year Plan (2026–2030), reinforced by the "Robot+" initiative and provincial subsidy pools [10]. India's National Strategy for Robotics targets agriculture, healthcare and manufacturing; Singapore's National Robotics Programme concentrates on healthcare, construction and environmental services; Australia's strategy extends to mining and marine [9]. State procurement creates the volume that makes cloud fleet platforms economically viable in markets too small to support them commercially.

Installed Base Creates Retrofit Demand

Industrial robot installations are expected to expand by 6% to 575,000 units in 2025, with a global operating stock of 4,664,000 units in 2024, a 9% year-over-year growth [1]. Each of those devices could be retrofitted with connectivity. Because the customer already knows what the asset does and is purchasing insight rather than capacity, retrofit revenue has greater software attach rates than greenfield.


Restraints Impact Analysis

Restraint ~% Impact on CAGR Geographic Relevance Impact Timeline
Latency and determinism limits in safety-critical control ~-3.2% Global Short-term (≤2 yr)
Industrial cybersecurity and OT network exposure ~-2.7% Europe, North America Medium-term (2–4 yr)
Data sovereignty and cross-border transfer rules ~-2.3% Europe, China, India Medium-term (2–4 yr)
Brownfield integration with legacy PLC estates ~-1.9% Global Short-term (≤2 yr)
Cloud-native robotics engineering talent gap ~-1.5% Global Long-term (≥4 yr)


Physics Sets a Hard Boundary

Safety loops on a moving manipulator require deterministic response inside single-digit milliseconds. Public cloud round-trips cannot guarantee that, and no service-level agreement changes the speed of light. ISO 25785-1, published in May 2025 as the first international safety standard covering bipedal robots in industrial workplaces, formalises what practitioners already knew: balance-critical functions stay local [15]. The Cloud Robotics Market consequently sells orchestration, learning and analytics rather than closed-loop control — a smaller addressable slice than early forecasts assumed.

Sovereignty Fragments the Platform Layer

European deployments now sit inside the EU AI Act's high-risk classification for autonomous systems, with documentation and conformity obligations attached [13]. The EU Data Act, applicable from September 2025, adds switching and portability duties on cloud providers [14]. Compliance is achievable. Multiplying it across jurisdictions is what raises cost, since a fleet operating in Germany, Saudi Arabia and India may need three separate data residency architectures for identical hardware.

The Brownfield Problem

Most factories are not new. Bridging a twenty-year-old PLC estate to a modern telemetry pipeline typically consumes 20–30% of first-year deployment budgets, and integrators report it as the most frequently underestimated cost line [9]. Vendors that ship pre-validated protocol adapters win disproportionate share for exactly this reason.


Cloud Robotics Market Opportunities

Simulation-to-Deployment Pipelines

PTC's cloud-native Onshape platform now bridges directly into Isaac Sim through OpenUSD, letting teams at FANUC America and Fauna Robotics validate designs inside physically accurate digital twins before metal is cut [6]. Compressing the design-to-commissioning cycle is the highest-leverage opportunity in the Cloud Robotics Market, because it attacks the cost line customers complain about most.

Emerging Market Leapfrogging

India installed a record 9,100 industrial robots in 2024, up 7%, ranking sixth worldwide [1]. Plants being built now have no legacy control estate to bridge — they can adopt cloud-native architecture from day one. Southeast Asian and Gulf industrial zones present the same structural advantage, and vendors that price for these markets rather than porting Western contracts will capture the position early.

Fleet Data Monetisation

Each linked robot produces operational telemetry that is useful to people other than its owners. Predictive maintenance products, insurance underwriting, and component supplier R&D are supported by anonymized failure-mode information, cycle-time standards, and component wear curves. Cloud-connected robot fleet management is where platform operators sitting on multi-tenant data accrue an asset that hardware vendors cannot match.


Warehouse Orchestration at Scale

KION Group is working with NVIDIA and Accenture on autonomous warehouse systems, while WORKR integrates its AI platform with ABB Robotics industrial arms so small and mid-sized manufacturers can deploy without programming expertise [6]. Lowering the skill threshold expands the buyer pool for the Cloud Robotics Market well past the Fortune 500.

Sovereign and Defence Cloud

Defence ministries want autonomy without foreign infrastructure dependency. Air-gapped and sovereign-region deployments carry premium pricing and multi-year contract terms, and the segment is largely insulated from commercial price competition.


Cloud Robotics Market Future Outlook

Foundation Models Become the Control Layer

Figure AI's Helix, NVIDIA's GR00T series, and open initiatives like OpenVLA are examples of vision-language-action architectures, which began with Google DeepMind's RT-2 [10]. One fleet will be able to carry out duties for which it was never specifically programmed thanks to generalist policies that were educated in the cloud and reduced to edge hardware. Forecasts for the cloud robotics market beyond 2030 show that this capability shift is the single biggest swing factor.


Platform Economics Consolidate

Robotics OEMs own the customer relationship, while hyperscalers own the computation. By itself, neither stance is stable. As OEMs purchase software capabilities and platform suppliers purchase domain expertise, expect the intermediate layer—orchestration, fleet management, and simulation—to consolidate through acquisition.


Standards Catch Up to Deployment

ISO 25785-1 arrived in 2025 for bipedal industrial robots; broader coverage of cloud-mediated control will follow [15]. Certification predictability lowers insurance premiums and unlocks conservative buyers, and by the early 2030s standards maturity should remove one of the persistent brakes on the Cloud Robotics Market.

Service Robotics Overtakes Industrial

Professional service robot sales grew 9% in 2024, medical robots 91%, and consumer service robots 11%, with more than 199,000 professional units recorded [2]. Service applications are inherently cloud-dependent because they operate in unstructured environments requiring continuous model updates. Crossover in cloud spend is likely around 2032.


Cloud Robotics Market Segmentation

Segmentation of the Cloud Robotics Market follows offering, application, and end-user industry.

By Offering

Segment Metric Primary Demand Driver
Software 61.3% share (2025) Fleet orchestration, simulation, model management
Service 24.9% CAGR (2026–2035) Integration, managed operations, remote support


Software dominates because it is where differentiation now lives. Two robots with identical kinematics perform very differently depending on the perception stack driving them, and buyers increasingly negotiate on model performance rather than payload specification. Service grows faster from a smaller base as customers discover that running a fleet requires competencies they lack — a gap that converts one-time integration into recurring managed contracts within the Cloud Robotics Market.

By Application

Segment Metric Primary Demand Driver
Industrial Robot USD 6.9 B (2025) Manufacturing throughput and quality control
Service Robot 26.1% CAGR (2026–2035) Logistics, healthcare, hospitality deployment


Industrial applications hold the larger revenue pool, anchored by an installed base of 4.66 million machines [1]. Service robots grow faster because their operating environments change constantly, making continuous cloud-side learning a functional requirement rather than an optimisation.

By End-user Industry

Segment Metric Primary Demand Driver
Manufacturing 33.8% share (2025) Throughput, quality, labour substitution
Military and Defense USD 1.28 B (2025) Autonomous ISR and sovereign cloud mandates
Retail 22.4% CAGR (2026–2035) Shelf-scanning and inventory robotics
E-commerce 14.6% share (2025) Fulfilment centre throughput
Healthcare and Life Sciences 27.9% CAGR (2026–2035) Surgical fleets and lab automation
Other End-user Industries USD 1.06 B (2025) Agriculture, mining, construction


Manufacturing remains the revenue anchor, though its share erodes gradually as service verticals scale. Healthcare grows fastest, reflecting the 91% surge in medical robot sales during 2024 and the operational reality that connected surgical platforms require centralised model governance and audit trails that only cloud architecture provides economically [2].


Regional Market Share Analysis

Region Metric Primary Investment Themes
North America 36.5% share (2025) Hyperscaler platforms, warehouse autonomy, defence
Europe USD 2.97 B (2025) Compliance tooling, sovereign cloud, precision manufacturing
Asia-Pacific 26.4% CAGR (2026–2035) State-backed scale-up, humanoids, component localisation
South America 4.6% share (2025) Agri-processing, mining automation, logistics
Middle East & Africa USD 0.54 B (2025) Diversification funds, ports, healthcare robotics
Total USD 11.5 B (2025)

Regional performance in the Cloud Robotics Market diverges sharply between infrastructure-rich and manufacturing-dense geographies.


North America

Country Metric Key Driver
US 82.0% of region Hyperscaler proximity and defence procurement
Canada USD 0.46 B (2025) AI research base and resource automation
Mexico 24.9% CAGR (2026–2035) Nearshoring of automotive supply chains


United States industrial robot installations rose 11% year-on-year to 38,000 units in 2025, with recovery driven by food processing and non-manufacturing sectors while automotive held at 13,500 units [3]. ITIF's assessment is blunt about the structural gap: China holds roughly five times the operational stock of the US [9]. American advantage sits in the platform layer rather than the hardware layer, which is precisely why cloud-mediated automation matters more here than robot unit counts suggest.

Europe

Country Metric Key Driver
Germany 24.6% of region Automotive and machinery digitalisation
UK USD 0.53 B (2025) Logistics automation and AI services
France 22.9% CAGR (2026–2035) Robolution research network
Italy 10.2% of region Packaging and machine-tool export base
Spain USD 0.19 B (2025) Automotive assembly and agri-tech
Nordic Countries 24.1% CAGR (2026–2035) Green data centre capacity
Russia 4.1% of region Domestic industrial substitution
Rest of Europe USD 0.24 B (2025) Central European contract manufacturing


Europe accounted for 16% of global robot deployments in 2024 [1]. Germany and the Netherlands direct investment toward service robot innovation in logistics and manufacturing, while France's Robolution initiative funds a distributed network of research centres [9]. Regulatory density cuts both ways here — it slows initial deployment, then becomes an export advantage once compliance-ready platforms are certified.

Asia-Pacific

Country Metric Key Driver
China 38.4% of region Humanoid Robot Action Plan and Robot+ initiative
India 29.7% CAGR (2026–2035) National Strategy for Robotics
Japan USD 0.61 B (2025) Ageing workforce and precision assembly
South Korea 11.3% of region K-Humanoid Alliance and semiconductor fabs
ASEAN 27.2% CAGR (2026–2035) Electronics manufacturing relocation
Rest of Asia-Pacific USD 0.21 B (2025) Resource and port automation


Asia absorbed 74% of new robot deployments in 2024, with China alone installing 295,000 units — the highest annual figure ever recorded, lifting its operational stock to 2,027,000 machines [1]. Chinese manufacturers outsold foreign suppliers domestically for the first time. MIIT's 2024 humanoid roadmap seeded a full-stack ecosystem, and more than 35 new humanoid models launched in 2024 alone [11]. The Cloud Robotics Market in this region is being shaped by industrial policy more than by enterprise procurement cycles.

South America

Country Metric Key Driver
Brazil 54.8% of region Agri-processing and automotive assembly
Argentina USD 0.09 B (2025) Food export automation
Rest of South America 22.7% CAGR (2026–2035) Mining and port logistics


Brazil anchors regional demand, with subscription-based deployment models gaining traction faster than outright purchase because currency volatility makes long capital commitments unattractive. Connectivity remains the binding constraint outside major industrial corridors.

Middle East & Africa

Country Metric Key Driver
Saudi Arabia 27.8% of region Vision 2030 industrial diversification
UAE 25.9% CAGR (2026–2035) Logistics hubs and sovereign AI programmes
South Africa USD 0.08 B (2025) Mining automation and automotive
Egypt 7.4% of region Suez industrial zone manufacturing
Rest of MEA USD 0.11 B (2025) Healthcare and port modernisation


Gulf sovereign funds are buying capability rather than incrementally upgrading it, which produces unusually large single contracts and a strong preference for in-region data residency. Vendors without local cloud zones are effectively excluded from public tenders.


Cloud Robotics Market By Region, 2025-2035

Competitive Benchmarking

Concentration in the Cloud Robotics Market is low. Estimated HHI sits near 640, with the top five participants holding a combined 41–45% of revenue — a structure that reflects genuine architectural disagreement about where intelligence should reside rather than a maturing oligopoly. Hyperscalers, industrial automation incumbents, silicon vendors, and specialist platform startups are all competing from incompatible starting positions.

Company Est. Revenue Share Range Key Offerings for Cloud Robotics Market Strategic Positioning
Amazon Web Services ~11–14% Cloud infrastructure, GPU instances for robot simulation Infrastructure incumbent with fulfilment proof point
NVIDIA Corporation ~9–12% Isaac Sim, Isaac GR00T, OSMO orchestration Controls the simulation and foundation-model layer
Google (Alphabet Inc.) ~7–10% Cloud AI services, VLA robotics research Research-led, strong perception and language models
Microsoft Corporation ~6–9% Azure IoT and edge, industrial data services Enterprise-integrated, strong OT partnerships
ABB Ltd ~5–8% Connected robot fleets, industrial control platforms Automation incumbent with deep installed base
Huawei Technologies ~4–7% Cloud platform, 5G edge connectivity Dominant in China and adjacent emerging markets
Rockwell Automation ~3–6% Industrial cloud analytics, control integration Brownfield retrofit specialist in North America
IBM Corporation ~3–5% Hybrid cloud, edge orchestration, AI governance Regulated-industry and compliance positioning
Telefonaktiebolaget LM Ericsson ~2–4% Private 5G networks for industrial robotics Connectivity layer for latency-sensitive deployments
CloudMinds Technology ~2–4% Cloud brain architecture for service robots Pure-play cloud robotics operator
C2RO Cloud Robotics ~1–3% Perception and analytics platform Niche specialist in retail and public spaces


Recent News & Developments

  • NVIDIA and AWS (December 2024): Isaac Sim became available on Amazon EC2 G6e instances accelerated by L40S GPUs, with OSMO orchestrating workflows across cloud and on-premises resources — putting industrial simulation into rented capacity [4]


  • ISO (May 2025): ISO 25785-1 published as the first international safety standard for bipedal robots in industrial workplaces, giving auditors a certification reference for legged deployments [15]


  • China MIIT and five ministries (2025): The Humanoid Robot Action Plan set a target of 100,000 deployed humanoid units by 2027, following the 2024 roadmap for a full-stack domestic ecosystem [12]
  • International Federation of Robotics (September 2025): World Robotics 2025 reported 542,000 industrial robot installations in 2024 and an operational stock of 4,664,000 units, up 9% [1]
  • PTC and NVIDIA (2025): A design-to-simulation workflow linking cloud-native Onshape CAD to Isaac Sim via OpenUSD went live, with FANUC America and Fauna Robotics among early users [6]


  • Republic of Korea (2025): The K-Humanoid Alliance formed to build a national humanoid platform with standardised interfaces and a shared AI control stack targeting global competitiveness by 2030 [16]


Cloud Robotics Market Report Scope

Parameter Detail
Market Scope Global Cloud Robotics Market by offering, application, end-user industry and geography
Study Period 2021–2035 (Historical 2021–2024; Base Year 2025; Forecast 2026–2035)
CAGR 23.1% (2026–2035)
Market Size Checkpoints USD 11.5 B (2025); USD 14.2 B (2026); USD 32.6 B (2030); USD 92.1 B (2035)
Fastest Growing Segments Service (offering); Service Robot (application); Healthcare and Life Sciences (end-user)
Companies Profiled 11 major participants across infrastructure, silicon, automation and specialist platform tiers
Valuation Currency USD Billion

FAQs

What should procurement teams verify before signing a Cloud Robotics Market platform contract?
Check data egress fees, guaranteed latency thresholds, and whether robot telemetry remains portable across providers. The EU Data Act's switching provisions materially strengthen buyer leverage on portability. [14]
How does edge computing change the case for cloud robotics?
Edge handles safety-critical loops in single-digit milliseconds; cloud handles fleet learning, mapping, and analytics. Most production deployments now split workloads rather than choosing one architecture. [4]
Who bears liability when a cloud-controlled robot fails?
Liability typically splits between integrator and platform operator, depending on whether the fault sat in the control model or in local safety hardware. ISO 25785-1 gives auditors a reference point for workplace legged deployments. [15]
What integration costs do buyers in the Cloud Robotics Market consistently underestimate?
Network hardening, brownfield PLC bridging, and cybersecurity certification routinely add 20–30% to first-year budgets. Legacy fieldbus retrofits are the single biggest surprise line item. [9]
Is vendor lock-in a genuine risk?
Yes. Proprietary robot description formats and closed telemetry schemas make migration expensive, so buyers increasingly mandate ROS 2 compatibility and OpenUSD asset exchange in tenders. [5]
Which skills shortage most constrains Cloud Robotics Market adoption?
Engineers fluent in both DevOps pipelines and industrial safety standards. That hybrid profile is scarce, and wage premiums of 25–40% are common in North America and Germany. [9]
How should a mid-sized manufacturer phase adoption?
Start with one high-repetition cell under a subscription contract, instrument it fully, then scale once uptime data justifies capital commitment. Pilots launched without telemetry baselines almost always stall. [11]    
Author
Author
Author Profile
Ankit Gupta LinkedIn
Team Lead - Research
Ankit Gupta is a seasoned market intelligence and strategic research professional with over six plus years of experience in the ICT and Semiconductor industries. With academic roots in Telecom, Marketing, and Electronics, he blends technical insight with business strategy. Ankit has led 200+ projects, including work for Fortune 500 clients like Microsoft and Rio Tinto, covering market sizing, tech forecasting, and go-to-market strategies. Known for bridging engineering and enterprise decision-making, his insights support growth, innovation, and investment planning across diverse technology markets.

Research Approach


Secondary Research

The secondary research process involved comprehensive analysis of regulatory databases, peer-reviewed engineering journals, technical publications, and authoritative technology organizations. Key sources included the National Institute of Standards and Technology (NIST), International Organization for Standardization (ISO/IEC), IEEE Robotics and Automation Society, International Federation of Robotics (IFR), Association for Advancing Automation (A3), Defense Advanced Research Projects Agency (DARPA), National Science Foundation (NSF), European Committee for Electrotechnical Standardization (CENELEC), International Electrotechnical Commission (IEC), Robotics Industries Association (RIA), European Robotics Association (EUnited Robotics), Japan Robot Association (JARA), China Robot Industry Alliance (CRIA), International Telecommunication Union (ITU), Cloud Security Alliance (CSA), and national technology ministry reports from key markets. These sources were used to collect technology adoption statistics, regulatory compliance data, patent filings, interoperability standards, cloud infrastructure metrics, and market landscape analysis for service robots, industrial robots, collaborative robots, autonomous mobile robots, and underlying AI/ML cloud technologies.


Primary Research

Qualitative and quantitative insights were obtained by interviewing supply-side and demand-side stakeholders during the primary research process. CEOs, CTOs, VPs of Cloud Infrastructure, leaders of robotics engineering, and commercial directors from cloud robotics manufacturers, cloud service providers, and automation OEMs comprised the supply-side sources. Chief automation officers, plant managers, supply chain directors, and procurement leads from manufacturing facilities, logistics operators, healthcare systems, and retail enterprises constituted demand-side sources. Market segmentation was validated, product development roadmaps were confirmed, and insights regarding cloud adoption patterns, integration challenges, and pricing models for Robotics-as-a-Service (RaaS) were obtained through primary research.

Primary Respondent Breakdown:

By Designation: C-level Primaries (32%), Director Level (31%), Others (37%)

By Region: North America (38%), Europe (25%), Asia-Pacific (28%), Rest of World (9%)


Market Size Estimation

Global market valuation was derived through revenue mapping and deployment volume analysis. The methodology included:

Identification of over 50 significant technology providers in North America, Europe, Asia-Pacific, and Latin America

Product mapping across industrial robots, service robots, collaborative robots, autonomous mobile robots, and humanoid robots integrated with cloud platforms

Analysis of reported and modeled annual revenues specific to cloud robotics portfolios and cloud infrastructure services

Coverage of manufacturers and cloud providers representing 72-78% of global market share in 2024

Extrapolation using bottom-up (robot deployment volume × cloud service fees by country) and top-down (provider revenue validation) approaches to derive segment-specific valuations for healthcare, manufacturing, logistics, agriculture, construction, retail, transportation, education, and defense applications

NIST (National Institute of Standards and Technology) - Cloud computing and cybersecurity frameworks

ISO/IEC - Robotics and cloud computing standards (ISO 8373, ISO/IEC 17788)

IEEE - Robotics and Automation Society technical standards

IFR (International Federation of Robotics) - Global robotics statistics and market data

DARPA - Defense robotics and autonomous systems research

NSF (National Science Foundation) - Robotics and AI research funding data

A3 (Association for Advancing Automation) - North American robotics market statistics

JARA (Japan Robot Association) - Japanese robotics industry data

CRIA (China Robot Industry Alliance) - Chinese robotics market statistics

ITU (International Telecommunication Union) - Cloud infrastructure and connectivity standards

CENELEC - European robotics safety and interoperability standards

Download Free Sample

Kindly complete the form below to receive a free sample of this Report

* Please use a valid business email

Download PDF ×

We do not share your information with anyone. However, we may send you emails based on your report interest from time to time. You may contact us at any time to opt-out.
















