×
  • Cat-intel
  • MedIntelliX
  • Resources
  • About Us
  • Hero Background
    English
    Chinese
    French
    Japanese
    Korean
    German
    Spanish

    Hot Drinks & Soft Drinks Market Share

    ID: MRFR/FnB/10876-CR
    128 Pages
    Pradeep Nandi
    October 2023

    Hot Drinks & Soft Drinks Market Research Report Information By Type (Coffee, Tea, Carbonated soft drinks, Non-carbonated soft drinks, Hot chocolate, Apple cider, and Others), By Distribution Channel (Hypermarkets and Supermarkets, Convenience Stores, Department Stores, Dollar Stores, Variety Store, Cash and Carries and Warehouse Clubs, Food and Drinks Specialists, Drug Stores and Pharmacies...

    Share:
    Download PDF ×

    We do not share your information with anyone. However, we may send you emails based on your report interest from time to time. You may contact us at any time to opt-out.

    Hot Drinks & Soft Drinks Market Infographic
    Purchase Options

    Market Share

    Hot Drinks & Soft Drinks Market Share Analysis

    Competent market share positioning techniques are crucial for businesses to maintain their competitiveness and appeal to a wide range of customer preferences in the dynamic hot drinks & soft drinks industry. In this sector, diversification and innovation in products are two main strategies used. Businesses constantly launch new mixes, flavors, and beverage selections to adapt to shifting consumer preferences. Offering a range of options enables firms to appeal to a wider audience and adapt to changing consumer trends, whether it's through distinctive herbal tea treatments, exotic coffee mixes, or creative soft drink tastes. In the hot drinks & soft drinks market share positioning now heavily weighs health and wellbeing. As the focus on leading a healthy lifestyle increases, beverage companies are creating beverages with natural ingredients, lower sugar levels, and useful advantages. Companies may gain a substantial market share by appealing to consumers who are health-conscious and matching their goods with wellness trends. To carve yourself a unique place in the market, branding and narrative are essential. Remarkable businesses frequently craft stories about their history, sourcing practices, and dedication to sustainability. By adding a personal touch, storytelling helps customers and brands connect. Purchase decisions may be influenced by this emotional involvement, particularly from customers who respect honesty and openness. In the market for hot drinks & soft drinks, strategic alliances and partnerships are typical tactics. By partnering with prominent influencers, famous people, or health specialists, firms may increase their reputation and capitalize on their current audiences. Co-branding projects, such partnerships with well-known eateries or cafés, can also help to boost market share and visibility. To stand out from the competition on packed shelves, packaging and appearance are essential components. Additionally, packaging can be visually appealing and attract attention to detail, but it also communicates a brand's commitment to sustainability. Packaging concepts that are both helpful and unique improve consumer happiness, market placement, and loyalty to the company. In the market share tactics of the hot drinks & soft drinks industry, price positioning is crucial. To identify the ideal pricing range for their products, brands closely examine the interests and behavior of their customers. Some decide to market themselves as luxury solutions, highlighting exclusivity and quality, while others put more of an emphasis on price in order to reach a wider audience. Market share positioning takes accessibility and distribution channels into account. Brands systematically increase their visibility across a range of retail channels, including online platforms, convenience shops, and supermarkets. Having a product widely available improves accessibility and brand visibility, which increases market share.

    Adaptability and a deep awareness of market trends are going to be essential for firms striving for an important place in this ever-expanding industry, as customer tastes continue to change. Given the constant shift in consumer preferences, companies looking to secure a significant position in this rapidly growing sector will need to possess both adaptability and a keen understanding of market developments.

    Author
    Pradeep Nandi
    Senior Research Analyst

    I have a bachelor's degree in mechanical engineering and an MBA. I have more than two years of expertise in the retail, food, and beverage, chemical, and material industries, and hence have developed a sound cross-domain expertise. A firm believer in lifelong learning and sharing of knowledge. Having a proclivity for hatching ideas and trying to absorb as much information as possible in a short amount of time. Introducing corporates to the data and insight, which enables them to move from probability to possibility, has been my key areas of interest. 

    Leave a Comment

    FAQs

    What is the current valuation of the Hot Drinks & Soft Drinks Market in 2025?

    The market valuation stands at approximately 704.86 USD Billion as of 2024.

    What is the projected market size for the Hot Drinks & Soft Drinks Market by 2035?

    The market is expected to reach around 1324.5 USD Billion by 2035.

    What is the expected CAGR for the Hot Drinks & Soft Drinks Market during the forecast period 2025 - 2035?

    The anticipated CAGR for this market is 5.9% from 2025 to 2035.

    Which segment of the Hot Drinks & Soft Drinks Market has the highest valuation?

    Carbonated soft drinks exhibit the highest valuation, ranging from 200.0 to 400.0 USD Billion.

    How do coffee and tea segments compare in terms of market valuation?

    The coffee segment is valued between 150.0 and 300.0 USD Billion, while tea ranges from 120.0 to 240.0 USD Billion.

    What distribution channel shows the largest market share in the Hot Drinks & Soft Drinks Market?

    Hypermarkets and supermarkets dominate the distribution channel, with a valuation between 200.0 and 400.0 USD Billion.

    Market Summary

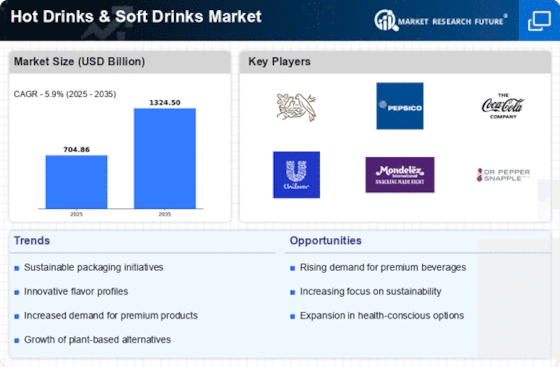
    As per MRFR analysis, the Hot Drinks & Soft Drinks Market was estimated at 704.86 USD Billion in 2024. The Hot Drinks & Soft Drinks industry is projected to grow from 746.46 USD Billion in 2025 to 1324.5 USD Billion by 2035, exhibiting a compound annual growth rate (CAGR) of 5.9 during the forecast period 2025 - 2035.

    Key Market Trends & Highlights

    The Hot Drinks and Soft Drinks Market is experiencing a dynamic shift towards health-conscious and sustainable consumption patterns.

    • The North American market remains the largest, driven by a strong demand for coffee and soft drinks.
    • Asia-Pacific is the fastest-growing region, with tea gaining popularity among health-conscious consumers.
    • Hypermarkets and supermarkets continue to dominate sales, while convenience stores are rapidly expanding their market presence.
    • Health consciousness and sustainability trends are key drivers influencing consumer preferences in both segments.

    Market Size & Forecast

    2024 Market Size 704.86 (USD Billion)
    2035 Market Size 1324.5 (USD Billion)
    CAGR (2025 - 2035) 5.9%
    Largest Regional Market Share in 2024 North America

    Major Players

    <p>Nestle (CH), PepsiCo (US), Coca-Cola (US), Unilever (GB), Mondelez International (US), Dr Pepper Snapple Group (US), Kraft Heinz (US), Associated British Foods (GB), Danone (FR)</p>

    Market Trends

    The Hot Drinks & Soft Drinks Market is currently experiencing a dynamic evolution, driven by shifting consumer preferences and an increasing focus on health and wellness. As individuals become more health-conscious, there is a noticeable trend towards beverages that offer functional benefits, such as enhanced hydration, energy boosts, and natural ingredients. This shift is prompting manufacturers to innovate and diversify their product offerings, leading to a broader range of options that cater to various dietary needs and lifestyle choices. Additionally, sustainability has emerged as a pivotal factor influencing purchasing decisions, with consumers increasingly favoring brands that prioritize eco-friendly practices and packaging. Moreover, the rise of e-commerce has transformed the way consumers access these beverages, allowing for greater convenience and variety. Online platforms are becoming essential for brands to reach their target audiences, as they provide a space for direct engagement and personalized marketing. This trend is likely to continue shaping the Hot Drinks & Soft Drinks Market, as digital channels facilitate the introduction of new products and enhance consumer experiences. Overall, the market appears poised for continued growth, driven by innovation, health trends, and evolving consumer behaviors.

    Health and Wellness Focus

    There is a growing emphasis on beverages that provide health benefits, such as functional ingredients and natural components. Consumers are increasingly seeking options that support their well-being, leading to a rise in demand for products that promote hydration, energy, and overall health.

    Sustainability Initiatives

    Brands are increasingly adopting sustainable practices in response to consumer demand for environmentally friendly products. This includes using eco-conscious packaging and sourcing ingredients responsibly, which resonates with a demographic that values sustainability.

    E-commerce Expansion

    The shift towards online shopping is reshaping the Hot Drinks & Soft Drinks Market. E-commerce platforms are becoming vital for brands to connect with consumers, offering convenience and a wider selection of products, thus enhancing the overall shopping experience.

    Hot Drinks & Soft Drinks Market Market Drivers

    E-commerce Growth

    The expansion of e-commerce is emerging as a significant driver in the Hot Drinks & Soft Drinks Market. With the increasing reliance on online shopping, consumers are now more inclined to purchase beverages through digital platforms. Recent data indicates that online sales of soft drinks and hot beverages have seen substantial growth, reflecting a shift in shopping habits. This trend suggests that brands may need to enhance their online presence and invest in digital marketing strategies to capture this growing segment. Additionally, the convenience of home delivery services is likely to further boost e-commerce sales, as consumers prioritize convenience in their purchasing decisions. As e-commerce continues to evolve, its impact on the market dynamics is expected to be profound, potentially reshaping traditional retail strategies.

    Health Consciousness

    The increasing awareness of health and wellness among consumers appears to be a pivotal driver in the Hot Drinks & Soft Drinks Market. As individuals become more health-conscious, they tend to gravitate towards beverages that offer functional benefits, such as herbal teas and low-calorie soft drinks. According to recent data, the demand for organic and natural ingredients has surged, with a notable increase in sales of beverages that are free from artificial additives. This trend suggests that manufacturers are likely to innovate and reformulate their products to align with consumer preferences, thereby enhancing their market presence. The health consciousness trend not only influences product development but also shapes marketing strategies, as brands strive to communicate their health benefits effectively.

    Sustainability Trends

    Sustainability initiatives are increasingly shaping the Hot Drinks & Soft Drinks Market, as consumers exhibit a growing preference for environmentally friendly products. This shift is evidenced by the rising demand for beverages packaged in recyclable materials and those produced through sustainable practices. Recent statistics indicate that brands adopting eco-friendly packaging have experienced a significant uptick in sales, reflecting a broader consumer trend towards sustainability. Companies are now more likely to invest in sustainable sourcing of ingredients and transparent supply chains, which may enhance their brand loyalty. As environmental concerns continue to escalate, the emphasis on sustainability is expected to drive innovation and competition within the market, compelling brands to adopt greener practices.

    Technological Advancements

    Technological advancements are playing a crucial role in transforming the Hot Drinks & Soft Drinks Market. Innovations in production processes, such as improved extraction methods for flavors and nutrients, are enhancing product quality and consistency. Additionally, the rise of smart vending machines and mobile applications for beverage purchases indicates a shift towards convenience and personalization. Data suggests that the integration of technology in marketing strategies, such as targeted advertising and social media engagement, is becoming increasingly prevalent. This technological evolution not only streamlines operations but also allows brands to better understand consumer preferences, potentially leading to more tailored product offerings. As technology continues to evolve, its impact on the market is likely to grow, fostering new opportunities for engagement and sales.

    Changing Consumer Preferences

    Changing consumer preferences are significantly influencing the Hot Drinks & Soft Drinks Market. The shift towards unique flavors and premium products is evident, as consumers seek novel experiences in their beverage choices. Recent market analysis indicates a growing interest in specialty coffees, exotic teas, and craft sodas, which cater to the desire for authenticity and quality. This trend suggests that brands may need to diversify their product lines to meet evolving tastes and preferences. Furthermore, the rise of social media has amplified the demand for visually appealing and shareable beverages, prompting companies to innovate in both flavor and presentation. As consumer preferences continue to evolve, the market is likely to witness a dynamic shift towards more diverse and premium offerings.

    Market Segment Insights

    By Type: Coffee (Largest) vs. Tea (Fastest-Growing)

    <p>In the Hot Drinks & Soft Drinks Market, the distribution of market share is led by Coffee, which holds the largest share among the different types of beverages. Following Coffee, Tea has become increasingly popular, capturing a substantial share and emerging as a strong competitor in the market. Other segments, such as Carbonated and Non-carbonated soft drinks, along with Hot chocolate and Apple cider, contribute to the diversity of choices available for consumers, but they trail behind the dominant positions held by Coffee and Tea.</p>

    <p>Coffee: Dominant vs. Tea: Emerging</p>

    <p>Coffee remains the dominant player in the Hot Drinks & Soft Drinks Market, favored for its robust flavor and energy-boosting capabilities. Diverse preparation methods and growing specialty coffee trends further enhance its appeal, fostering loyalty among consumers. In contrast, Tea is witnessing rapid growth, fueled by the increasing health consciousness of consumers and a growing preference for natural, less processed beverages. Various flavors and health benefits associated with Tea, such as antioxidative properties, are resonating well with consumers, making it an emerging favorite. As both segments continue to evolve, they are expected to shape the future landscape of the beverage market significantly.</p>

    By Distribution Channel: Hypermarkets and Supermarkets (Largest) vs. Convenience Stores (Fastest-Growing)

    <p>In the Hot Drinks & Soft Drinks Market, Hypermarkets and Supermarkets hold the largest share, dominating the retail landscape with their extensive product ranges and competitive pricing strategies. Convenience Stores, while smaller in market share, are rapidly gaining traction due to their consumer-friendly locations and ease of access. Together, these channels not only fulfill a significant portion of consumer demand but also showcase the diversity of preferences among buyers.</p>

    <p>Hypermarkets and Supermarkets (Dominant) vs. Convenience Stores (Emerging)</p>

    <p>Hypermarkets and Supermarkets are pivotal in the Hot Drinks & Soft Drinks Market, offering a wide variety of brands and packaging options to cater to diverse customer needs. Their large floor space enables them to stock a broad range of products, attracting bulk buyers. On the other hand, Convenience Stores are emerging as a popular choice for consumers seeking quick and easy purchases, especially for on-the-go consumption of hot and soft drinks. Their strategic locations and extended hours make them appealing, driving their rapid growth while presenting an alternative distribution point for brands.</p>

    By End User: Coffee Shops (Largest) vs. Food Services (Fastest-Growing)

    <p>In the Hot Drinks & Soft Drinks Market, the distribution of market share among end users is significantly skewed towards coffee shops, which dominate this segment due to their established presence and loyal customer base. Drink stores and food services also contribute to market dynamics, although to a lesser extent, with coffee shops accounting for a substantial portion of the overall market. The drink stores segment is witnessing healthy growth, primarily driven by consumer demand for convenience and ready-to-drink options.</p>

    <p>Coffee Shops: Dominant vs. Food Services: Emerging</p>

    <p>Coffee shops have secured a dominant position in the Hot Drinks & Soft Drinks Market, primarily due to their ability to create niche offerings and foster customer loyalty through unique blends and specialty drinks. They represent a significant part of the cultural fabric, providing not just beverages but a social space. On the other hand, food services are emerging as a fast-growing segment, driven by the increasing number of restaurants and eateries looking to diversify their beverage offerings. This segment is characterized by its adaptability to trends, such as health-conscious choices and innovative drink concepts, which resonate with evolving consumer preferences.</p>

    Get more detailed insights about Hot Drinks & Soft Drinks Market Research Report – Forecast till 2035

    Regional Insights

    North America : Market Leader in Consumption

    North America is the largest market for hot drinks and soft drinks, accounting for approximately 40% of the global market share. The region's growth is driven by increasing health consciousness, innovative product offerings, and a strong retail infrastructure. Regulatory support for health-oriented beverages and sustainability initiatives further catalyze market expansion. The U.S. and Canada are the primary contributors, with the U.S. alone holding around 35% of the market share. The competitive landscape is characterized by major players such as PepsiCo, Coca-Cola, and Nestle, which dominate the market with their extensive product portfolios. The presence of these key players fosters innovation and competition, leading to a diverse range of offerings. Additionally, the growing trend of premiumization and organic products is reshaping consumer preferences, pushing companies to adapt and innovate continuously.

    Europe : Emerging Trends in Beverages

    Europe is witnessing a significant shift in the hot drinks and soft drinks market, holding approximately 30% of the global market share. The region's growth is propelled by increasing consumer demand for sustainable and organic products, alongside stringent regulations promoting health and wellness. Countries like Germany and the UK are leading this trend, with Germany accounting for about 15% of the market share, driven by a strong preference for eco-friendly packaging and healthier beverage options. The competitive landscape in Europe is marked by the presence of key players such as Unilever and Danone, who are actively investing in sustainable practices and innovative product lines. The market is also characterized by a growing number of local brands that cater to niche segments, enhancing competition. Regulatory bodies are increasingly focusing on reducing sugar content in beverages, which is shaping product development and marketing strategies across the region.

    Asia-Pacific : Rapid Growth and Innovation

    Asia-Pacific is rapidly emerging as a powerhouse in the hot drinks and soft drinks market, holding around 25% of the global market share. The region's growth is driven by urbanization, rising disposable incomes, and changing consumer preferences towards convenience and health. China and India are the largest markets, with China alone accounting for approximately 20% of the market share, fueled by a growing middle class and increasing demand for premium beverages. The competitive landscape is vibrant, with both The Hot Drinks & Soft Drinks Market share. Companies like Coca-Cola and Nestle are expanding their footprints, while local brands are innovating to cater to regional tastes. The presence of diverse beverage options, including traditional drinks, is also contributing to market growth. Regulatory frameworks are evolving to support health initiatives, further enhancing the market's potential.

    Middle East and Africa : Untapped Market Potential

    The Middle East and Africa region is an emerging market for hot drinks and soft drinks, holding approximately 5% of the global market share. The growth is driven by increasing urbanization, a young population, and rising disposable incomes. Countries like South Africa and the UAE are leading the market, with South Africa accounting for about 3% of the market share, driven by a growing demand for both traditional and modern beverage options. The competitive landscape is characterized by a mix of local and international players, with companies like Associated British Foods and Coca-Cola expanding their presence. The region's unique cultural preferences are influencing product offerings, leading to a rise in demand for flavored and functional beverages. Regulatory bodies are beginning to implement health-focused initiatives, which are expected to shape the market landscape in the coming years.

    Key Players and Competitive Insights

    Leading market players are investing heavily in research and development in order to expand their product lines, which will help the hot drinks & soft drinks market, grow even more. Market participants are also undertaking a variety of strategic activities to expand their footprint, with important market developments including new product launches, contractual agreements, mergers and acquisitions, higher investments, and collaboration with other organizations. To expand and survive in a more competitive and rising market climate, hot drinks & soft drinks industry must offer cost-effective items.

    Manufacturing locally to minimize operational costs is one of the key business tactics used by manufacturers in the hot drinks & soft drinks industry to benefit clients and increase the market sector. In recent years, the hot drinks & soft drinks industry has offered some of the most significant advantages to medicine.

    Major players in the hot drinks & soft drinks market are attempting to increase market demand by investing in research and development operations includes The Coffee Bean & Tea Leaf (U.S), Unilever (U.K), Gourmesso (U.S), Harney & Sons Fine Teas (U.S), Dualit (U.K), Nestlé SA  (Switzerland), Dilmah Ceylon Tea Company PLC (Sri Lanka), Ippodo Tea Co. Ltd. (China), Tranquini (U.S), Chillbev (U.S), Som Sleep.(U.S), Phi Drinks, Inc.(U.S), BevNet.com (U.S), Pepsico, Inc.; The Coca-Cola Company; Keurig Dr Pepper Inc (KDP); Red Bull GmbH; Monster Energy Company; Appalachian Brewing Company; ITO EN INC.; and AriZona Beverages USA LLC.

    Manufacturer and seller of fast-moving consumer goods is Unilever Plc (Unilever). Food items, cosmetics, personal care items, beverages, home care items, vitamins, minerals, and dietary supplements are all included in the company's product line. Products are offered to brick-and-mortar store partners, small family-run businesses, online retailers, and discount merchants. In the Americas, Europe, Asia-Pacific, Africa, and the Middle East, the company has commercial presence. The UK's capital city of London serves as Unilever's headquarters.

    Manufacturer and distributor of food and beverage products is Nestle SA (Nestle). The product line of the company includes infant meals, bottled water, cereals, chocolates and other confections, coffee, and food items. Additionally, it offers dairy goods, nutritional products, ice cream, chilled and frozen meals, plant-based foods, chilled and frozen foods, dairy products, and pet care items. The corporation conducts business in Africa, the Middle East, Europe, Asia, and Oceania. Vevey, Waadt, Switzerland is home to Nestle's headquarters.

    Key Companies in the Hot Drinks & Soft Drinks Market market include

    Industry Developments

    June 2022: An official contract was signed for the purchase of the worldwide rights to the non-alcoholic, ready-to-drink cocktail brand Atypique by Quebec-based Keurig Dr Pepper Inc.

    March 2021: JDE Peet's and J.M. Smucker Co. announced a strategic relationship that will enable JDE Peet's to support the Smucker Away From Home liquid coffee business with product research, production, and food service equipment innovation.

    February 2020: Starbucks and PepsiCo Inc. introduced canned versions of their ready-to-drink Starbucks Nitro Cold Brew beverage. The three flavors of the drinks with nitrogen are black, vanilla sweet cream, and dark caramel.

    Future Outlook

    Hot Drinks & Soft Drinks Market Future Outlook

    <p>The Hot Drinks & Soft Drinks Market is projected to grow at a 5.9% CAGR from 2024 to 2035, driven by health trends, innovation, and sustainability initiatives.</p>

    New opportunities lie in:

    • <p>Expansion of plant-based beverage lines to capture health-conscious consumers.</p>
    • <p>Investment in smart vending machines for personalized drink options.</p>
    • <p>Development of eco-friendly packaging solutions to enhance brand loyalty.</p>

    <p>By 2035, the market is expected to be robust, reflecting evolving consumer preferences and innovative strategies.</p>

    Market Segmentation

    Hot Drinks & Soft Drinks Market Type Outlook

    • Coffee
    • Tea
    • Carbonated soft drinks
    • Non-carbonated soft drinks
    • Hot chocolate
    • Apple cider
    • Others

    Hot Drinks & Soft Drinks Market End User Outlook

    • Coffee Shops
    • Drink Stores
    • Food Services

    Hot Drinks & Soft Drinks Market Distribution Channel Outlook

    • Hypermarkets and Supermarkets
    • Convenience Stores
    • Department Stores
    • Dollar Stores
    • Variety Store
    • Cash and Carries and Warehouse Clubs
    • Food and Drinks Specialists
    • Drug Stores and Pharmacies
    • Health and Beauty Stores

    Report Scope

    MARKET SIZE 2024704.86(USD Billion)
    MARKET SIZE 2025746.46(USD Billion)
    MARKET SIZE 20351324.5(USD Billion)
    COMPOUND ANNUAL GROWTH RATE (CAGR)5.9% (2024 - 2035)
    REPORT COVERAGERevenue Forecast, Competitive Landscape, Growth Factors, and Trends
    BASE YEAR2024
    Market Forecast Period2025 - 2035
    Historical Data2019 - 2024
    Market Forecast UnitsUSD Billion
    Key Companies ProfiledMarket analysis in progress
    Segments CoveredMarket segmentation analysis in progress
    Key Market OpportunitiesGrowing demand for health-conscious beverages in the Hot Drinks and Soft Drinks Market presents significant opportunities.
    Key Market DynamicsShifting consumer preferences towards healthier options drive innovation and competition in the Hot Drinks and Soft Drinks Market.
    Countries CoveredNorth America, Europe, APAC, South America, MEA

    FAQs

    What is the current valuation of the Hot Drinks & Soft Drinks Market in 2025?

    The market valuation stands at approximately 704.86 USD Billion as of 2024.

    What is the projected market size for the Hot Drinks & Soft Drinks Market by 2035?

    The market is expected to reach around 1324.5 USD Billion by 2035.

    What is the expected CAGR for the Hot Drinks & Soft Drinks Market during the forecast period 2025 - 2035?

    The anticipated CAGR for this market is 5.9% from 2025 to 2035.

    Which segment of the Hot Drinks & Soft Drinks Market has the highest valuation?

    Carbonated soft drinks exhibit the highest valuation, ranging from 200.0 to 400.0 USD Billion.

    How do coffee and tea segments compare in terms of market valuation?

    The coffee segment is valued between 150.0 and 300.0 USD Billion, while tea ranges from 120.0 to 240.0 USD Billion.

    What distribution channel shows the largest market share in the Hot Drinks & Soft Drinks Market?

    Hypermarkets and supermarkets dominate the distribution channel, with a valuation between 200.0 and 400.0 USD Billion.

    1. SECTION I: EXECUTIVE SUMMARY AND KEY HIGHLIGHTS
      1. EXECUTIVE SUMMARY
        1. Market Overview
        2. Key Findings
        3. Market Segmentation
        4. Competitive Landscape
        5. Challenges and Opportunities
        6. Future Outlook
    2. SECTION II: SCOPING, METHODOLOGY AND MARKET STRUCTURE
      1. MARKET INTRODUCTION
        1. Definition
        2. Scope of the study
      2. RESEARCH METHODOLOGY
        1. Overview
        2. Data Mining
        3. Secondary Research
        4. Primary Research
        5. Forecasting Model
        6. Market Size Estimation
        7. Data Triangulation
        8. Validation
    3. SECTION III: QUALITATIVE ANALYSIS
      1. MARKET DYNAMICS
        1. Overview
        2. Drivers
        3. Restraints
        4. Opportunities
      2. MARKET FACTOR ANALYSIS
        1. Value chain Analysis
        2. Porter's Five Forces Analysis
        3. COVID-19 Impact Analysis
    4. SECTION IV: QUANTITATIVE ANALYSIS
      1. Food, Beverages & Nutrition, BY Type (USD Billion)
        1. Coffee
        2. Tea
        3. Carbonated soft drinks
        4. Non-carbonated soft drinks
        5. Hot chocolate
        6. Apple cider
        7. Others
      2. Food, Beverages & Nutrition, BY Distribution Channel (USD Billion)
        1. Hypermarkets and Supermarkets
        2. Convenience Stores
        3. Department Stores
        4. Dollar Stores
        5. Variety Store
        6. Cash and Carries and Warehouse Clubs
        7. Food and Drinks Specialists
        8. Drug Stores and Pharmacies
        9. Health and Beauty Stores
      3. Food, Beverages & Nutrition, BY End User (USD Billion)
        1. Coffee Shops
        2. Drink Stores
        3. Food Services
      4. Food, Beverages & Nutrition, BY Region (USD Billion)
        1. North America
        2. Europe
        3. APAC
        4. South America
        5. MEA
    5. SECTION V: COMPETITIVE ANALYSIS
      1. Competitive Landscape
        1. Overview
        2. Competitive Analysis
        3. Market share Analysis
        4. Major Growth Strategy in the Food, Beverages & Nutrition
        5. Competitive Benchmarking
        6. Leading Players in Terms of Number of Developments in the Food, Beverages & Nutrition
        7. Key developments and growth strategies
        8. Major Players Financial Matrix
      2. Company Profiles
        1. Nestle (CH)
        2. PepsiCo (US)
        3. Coca-Cola (US)
        4. Unilever (GB)
        5. Mondelez International (US)
        6. Dr Pepper Snapple Group (US)
        7. Kraft Heinz (US)
        8. Associated British Foods (GB)
        9. Danone (FR)
      3. Appendix
        1. References
        2. Related Reports
    6. LIST OF FIGURES
      1. MARKET SYNOPSIS
      2. NORTH AMERICA MARKET ANALYSIS
      3. US MARKET ANALYSIS BY TYPE
      4. US MARKET ANALYSIS BY DISTRIBUTION CHANNEL
      5. US MARKET ANALYSIS BY END USER
      6. CANADA MARKET ANALYSIS BY TYPE
      7. CANADA MARKET ANALYSIS BY DISTRIBUTION CHANNEL
      8. CANADA MARKET ANALYSIS BY END USER
      9. EUROPE MARKET ANALYSIS
      10. GERMANY MARKET ANALYSIS BY TYPE
      11. GERMANY MARKET ANALYSIS BY DISTRIBUTION CHANNEL
      12. GERMANY MARKET ANALYSIS BY END USER
      13. UK MARKET ANALYSIS BY TYPE
      14. UK MARKET ANALYSIS BY DISTRIBUTION CHANNEL
      15. UK MARKET ANALYSIS BY END USER
      16. FRANCE MARKET ANALYSIS BY TYPE
      17. FRANCE MARKET ANALYSIS BY DISTRIBUTION CHANNEL
      18. FRANCE MARKET ANALYSIS BY END USER
      19. RUSSIA MARKET ANALYSIS BY TYPE
      20. RUSSIA MARKET ANALYSIS BY DISTRIBUTION CHANNEL
      21. RUSSIA MARKET ANALYSIS BY END USER
      22. ITALY MARKET ANALYSIS BY TYPE
      23. ITALY MARKET ANALYSIS BY DISTRIBUTION CHANNEL
      24. ITALY MARKET ANALYSIS BY END USER
      25. SPAIN MARKET ANALYSIS BY TYPE
      26. SPAIN MARKET ANALYSIS BY DISTRIBUTION CHANNEL
      27. SPAIN MARKET ANALYSIS BY END USER
      28. REST OF EUROPE MARKET ANALYSIS BY TYPE
      29. REST OF EUROPE MARKET ANALYSIS BY DISTRIBUTION CHANNEL
      30. REST OF EUROPE MARKET ANALYSIS BY END USER
      31. APAC MARKET ANALYSIS
      32. CHINA MARKET ANALYSIS BY TYPE
      33. CHINA MARKET ANALYSIS BY DISTRIBUTION CHANNEL
      34. CHINA MARKET ANALYSIS BY END USER
      35. INDIA MARKET ANALYSIS BY TYPE
      36. INDIA MARKET ANALYSIS BY DISTRIBUTION CHANNEL
      37. INDIA MARKET ANALYSIS BY END USER
      38. JAPAN MARKET ANALYSIS BY TYPE
      39. JAPAN MARKET ANALYSIS BY DISTRIBUTION CHANNEL
      40. JAPAN MARKET ANALYSIS BY END USER
      41. SOUTH KOREA MARKET ANALYSIS BY TYPE
      42. SOUTH KOREA MARKET ANALYSIS BY DISTRIBUTION CHANNEL
      43. SOUTH KOREA MARKET ANALYSIS BY END USER
      44. MALAYSIA MARKET ANALYSIS BY TYPE
      45. MALAYSIA MARKET ANALYSIS BY DISTRIBUTION CHANNEL
      46. MALAYSIA MARKET ANALYSIS BY END USER
      47. THAILAND MARKET ANALYSIS BY TYPE
      48. THAILAND MARKET ANALYSIS BY DISTRIBUTION CHANNEL
      49. THAILAND MARKET ANALYSIS BY END USER
      50. INDONESIA MARKET ANALYSIS BY TYPE
      51. INDONESIA MARKET ANALYSIS BY DISTRIBUTION CHANNEL
      52. INDONESIA MARKET ANALYSIS BY END USER
      53. REST OF APAC MARKET ANALYSIS BY TYPE
      54. REST OF APAC MARKET ANALYSIS BY DISTRIBUTION CHANNEL
      55. REST OF APAC MARKET ANALYSIS BY END USER
      56. SOUTH AMERICA MARKET ANALYSIS
      57. BRAZIL MARKET ANALYSIS BY TYPE
      58. BRAZIL MARKET ANALYSIS BY DISTRIBUTION CHANNEL
      59. BRAZIL MARKET ANALYSIS BY END USER
      60. MEXICO MARKET ANALYSIS BY TYPE
      61. MEXICO MARKET ANALYSIS BY DISTRIBUTION CHANNEL
      62. MEXICO MARKET ANALYSIS BY END USER
      63. ARGENTINA MARKET ANALYSIS BY TYPE
      64. ARGENTINA MARKET ANALYSIS BY DISTRIBUTION CHANNEL
      65. ARGENTINA MARKET ANALYSIS BY END USER
      66. REST OF SOUTH AMERICA MARKET ANALYSIS BY TYPE
      67. REST OF SOUTH AMERICA MARKET ANALYSIS BY DISTRIBUTION CHANNEL
      68. REST OF SOUTH AMERICA MARKET ANALYSIS BY END USER
      69. MEA MARKET ANALYSIS
      70. GCC COUNTRIES MARKET ANALYSIS BY TYPE
      71. GCC COUNTRIES MARKET ANALYSIS BY DISTRIBUTION CHANNEL
      72. GCC COUNTRIES MARKET ANALYSIS BY END USER
      73. SOUTH AFRICA MARKET ANALYSIS BY TYPE
      74. SOUTH AFRICA MARKET ANALYSIS BY DISTRIBUTION CHANNEL
      75. SOUTH AFRICA MARKET ANALYSIS BY END USER
      76. REST OF MEA MARKET ANALYSIS BY TYPE
      77. REST OF MEA MARKET ANALYSIS BY DISTRIBUTION CHANNEL
      78. REST OF MEA MARKET ANALYSIS BY END USER
      79. KEY BUYING CRITERIA OF FOOD, BEVERAGES & NUTRITION
      80. RESEARCH PROCESS OF MRFR
      81. DRO ANALYSIS OF FOOD, BEVERAGES & NUTRITION
      82. DRIVERS IMPACT ANALYSIS: FOOD, BEVERAGES & NUTRITION
      83. RESTRAINTS IMPACT ANALYSIS: FOOD, BEVERAGES & NUTRITION
      84. SUPPLY / VALUE CHAIN: FOOD, BEVERAGES & NUTRITION
      85. FOOD, BEVERAGES & NUTRITION, BY TYPE, 2024 (% SHARE)
      86. FOOD, BEVERAGES & NUTRITION, BY TYPE, 2024 TO 2035 (USD Billion)
      87. FOOD, BEVERAGES & NUTRITION, BY DISTRIBUTION CHANNEL, 2024 (% SHARE)
      88. FOOD, BEVERAGES & NUTRITION, BY DISTRIBUTION CHANNEL, 2024 TO 2035 (USD Billion)
      89. FOOD, BEVERAGES & NUTRITION, BY END USER, 2024 (% SHARE)
      90. FOOD, BEVERAGES & NUTRITION, BY END USER, 2024 TO 2035 (USD Billion)
      91. BENCHMARKING OF MAJOR COMPETITORS
    7. LIST OF TABLES
      1. LIST OF ASSUMPTIONS
      2. 7.1.1
      3. North America MARKET SIZE ESTIMATES; FORECAST
        1. BY TYPE, 2025-2035 (USD Billion)
        2. BY DISTRIBUTION CHANNEL, 2025-2035 (USD Billion)
        3. BY END USER, 2025-2035 (USD Billion)
      4. US MARKET SIZE ESTIMATES; FORECAST
        1. BY TYPE, 2025-2035 (USD Billion)
        2. BY DISTRIBUTION CHANNEL, 2025-2035 (USD Billion)
        3. BY END USER, 2025-2035 (USD Billion)
      5. Canada MARKET SIZE ESTIMATES; FORECAST
        1. BY TYPE, 2025-2035 (USD Billion)
        2. BY DISTRIBUTION CHANNEL, 2025-2035 (USD Billion)
        3. BY END USER, 2025-2035 (USD Billion)
      6. Europe MARKET SIZE ESTIMATES; FORECAST
        1. BY TYPE, 2025-2035 (USD Billion)
        2. BY DISTRIBUTION CHANNEL, 2025-2035 (USD Billion)
        3. BY END USER, 2025-2035 (USD Billion)
      7. Germany MARKET SIZE ESTIMATES; FORECAST
        1. BY TYPE, 2025-2035 (USD Billion)
        2. BY DISTRIBUTION CHANNEL, 2025-2035 (USD Billion)
        3. BY END USER, 2025-2035 (USD Billion)
      8. UK MARKET SIZE ESTIMATES; FORECAST
        1. BY TYPE, 2025-2035 (USD Billion)
        2. BY DISTRIBUTION CHANNEL, 2025-2035 (USD Billion)
        3. BY END USER, 2025-2035 (USD Billion)
      9. France MARKET SIZE ESTIMATES; FORECAST
        1. BY TYPE, 2025-2035 (USD Billion)
        2. BY DISTRIBUTION CHANNEL, 2025-2035 (USD Billion)
        3. BY END USER, 2025-2035 (USD Billion)
      10. Russia MARKET SIZE ESTIMATES; FORECAST
        1. BY TYPE, 2025-2035 (USD Billion)
        2. BY DISTRIBUTION CHANNEL, 2025-2035 (USD Billion)
        3. BY END USER, 2025-2035 (USD Billion)
      11. Italy MARKET SIZE ESTIMATES; FORECAST
        1. BY TYPE, 2025-2035 (USD Billion)
        2. BY DISTRIBUTION CHANNEL, 2025-2035 (USD Billion)
        3. BY END USER, 2025-2035 (USD Billion)
      12. Spain MARKET SIZE ESTIMATES; FORECAST
        1. BY TYPE, 2025-2035 (USD Billion)
        2. BY DISTRIBUTION CHANNEL, 2025-2035 (USD Billion)
        3. BY END USER, 2025-2035 (USD Billion)
      13. Rest of Europe MARKET SIZE ESTIMATES; FORECAST
        1. BY TYPE, 2025-2035 (USD Billion)
        2. BY DISTRIBUTION CHANNEL, 2025-2035 (USD Billion)
        3. BY END USER, 2025-2035 (USD Billion)
      14. APAC MARKET SIZE ESTIMATES; FORECAST
        1. BY TYPE, 2025-2035 (USD Billion)
        2. BY DISTRIBUTION CHANNEL, 2025-2035 (USD Billion)
        3. BY END USER, 2025-2035 (USD Billion)
      15. China MARKET SIZE ESTIMATES; FORECAST
        1. BY TYPE, 2025-2035 (USD Billion)
        2. BY DISTRIBUTION CHANNEL, 2025-2035 (USD Billion)
        3. BY END USER, 2025-2035 (USD Billion)
      16. India MARKET SIZE ESTIMATES; FORECAST
        1. BY TYPE, 2025-2035 (USD Billion)
        2. BY DISTRIBUTION CHANNEL, 2025-2035 (USD Billion)
        3. BY END USER, 2025-2035 (USD Billion)
      17. Japan MARKET SIZE ESTIMATES; FORECAST
        1. BY TYPE, 2025-2035 (USD Billion)
        2. BY DISTRIBUTION CHANNEL, 2025-2035 (USD Billion)
        3. BY END USER, 2025-2035 (USD Billion)
      18. South Korea MARKET SIZE ESTIMATES; FORECAST
        1. BY TYPE, 2025-2035 (USD Billion)
        2. BY DISTRIBUTION CHANNEL, 2025-2035 (USD Billion)
        3. BY END USER, 2025-2035 (USD Billion)
      19. Malaysia MARKET SIZE ESTIMATES; FORECAST
        1. BY TYPE, 2025-2035 (USD Billion)
        2. BY DISTRIBUTION CHANNEL, 2025-2035 (USD Billion)
        3. BY END USER, 2025-2035 (USD Billion)
      20. Thailand MARKET SIZE ESTIMATES; FORECAST
        1. BY TYPE, 2025-2035 (USD Billion)
        2. BY DISTRIBUTION CHANNEL, 2025-2035 (USD Billion)
        3. BY END USER, 2025-2035 (USD Billion)
      21. Indonesia MARKET SIZE ESTIMATES; FORECAST
        1. BY TYPE, 2025-2035 (USD Billion)
        2. BY DISTRIBUTION CHANNEL, 2025-2035 (USD Billion)
        3. BY END USER, 2025-2035 (USD Billion)
      22. Rest of APAC MARKET SIZE ESTIMATES; FORECAST
        1. BY TYPE, 2025-2035 (USD Billion)
        2. BY DISTRIBUTION CHANNEL, 2025-2035 (USD Billion)
        3. BY END USER, 2025-2035 (USD Billion)
      23. South America MARKET SIZE ESTIMATES; FORECAST
        1. BY TYPE, 2025-2035 (USD Billion)
        2. BY DISTRIBUTION CHANNEL, 2025-2035 (USD Billion)
        3. BY END USER, 2025-2035 (USD Billion)
      24. Brazil MARKET SIZE ESTIMATES; FORECAST
        1. BY TYPE, 2025-2035 (USD Billion)
        2. BY DISTRIBUTION CHANNEL, 2025-2035 (USD Billion)
        3. BY END USER, 2025-2035 (USD Billion)
      25. Mexico MARKET SIZE ESTIMATES; FORECAST
        1. BY TYPE, 2025-2035 (USD Billion)
        2. BY DISTRIBUTION CHANNEL, 2025-2035 (USD Billion)
        3. BY END USER, 2025-2035 (USD Billion)
      26. Argentina MARKET SIZE ESTIMATES; FORECAST
        1. BY TYPE, 2025-2035 (USD Billion)
        2. BY DISTRIBUTION CHANNEL, 2025-2035 (USD Billion)
        3. BY END USER, 2025-2035 (USD Billion)
      27. Rest of South America MARKET SIZE ESTIMATES; FORECAST
        1. BY TYPE, 2025-2035 (USD Billion)
        2. BY DISTRIBUTION CHANNEL, 2025-2035 (USD Billion)
        3. BY END USER, 2025-2035 (USD Billion)
      28. MEA MARKET SIZE ESTIMATES; FORECAST
        1. BY TYPE, 2025-2035 (USD Billion)
        2. BY DISTRIBUTION CHANNEL, 2025-2035 (USD Billion)
        3. BY END USER, 2025-2035 (USD Billion)
      29. GCC Countries MARKET SIZE ESTIMATES; FORECAST
        1. BY TYPE, 2025-2035 (USD Billion)
        2. BY DISTRIBUTION CHANNEL, 2025-2035 (USD Billion)
        3. BY END USER, 2025-2035 (USD Billion)
      30. South Africa MARKET SIZE ESTIMATES; FORECAST
        1. BY TYPE, 2025-2035 (USD Billion)
        2. BY DISTRIBUTION CHANNEL, 2025-2035 (USD Billion)
        3. BY END USER, 2025-2035 (USD Billion)
      31. Rest of MEA MARKET SIZE ESTIMATES; FORECAST
        1. BY TYPE, 2025-2035 (USD Billion)
        2. BY DISTRIBUTION CHANNEL, 2025-2035 (USD Billion)
        3. BY END USER, 2025-2035 (USD Billion)
      32. PRODUCT LAUNCH/PRODUCT DEVELOPMENT/APPROVAL
      33. 7.31.1
      34. ACQUISITION/PARTNERSHIP
      35. 7.32.1

    Hot Drinks & Soft Drinks Market Segmentation

    Hot Drinks & Soft Drinks Type Outlook (USD Billion, 2018-2032)

    • Coffee

    • Tea

    • Carbonated soft drinks

    • Non-carbonated soft drinks

    • Hot chocolate

    • Apple cider

    • Others

    Hot Drinks & Soft Drinks Distribution Channel Outlook (USD Billion, 2018-2032)

    • Hypermarkets and Supermarkets

    • Convenience Stores

    • Department Stores

    • Dollar Stores

    • Variety Store

    • Cash and Carries and Warehouse Clubs

    • Food and Drinks Specialists

    • Drug Stores and Pharmacies

    • Health and Beauty Stores

    Hot Drinks & Soft Drinks End User Outlook (USD Billion, 2018-2032)

    • Coffee Shops

    • Drink Stores

    • Food Services

    Hot Drinks & Soft Drinks Regional Outlook (USD Billion, 2018-2032)

    • North America Outlook (USD Billion, 2018-2032)

      • North America Hot Drinks & Soft Drinks by Type

        • Coffee

        • Tea

        • Carbonated soft drinks

        • Non-carbonated soft drinks

        • Hot chocolate

        • Apple cider

        • Others

      • North America Hot Drinks & Soft Drinks by Distribution Channel

        • Hypermarkets and Supermarkets

        • Convenience Stores

        • Department Stores

        • Dollar Stores

        • Variety Store

        • Cash and Carries and Warehouse Clubs

        • Food and Drinks Specialists

        • Drug Stores and Pharmacies

        • Health and Beauty Stores

      • North America Hot Drinks & Soft Drinks by End User

        • Coffee Shops

        • Drink Stores

        • Food Services

      • US Outlook (USD Billion, 2018-2032)

      • US Hot Drinks & Soft Drinks by Type

        • Coffee

        • Tea

        • Carbonated soft drinks

        • Non-carbonated soft drinks

        • Hot chocolate

        • Apple cider

        • Others

      • US Hot Drinks & Soft Drinks by Distribution Channel

        • Hypermarkets and Supermarkets

        • Convenience Stores

        • Department Stores

        • Dollar Stores

        • Variety Store

        • Cash and Carries and Warehouse Clubs

        • Food and Drinks Specialists

        • Drug Stores and Pharmacies

        • Health and Beauty Stores

      • US Hot Drinks & Soft Drinks by End User

        • Coffee Shops

        • Drink Stores

        • Food Services

      • Canada Outlook (USD Billion, 2018-2032)

      • Canada Hot Drinks & Soft Drinks by Type

        • Coffee

        • Tea

        • Carbonated soft drinks

        • Non-carbonated soft drinks

        • Hot chocolate

        • Apple cider

        • Others

      • Canada Hot Drinks & Soft Drinks by Distribution Channel

        • Hypermarkets and Supermarkets

        • Convenience Stores

        • Department Stores

        • Dollar Stores

        • Variety Store

        • Cash and Carries and Warehouse Clubs

        • Food and Drinks Specialists

        • Drug Stores and Pharmacies

        • Health and Beauty Stores

      • Canada Hot Drinks & Soft Drinks by End User

        • Coffee Shops

        • Drink Stores

        • Food Services

    • Europe Outlook (USD Billion, 2018-2032)

      • Europe Hot Drinks & Soft Drinks by Type

        • Coffee

        • Tea

        • Carbonated soft drinks

        • Non-carbonated soft drinks

        • Hot chocolate

        • Apple cider

        • Others

      • Europe Hot Drinks & Soft Drinks by Distribution Channel

        • Hypermarkets and Supermarkets

        • Convenience Stores

        • Department Stores

        • Dollar Stores

        • Variety Store

        • Cash and Carries and Warehouse Clubs

        • Food and Drinks Specialists

        • Drug Stores and Pharmacies

        • Health and Beauty Stores

      • Europe Hot Drinks & Soft Drinks by End User

        • Coffee Shops

        • Drink Stores

        • Food Services

      • Germany Outlook (USD Billion, 2018-2032)

      • Germany Hot Drinks & Soft Drinks by Type

        • Coffee

        • Tea

        • Carbonated soft drinks

        • Non-carbonated soft drinks

        • Hot chocolate

        • Apple cider

        • Others

      • Germany Hot Drinks & Soft Drinks by Distribution Channel

        • Hypermarkets and Supermarkets

        • Convenience Stores

        • Department Stores

        • Dollar Stores

        • Variety Store

        • Cash and Carries and Warehouse Clubs

        • Food and Drinks Specialists

        • Drug Stores and Pharmacies

        • Health and Beauty Stores

      • Germany Hot Drinks & Soft Drinks by End User

        • Coffee Shops

        • Drink Stores

        • Food Services

      • France Outlook (USD Billion, 2018-2032)

      • France Hot Drinks & Soft Drinks by Type

        • Coffee

        • Tea

        • Carbonated soft drinks

        • Non-carbonated soft drinks

        • Hot chocolate

        • Apple cider

        • Others

      • France Hot Drinks & Soft Drinks by Distribution Channel

        • Hypermarkets and Supermarkets

        • Convenience Stores

        • Department Stores

        • Dollar Stores

        • Variety Store

        • Cash and Carries and Warehouse Clubs

        • Food and Drinks Specialists

        • Drug Stores and Pharmacies

        • Health and Beauty Stores

      • France Hot Drinks & Soft Drinks by End User

        • Coffee Shops

        • Drink Stores

        • Food Services

      • UK Outlook (USD Billion, 2018-2032)

      • UK Hot Drinks & Soft Drinks by Type

        • Coffee

        • Tea

        • Carbonated soft drinks

        • Non-carbonated soft drinks

        • Hot chocolate

        • Apple cider

        • Others

      • UK Hot Drinks & Soft Drinks by Distribution Channel

        • Hypermarkets and Supermarkets

        • Convenience Stores

        • Department Stores

        • Dollar Stores

        • Variety Store

        • Cash and Carries and Warehouse Clubs

        • Food and Drinks Specialists

        • Drug Stores and Pharmacies

        • Health and Beauty Stores

      • UK Hot Drinks & Soft Drinks by End User

        • Coffee Shops

        • Drink Stores

        • Food Services

      • Italy Outlook (USD Billion, 2018-2032)

      • Italy Hot Drinks & Soft Drinks by Type

        • Coffee

        • Tea

        • Carbonated soft drinks

        • Non-carbonated soft drinks

        • Hot chocolate

        • Apple cider

        • Others

      • Italy Hot Drinks & Soft Drinks by Distribution Channel

        • Hypermarkets and Supermarkets

        • Convenience Stores

        • Department Stores

        • Dollar Stores

        • Variety Store

        • Cash and Carries and Warehouse Clubs

        • Food and Drinks Specialists

        • Drug Stores and Pharmacies

        • Health and Beauty Stores

      • Italy Hot Drinks & Soft Drinks by End User

        • Coffee Shops

        • Drink Stores

        • Food Services

      • Spain Outlook (USD Billion, 2018-2032)

      • Spain Hot Drinks & Soft Drinks by Type

        • Coffee

        • Tea

        • Carbonated soft drinks

        • Non-carbonated soft drinks

        • Hot chocolate

        • Apple cider

        • Others

      • Spain Hot Drinks & Soft Drinks by Distribution Channel

        • Hypermarkets and Supermarkets

        • Convenience Stores

        • Department Stores

        • Dollar Stores

        • Variety Store

        • Cash and Carries and Warehouse Clubs

        • Food and Drinks Specialists

        • Drug Stores and Pharmacies

        • Health and Beauty Stores

      • Spain Hot Drinks & Soft Drinks by End User

        • Coffee Shops

        • Drink Stores

        • Food Services

      • Rest Of Europe Outlook (USD Billion, 2018-2032)

      • Rest Of Europe Hot Drinks & Soft Drinks by Type

        • Coffee

        • Tea

        • Carbonated soft drinks

        • Non-carbonated soft drinks

        • Hot chocolate

        • Apple cider

        • Others

      • Rest Of Europe Hot Drinks & Soft Drinks by Distribution Channel

        • Hypermarkets and Supermarkets

        • Convenience Stores

        • Department Stores

        • Dollar Stores

        • Variety Store

        • Cash and Carries and Warehouse Clubs

        • Food and Drinks Specialists

        • Drug Stores and Pharmacies

        • Health and Beauty Stores

      • Rest Of Europe Hot Drinks & Soft Drinks by End User

        • Coffee Shops

        • Drink Stores

        • Food Services

    • Asia-Pacific Outlook (USD Billion, 2018-2032)

      • Asia-Pacific Hot Drinks & Soft Drinks by Type

        • Coffee

        • Tea

        • Carbonated soft drinks

        • Non-carbonated soft drinks

        • Hot chocolate

        • Apple cider

        • Others

      • Asia-Pacific Hot Drinks & Soft Drinks by Distribution Channel

        • Hypermarkets and Supermarkets

        • Convenience Stores

        • Department Stores

        • Dollar Stores

        • Variety Store

        • Cash and Carries and Warehouse Clubs

        • Food and Drinks Specialists

        • Drug Stores and Pharmacies

        • Health and Beauty Stores

      • Asia-Pacific Hot Drinks & Soft Drinks by End User

        • Coffee Shops

        • Drink Stores

        • Food Services

      • China Outlook (USD Billion, 2018-2032)

      • China Hot Drinks & Soft Drinks by Type

        • Coffee

        • Tea

        • Carbonated soft drinks

        • Non-carbonated soft drinks

        • Hot chocolate

        • Apple cider

        • Others

      • China Hot Drinks & Soft Drinks by Distribution Channel

        • Hypermarkets and Supermarkets

        • Convenience Stores

        • Department Stores

        • Dollar Stores

        • Variety Store

        • Cash and Carries and Warehouse Clubs

        • Food and Drinks Specialists

        • Drug Stores and Pharmacies

        • Health and Beauty Stores

      • China Hot Drinks & Soft Drinks by End User

        • Coffee Shops

        • Drink Stores

        • Food Services

      • Japan Outlook (USD Billion, 2018-2032)

      • Japan Hot Drinks & Soft Drinks by Type

        • Coffee

        • Tea

        • Carbonated soft drinks

        • Non-carbonated soft drinks

        • Hot chocolate

        • Apple cider

        • Others

      • Japan Hot Drinks & Soft Drinks by Distribution Channel

        • Hypermarkets and Supermarkets

        • Convenience Stores

        • Department Stores

        • Dollar Stores

        • Variety Store

        • Cash and Carries and Warehouse Clubs

        • Food and Drinks Specialists

        • Drug Stores and Pharmacies

        • Health and Beauty Stores

      • Japan Hot Drinks & Soft Drinks by End User

        • Coffee Shops

        • Drink Stores

        • Food Services

      • India Outlook (USD Billion, 2018-2032)

      • India Hot Drinks & Soft Drinks by Type

        • Coffee

        • Tea

        • Carbonated soft drinks

        • Non-carbonated soft drinks

        • Hot chocolate

        • Apple cider

        • Others

      • India Hot Drinks & Soft Drinks by Distribution Channel

        • Hypermarkets and Supermarkets

        • Convenience Stores

        • Department Stores

        • Dollar Stores

        • Variety Store

        • Cash and Carries and Warehouse Clubs

        • Food and Drinks Specialists

        • Drug Stores and Pharmacies

        • Health and Beauty Stores

      • India Hot Drinks & Soft Drinks by End User

        • Coffee Shops

        • Drink Stores

        • Food Services

      • Australia Outlook (USD Billion, 2018-2032)

      • Australia Hot Drinks & Soft Drinks by Type

        • Coffee

        • Tea

        • Carbonated soft drinks

        • Non-carbonated soft drinks

        • Hot chocolate

        • Apple cider

        • Others

      • Australia Hot Drinks & Soft Drinks by Distribution Channel

        • Hypermarkets and Supermarkets

        • Convenience Stores

        • Department Stores

        • Dollar Stores

        • Variety Store

        • Cash and Carries and Warehouse Clubs

        • Food and Drinks Specialists

        • Drug Stores and Pharmacies

        • Health and Beauty Stores

      • Australia Hot Drinks & Soft Drinks by End User

        • Coffee Shops

        • Drink Stores

        • Food Services

      • Rest of Asia-Pacific Outlook (USD Billion, 2018-2032)

      • Rest of Asia-Pacific Hot Drinks & Soft Drinks by Type

        • Coffee

        • Tea

        • Carbonated soft drinks

        • Non-carbonated soft drinks

        • Hot chocolate

        • Apple cider

        • Others

      • Rest of Asia-Pacific Hot Drinks & Soft Drinks by Distribution Channel

        • Hypermarkets and Supermarkets

        • Convenience Stores

        • Department Stores

        • Dollar Stores

        • Variety Store

        • Cash and Carries and Warehouse Clubs

        • Food and Drinks Specialists

        • Drug Stores and Pharmacies

        • Health and Beauty Stores

      • Rest of Asia-Pacific Hot Drinks & Soft Drinks by End User

        • Coffee Shops

        • Drink Stores

        • Food Services

    • Rest of the World Outlook (USD Billion, 2018-2032)

      • Rest of the World Hot Drinks & Soft Drinks by Type

        • Coffee

        • Tea

        • Carbonated soft drinks

        • Non-carbonated soft drinks

        • Hot chocolate

        • Apple cider

        • Others

      • Rest of the World Hot Drinks & Soft Drinks by Distribution Channel

        • Hypermarkets and Supermarkets

        • Convenience Stores

        • Department Stores

        • Dollar Stores

        • Variety Store

        • Cash and Carries and Warehouse Clubs

        • Food and Drinks Specialists

        • Drug Stores and Pharmacies

        • Health and Beauty Stores

      • Rest of the World Hot Drinks & Soft Drinks by End User

        • Coffee Shops

        • Drink Stores

        • Food Services

      • Middle East Outlook (USD Billion, 2018-2032)

      • Middle East Hot Drinks & Soft Drinks by Type

        • Coffee

        • Tea

        • Carbonated soft drinks

        • Non-carbonated soft drinks

        • Hot chocolate

        • Apple cider

        • Others

      • Middle East Hot Drinks & Soft Drinks by Distribution Channel

        • Hypermarkets and Supermarkets

        • Convenience Stores

        • Department Stores

        • Dollar Stores

        • Variety Store

        • Cash and Carries and Warehouse Clubs

        • Food and Drinks Specialists

        • Drug Stores and Pharmacies

        • Health and Beauty Stores

      • Middle East Hot Drinks & Soft Drinks by End User

        • Coffee Shops

        • Drink Stores

        • Food Services

      • Africa Outlook (USD Billion, 2018-2032)

      • Africa Hot Drinks & Soft Drinks by Type

        • Coffee

        • Tea

        • Carbonated soft drinks

        • Non-carbonated soft drinks

        • Hot chocolate

        • Apple cider

        • Others

      • Africa Hot Drinks & Soft Drinks by Distribution Channel

        • Hypermarkets and Supermarkets

        • Convenience Stores

        • Department Stores

        • Dollar Stores

        • Variety Store

        • Cash and Carries and Warehouse Clubs

        • Food and Drinks Specialists

        • Drug Stores and Pharmacies

        • Health and Beauty Stores

      • Africa Hot Drinks & Soft Drinks by End User

        • Coffee Shops

        • Drink Stores

        • Food Services

      • Latin America Outlook (USD Billion, 2018-2032)

      • Latin America Hot Drinks & Soft Drinks by Type

        • Coffee

        • Tea

        • Carbonated soft drinks

        • Non-carbonated soft drinks

        • Hot chocolate

        • Apple cider

        • Others

      • Latin America Hot Drinks & Soft Drinks by Distribution Channel

        • Hypermarkets and Supermarkets

        • Convenience Stores

        • Department Stores

        • Dollar Stores

        • Variety Store

        • Cash and Carries and Warehouse Clubs

        • Food and Drinks Specialists

        • Drug Stores and Pharmacies

        • Health and Beauty Stores

      • Latin America Hot Drinks & Soft Drinks by End User

        • Coffee Shops

        • Drink Stores

        • Food Services


    Infographic

    Free Sample Request

    Kindly complete the form below to receive a free sample of this Report

    Get Free Sample

    Customer Strories

    “I am very pleased with how market segments have been defined in a relevant way for my purposes (such as "Portable Freezers & refrigerators" and "last-mile"). In general the report is well structured. Thanks very much for your efforts.”

    Victoria Milne

    Founder

    Compare Licence

    ×
    Features License Type
    Single User Multiuser License Enterprise User
    Price $4,950 $5,950 $7,250
    Maximum User Access Limit 1 User Upto 10 Users Unrestricted Access Throughout the Organization
    Free Customization
    Direct Access to Analyst
    Deliverable Format
    Platform Access
    Discount on Next Purchase 10% 15% 15%
    Printable Versions