Hydrochloric Acid Market (2026 - 2035)

Hydrochloric Acid Market Research Report Information By Grade (Industrial, Concentrated, and Ultra-High Purity), By End-User Industry (Chemical, Oil and Gas, Steel and Metallurgy, Food and Beverage, Textiles and Leather, and Other End-User Industries), and By Region (North America, Europe, Asia-Pacific, and Rest Of The World) - Forecast Till 2035
ID: MRFR/CnM/2096-HCR
111 Pages
Chitranshi Jaiswal
Last Updated: July 10, 2026
Hydrochloric Acid Market
Market Size
Forecast Period2026-2035
CAGR (2026-2035)5.92%
2025 Market Size8.15 Million Tons
2035 Market Size14.02 Million Tons
Key Players
Olin Corporation
Westlake Corporation
BASF SE
Covestro AG
Shin-Etsu Chemical
Formosa Plastics
Opportunities
  • Battery-Recycling Hydrometallurgy
  • Ultra-High-Purity Grades for Advanced Packaging
  • Emerging-Market Water Infrastructure
 

Hydrochloric Acid Market Summary

The Hydrochloric Acid Market reached an estimated 8.15 million tons in 2025, with the forecast period beginning at 8.59 million tons in 2026 and climbing to 14.02 million tons by 2035 at a CAGR of 5.92%. This expansion is rooted in a convergence of semiconductor fabrication build-outs, accelerated oil well acidizing activity tied to unconventional gas plays, and tightening water treatment standards that require reliable pH control chemicals across municipal and industrial facilities [1]. Governments in the United States, China, and India have committed over USD 180 billion collectively to semiconductor self-sufficiency programs through 2030, each of which drives demand for ultra-high-purity inorganic acid compounds used in wafer cleaning and etching steps [2].

A structural shift is underway in how chemical processing acids are produced and consumed. Legacy mercury-cell chlor-alkali plants — once responsible for roughly 15% of European muriatic acid output — are being decommissioned under the EU Mercury Regulation, replaced by membrane-cell technology that produces higher-purity hydrochloric acid at lower energy intensity [3]. This transition has spurred over EUR 4.2 billion in membrane retrofits since 2021, simultaneously improving product quality for steel pickling chemicals and electronic-grade applications while raising the capital bar for smaller merchant producers [4].

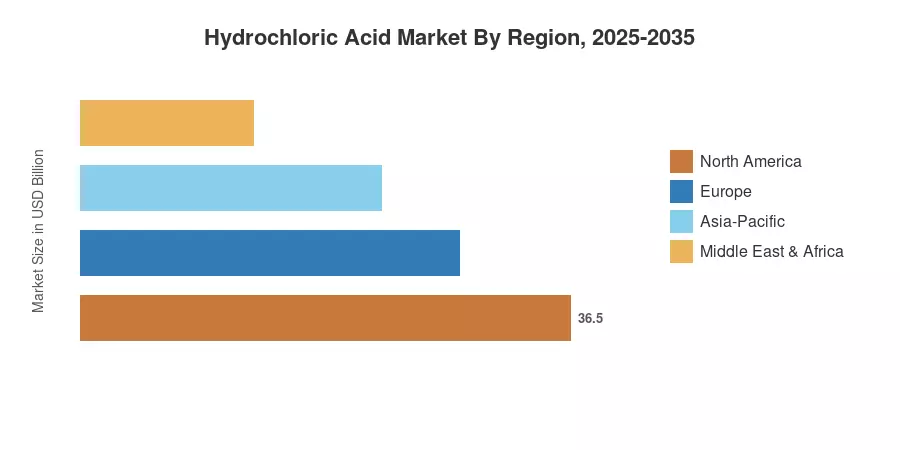
Asia-Pacific commands roughly 56% of global volume, driven by China's chlor-alkali overcapacity and India's expanding pharmaceutical intermediate sector. The region also posts the fastest CAGR at 6.28% through 2035. North America holds the second-largest share at approximately 21%, anchored by Gulf Coast petrochemical clusters and shale-gas stimulation demand. Europe contributes around 16% of volume, with growth tied to industrial cleaning chemicals for automotive steel processing. As battery-recycling hydrometallurgy scales globally, the Hydrochloric Acid Market is poised for sustained demand diversification well into the next decade

Key Report Takeaways

• By Grade

  • Industrial-grade hydrochloric acid held 57% revenue share in 2025, underpinned by steel pickling chemicals and water treatment acids demand across heavy industries
  • Ultra-high-purity grades are projected to grow at a 6.35% CAGR through 2035, driven by sub-5 nm semiconductor fabs requiring parts-per-trillion metal specifications

• By End-User Industry

  • The chemicals segment captured 34.5% of the Hydrochloric Acid Market share in 2025, reflecting its role in organic and inorganic acid compounds synthesis
  • Oil and gas end users are expanding at a 6.58% CAGR as oil well acidizing operations intensify in North American shale basins

• By Region

  • Asia-Pacific accounted for 56% of volume in 2025, led by Chinese chlor-alkali co-production and Indian pharmaceutical manufacturing
  • North America's Hydrochloric Acid Market is valued at approximately 1.71 million tons in 2025, supported by chemical processing acids demand along the Texas–Louisiana corridor

Market Size and Forecast (2021–2035)

MRFR's market sizing integrates bottom-up production data from chlor-alkali plant databases, trade-flow analysis from UN Comtrade, and top-down validation against published industry association statistics. Historical figures (2021–2024) reflect actual shipment records, while the 2025 base year blends preliminary production reports with demand-side consumption audits. Forecast values (2026–2035) apply the calibrated CAGR with adjustments for announced capacity additions and regulatory phase-outs.
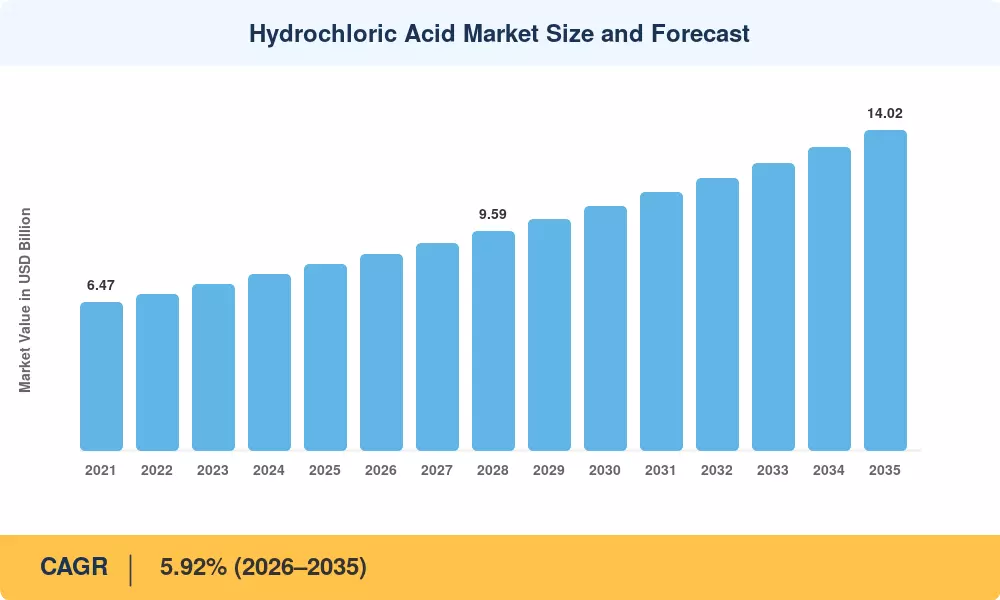
Hydrochloric Acid Market Size and Forecast
Our Impact
Enabled $4.3B Revenue Impact for Fortune 500 and Leading Multinationals
Partnering with 2000+ Global Organizations Each Year
30K+ Citations by Top-Tier Firms in the Industry
 

Driver Impact Analysis

Driver ~% Impact on CAGR Geographic Relevance Impact Timeline
Semiconductor fab expansion and UHP acid demand ~18% Asia-Pacific, North America Medium-term (2–4 yr)
Shale-gas and unconventional oil well acidizing ~16% North America, Middle East Short-term (≤2 yr)
Steel pickling volume growth from auto lightweighting ~14% Europe, Asia-Pacific Medium-term (2–4 yr)
Municipal water treatment regulatory tightening ~12% Global Long-term (≥4 yr)
Battery-recycling hydrometallurgy scale-up ~11% Europe, Asia-Pacific Medium-term (2–4 yr)
Food-grade HCl for gelatin and fructose processing ~8% North America, Europe Long-term (≥4 yr)
PVC and chlorinated chemical products demand recovery ~7% Asia-Pacific, South America Short-term (≤2 yr)


Semiconductor Fabrication and Ultra-High-Purity Demand

The global semiconductor industry is investing over USD 500 billion in new fab construction between 2024 and 2030, according to SEMI [2]. Each advanced logic fab operating at sub-5 nm nodes consumes approximately 2,000–3,000 tons of ultra-high-purity muriatic acid annually for wafer cleaning, etching, and post-CMP rinse steps. The U.S. CHIPS and Science Act alone has allocated USD 52.7 billion in subsidies, with TSMC, Samsung, and Intel commissioning facilities in Arizona, Texas, and Ohio that will collectively require over 15,000 tons of electronic-grade chemical processing acids per year by 2028 [2].

Oil Well Acidizing in Unconventional Plays

Horizontal drilling and hydraulic fracturing in the Permian Basin, Eagle Ford, and Haynesville shale formations consume between 50,000 and 150,000 gallons of 15% HCl per well completion for carbonate dissolution and near-wellbore permeability enhancement [5]. The U.S. Energy Information Administration projects domestic natural gas production will reach 42.5 Tcf by 2030, sustaining acid stimulation demand at roughly 1.2 million tons per year in North America alone. Oil well acidizing operations in Saudi Arabia's Ghawar field and Abu Dhabi's offshore concessions add another 400,000 tons of annual consumption [5].

Steel Pickling and Automotive Lightweighting

Global crude steel output exceeded 1.9 billion tonnes in 2024, with approximately 35% of flat-rolled product requiring acid pickling before galvanizing or coating [7]. The automotive industry's shift toward advanced high-strength steels (AHSS) for vehicle lightweighting demands more aggressive pickling cycles, increasing steel pickling chemicals consumption per ton of finished product by 12–18% compared with conventional carbon steel grades. The European Automobile Manufacturers' Association estimates AHSS adoption will reach 45% of body-in-white weight by 2030, directly expanding muriatic acid throughput at integrated mills [7].

Water Treatment Regulatory Expansion

The U.S. EPA's revised Lead and Copper Rule, effective October 2024, mandates corrosion-control treatment in over 73,000 community water systems, many of which rely on pH control chemicals, including hydrochloric acid for alkalinity adjustment [8]. Similar standards are emerging in India's Jal Jeevan Mission, which targets functional household tap connections for 145 million rural households by 2026, creating greenfield demand for water treatment acids in coagulation and disinfection stages [8].


Restraints Impact Analysis

The restraint weightings below follow the same directional methodology described in Section 4. They represent headwinds that moderate — but do not reverse — the overall growth trajectory of the Hydrochloric Acid Market.

Restraint ~% Negative Impact on CAGR Geographic Relevance Impact Timeline
Caustic-soda demand cyclicality and co-production imbalance ~–22% Global Short-term (≤2 yr)
Environmental and transport regulation tightening ~–18% Europe, North America Medium-term (2–4 yr)
Energy cost volatility for chlor-alkali electrolysis ~–15% Europe Short-term (≤2 yr)
Substitution by organic acids in niche cleaning applications ~–10% North America, Europe Long-term (≥4 yr)
Overcapacity in Chinese chlor-alkali sector depressing export pricing ~–8% Asia-Pacific Medium-term (2–4 yr)


Co-Production Imbalance with Caustic Soda

Hydrochloric acid remains predominantly a co-product of the chlor-alkali process, meaning supply volumes are governed by caustic soda demand rather than HCl demand itself. When alumina refining or pulp-and-paper sectors — the largest caustic consumers — experience downturns, chlorine and HCl production falls accordingly, creating spot shortages and price volatility. The World Chlorine Council reported that the global chlor-alkali operating rate fell to 78% in Q3 2024, tightening inorganic acid compounds availability in Southeast Asian merchant markets [11].

Environmental and Transport Compliance Costs

Transporting concentrated muriatic acid triggers ADR/DOT Class 8 corrosive hazmat requirements, adding USD 15–25 per ton in compliance costs for specialized tanker liners, emergency response planning, and route-specific permits [12]. The EU's revised Classification, Labelling, and Packaging (CLP) Regulation, effective 2026, introduces additional reporting obligations for industrial cleaning chemicals containing HCl above 0.1% concentration, raising administrative costs for distributors serving fragmented end-user bases [12].

Energy Cost Exposure in European Production

European chlor-alkali plants consumed approximately 2,500 kWh per ton of chlorine equivalent in 2024, making electricity the single largest operating cost. With TTF natural gas prices averaging EUR 35/MWh through 2024 — still 2.5× pre-2021 levels — several mid-scale producers in Germany and Belgium curtailed output, redirecting merchant HCl buyers toward imports from the Middle East and Asia-Pacific [3].


Hydrochloric Acid Market Opportunities

Battery-Recycling Hydrometallurgy

Lithium-ion battery recycling is expected to recycle about 1.5 million tons per year of end-of-life cells by 2030. Hydrometallurgical techniques require 0.8–1.2 tons of HCl per ton of black matter leached . This developing application might provide 1.2–1.8 million tons of incremental demand by 2032, providing manufacturers with a counter-cyclical revenue stream independent of caustic-soda consumption


Ultra-High-Purity Grades for Advanced Packaging

Beyond front-end wafer processing, modern semiconductor packaging technologies such as chiplet designs and hybrid bonding also require multi-step cleaning using electronic-grade chemical processing acids. SEMI predicts the advanced packaging industry would reach USD 65+ billion by 2030, providing a premium-price niche for distilled inorganic acid compounds with < sub-ppt metallic contamination [2]


Emerging-Market Water Infrastructure

India, Indonesia and Nigeria together intend to invest more than USD 120 billion in water and sanitation infrastructure through 2030 under national development goals [8]. Water treatment acids are required by these greenfield plants for pH correction, coagulant activation and resin regeneration in ion-exchange systems, creating distribution opportunities in areas traditionally supplied with imported pH control chemicals


Circular-Economy Acid Recovery and Regeneration

Spent-acid regeneration (SAR) technology, which spray-roasts to recover HCl from steel pickling liquid, is gaining ground as firms strive to cut virgin usage and waste-disposal costs. Tenova and Andritz have operated SAR plants that recover 98+% of the free acid, transforming a waste stream into a competitive feedstock source [14]. This circular model is consistent with ESG reporting requirements and provides end users of industrial cleaning chemicals with a lower total cost of ownership


Geothermal Energy Acid Stimulation

Geothermal well stimulation uses HCl injection to dissolve carbonate scaling and enhance reservoir permeability, mirroring oil well acidizing techniques. The IEA projects geothermal power capacity will double to 30 GW by 2030, with enhanced geothermal systems (EGS) in the western United States and East Africa requiring 10,000–50,000 gallons of muriatic acid per well cycle [15]


Hydrochloric Acid Market Future Outlook

Digital Process Optimization and AI-Driven Quality Control

Chlor-alkali producers are deploying advanced process-control systems that use machine-learning algorithms to optimize membrane-cell current density, brine purity, and product-grade distribution in real time. Olin and Covestro have piloted digital-twin platforms that reduced off-spec HCl production by 15–20%, improving ultra-high-purity yield rates and lowering the unit cost of electronic-grade chemical processing acids [18]. These digital investments will reshape competitive positioning in the Hydrochloric Acid Market by rewarding producers who can guarantee consistent sub-ppt contamination levels.

Electrification and Green Hydrogen Synergies

The scale-up of proton-exchange-membrane (PEM) electrolysis for green hydrogen co-produces high-purity oxygen but also creates opportunities for integrated chlor-alkali-hydrogen hubs where renewable electricity powers membrane cells. The European Clean Hydrogen Alliance's target of 10 million tons of domestic green hydrogen by 2030 could indirectly expand chlorine — and by extension muriatic acid — output if co-located with chlor-alkali infrastructure, potentially adding 500,000 tons of HCl supply in Northwestern Europe [19].

ESG Reporting and Circular-Economy Mandates

The EU's Corporate Sustainability Reporting Directive (CSRD), effective 2024, requires Scope 3 emissions disclosure from chemical producers with over 500 employees. For steel pickling chemicals suppliers, this mandate incentivizes closed-loop acid-recovery systems and shifts procurement toward vendors with verified environmental product declarations (EPDs). The Hydrochloric Acid Market is likely to stratify into "green-certified" and commodity tiers by 2030, with price premiums of 8–12% for regenerated-acid products [14].

Supply-Chain Regionalization and Nearshoring

Geopolitical tensions and pandemic-era supply disruptions have pushed large chemical consumers to regionalize sourcing. The U.S. Department of Commerce's critical-materials review includes electronic-grade HCl among inputs subject to supply-chain risk assessment under Executive Order 14017 [20]. This trend benefits Gulf Coast and European producers positioned to serve domestic semiconductor and pharmaceutical customers with shorter, more resilient industrial cleaning chemicals supply chains.


Hydrochloric Acid Market Segmentation

By Grade

Segment Key Metric Primary Demand Driver
Industrial 57% revenue share (2025) Steel pickling chemicals and water treatment acids
Concentrated 5.70% CAGR (2026–2035) Oil well acidizing and chemical processing acids synthesis
Ultra-High Purity 6.35% CAGR (2026–2035) Semiconductor wafer cleaning and battery-recycling hydrometallurgy


The Hydrochloric Acid Market is anchored by industrial-grade product, which serves the broadest range of end users from steel mills running continuous pickling lines to municipal water systems adjusting alkalinity with pH control chemicals. This grade's volume dominance reflects its role as the default commodity output of chlor-alkali plants, where production economics favor high-throughput runs over precision distillation. Concentrated grades — typically 30–37% w/w solutions — occupy a middle tier used in oil well acidizing, ore leaching, and large-scale chemical processing acids applications where higher active-acid content reduces logistics costs per unit of reactive HCl.

Ultra-high-purity grades represent the fastest-growing and highest-margin segment, priced at 3–5× industrial equivalents due to multi-step distillation, sub-boiling purification, and ion-exchange polishing that achieve parts-per-trillion metallic contamination levels. Demand is tightly correlated with advanced semiconductor node migration: TSMC, Samsung, and Intel fabs operating at 3 nm and below specify electronic-grade muriatic acid meeting SEMI C27 standards, creating a premium niche where quality certification acts as a significant barrier to entry [2].

By End-User Industry

Segment Key Metric Primary Demand Driver
Chemical 34.5% share (2025) Organic/inorganic acid compounds synthesis and PVC production
Oil and Gas 6.58% CAGR (2026–2035) Shale-gas oil well acidizing and carbonate matrix stimulation
Steel and Metallurgy USD 2.35 million tons (2025) Hot-rolled coil pickling and galvanizing pre-treatment
Food and Beverage 5.15% CAGR (2026–2035) Gelatin processing and high-fructose corn syrup production
Textiles and Leather 8% share (2025) Fiber carbonizing and chrome-tanning pH adjustment
Other End-User Industries 5.40% CAGR (2026–2035) Water treatment acids, resin regeneration, laboratory reagents


The chemicals segment leads the Hydrochloric Acid Market because HCl serves as both a reactant and a catalyst in the production of vinyl chloride monomer (VCM), methylene diphenyl diisocyanate (MDI), and a wide array of chlorinated chemical products. Chinese VCM producers using the calcium-carbide acetylene route consume over 3 million tons of HCl annually, making PVC manufacturing the single largest chemical end use globally [10]. Oil and gas stands as the fastest-expanding end-user industry, propelled by unconventional drilling programs in North America and the Middle East that rely on muriatic acid for carbonate-formation stimulation. Each horizontal shale well can consume 50,000–150,000 gallons of 15% HCl during completion, and the EIA forecasts U.S. well completions will remain above 12,000 per year through 2030 [5].


Regional Market Share Analysis

Region Key Metric Primary Investment Themes
Asia-Pacific 56% volume share (2025) Semiconductor fabs, chlor-alkali expansion, pharmaceutical intermediates
North America 6.15% CAGR (2026–2035) Oil well acidizing, CHIPS Act fab builds, water treatment mandates
Europe 2.85 million tons by 2035 Automotive steel pickling chemicals, membrane-cell retrofits, SAR adoption
South America 5.48% CAGR (2026–2035) Mining hydrometallurgy, water infrastructure, chlorinated chemical products
Middle East & Africa 4.8% volume share (2025) Petrochemical diversification, oil well acidizing, desalination pre-treatment
Total 14.02 million tons (2035)

The Hydrochloric Acid Market exhibits a distinct geographic concentration, with Asia-Pacific's chlor-alkali co-production volumes anchoring more than half of global output. North America's shale-gas stimulation sector and Europe's automotive steel processing chain sustain the next two tiers, while South America and the Middle East & Africa regions — though smaller in absolute terms — post above-average growth driven by infrastructure investment and petrochemical diversification.


North America

Country Key Metric Key Driver
United States 78% of regional volume Permian Basin acidizing; Gulf Coast chlor-alkali hubs
Canada 5.85% CAGR Oil sands upgrader pickling; potash processing
Mexico USD 0.18 million tons (2025) Automotive steel expansion; Monterrey industrial corridor


The United States dominates North American HCl consumption through integrated chlor-alkali operations concentrated along the Texas–Louisiana Gulf Coast, where proximity to ethylene crackers ensures captive chlorine off-take. Dow, Olin, and Westlake operate the region's largest merchant supply networks, distributing muriatic acid via barge and rail to steel pickling chemicals end users in the Great Lakes manufacturing belt and to chemical processing acids consumers in the Midwest agrochemical sector [1].

Europe

Country Key Metric Key Driver
Germany 28% of regional volume Automotive AHSS pickling; BASF/Covestro chlor-alkali
United Kingdom 5.10% CAGR Water treatment acids for Thames Tideway infrastructure
France 12% of regional volume Nuclear fuel processing; food-grade gelatin production
Italy 4.95% CAGR Textile and leather tanning; Adriatic chlor-alkali plants
Spain 9% of regional volume PVC production; Mediterranean petrochemical corridor
Nordic Countries 5.25% CAGR Pulp-mill bleaching; battery-recycling start-ups
Russia 11% of regional volume Metallurgical-grade demand; domestic chlor-alkali self-sufficiency
Rest of Europe 4.80% CAGR Eastern European automotive supply chain growth


Germany's automotive steel complex consumes over 600,000 tons of HCl annually for hot-rolled coil pickling at ThyssenKrupp, Salzgitter, and ArcelorMittal facilities. The EU's Carbon Border Adjustment Mechanism (CBAM) is accelerating investment in spent-acid regeneration to reduce Scope 3 emissions across the steel pickling chemicals value chain, while Scandinavian battery-recycling ventures by Northvolt and Hydrovolt are opening new demand channels for concentrated-grade inorganic acid compounds [7].

Asia-Pacific

Country Key Metric Key Driver
China 48% of regional volume Chlor-alkali overcapacity; PVC and chlorinated chemical products
India 6.45% CAGR Pharma intermediates; Jal Jeevan Mission water treatment
Japan 14% of regional volume Semiconductor UHP demand; electronic-grade muriatic acid
South Korea 6.10% CAGR Memory fab expansions by Samsung and SK Hynix
ASEAN 5.90% CAGR Palm-oil processing; textile and leather industries
Rest of Asia-Pacific 4% of regional volume Mining and mineral-processing applications


China's chlor-alkali sector operates over 42 million tons per year of caustic-soda capacity, generating massive co-product HCl volumes that depress domestic pricing and fuel exports across Southeast Asia. India's Hydrochloric Acid Market is expanding rapidly as pharmaceutical API manufacturers in Hyderabad and Ahmedabad clusters scale up, while Japan's ultra-high-purity segment — serving TSMC's Kumamoto fab and Rapidus's Hokkaido facility — commands premium pricing at 3–5× industrial-grade levels [2].

South America

Country Key Metric Key Driver
Brazil 62% of regional volume Mining hydrometallurgy; São Paulo chemical processing acids hub
Argentina 5.55% CAGR Lithium-brine processing; Vaca Muerta shale acidizing
Rest of South America 18% of regional volume Copper-ore leaching; municipal water treatment acids


Brazil's Hydrochloric Acid Market benefits from Braskem's integrated chlor-alkali operations in Alagoas and São Paulo, which supply muriatic acid to the country's steel, mining, and food-processing sectors. Argentina's lithium-triangle operations in Salta and Jujuy provinces are creating new demand for pH control chemicals in brine-concentration and lithium-carbonate purification circuits [16].

Middle East & Africa

Country Key Metric Key Driver
Saudi Arabia 35% of regional volume SABIC/Sadara petrochemical complex; oil well acidizing
UAE 5.30% CAGR Desalination pre-treatment; industrial cleaning chemicals
South Africa 22% of regional volume Mining acid leaching; Sasol chlor-alkali operations
Egypt 4.85% CAGR Suez Canal zone industrial expansion; food processing
Rest of MEA 18% of regional volume Nascent water infrastructure; import-dependent distribution


Saudi Arabia's downstream petrochemical expansion under Vision 2030 — including the USD 20 billion Amiral complex at Jubail — integrates chlor-alkali production with ethylene derivatives, generating captive HCl for oil well acidizing in the Kingdom's mature and enhanced-recovery fields. South Africa's mining sector consumes industrial-grade inorganic acid compounds for gold-ore processing and platinum-group-metal refining at operations concentrated in the Bushveld Complex [17].

Hydrochloric Acid Market By Region, 2025-2035
 

Competitive Benchmarking

The Hydrochloric Acid Market exhibits medium concentration, with the top five producers accounting for an estimated 35–42% of global merchant supply. The Herfindahl-Hirschman Index (HHI) for the merchant segment is estimated at 850–1,100, reflecting a moderately fragmented structure where vertically integrated chlor-alkali majors compete alongside regional distributors and specialty-grade refiners. Barriers to entry vary sharply by grade: industrial-quality HCl can be sourced from any chlor-alkali co-production facility, while ultra-high-purity grades require capital-intensive purification infrastructure and SEMI-certified clean-room logistics.

Company Est. Revenue Share Range Key Offerings for Hydrochloric Acid Market Strategic Positioning
Olin Corporation ~7–10% Industrial and reagent-grade HCl; chlor-alkali integrated Largest U.S. merchant supplier; Gulf Coast logistics network
Westlake Corporation ~5–8% Vinyls-integrated HCl; caustic-soda co-production Vertically integrated PVC/VCl chain; cost leadership
BASF SE ~4–7% Industrial and electronic-grade muriatic acid European chlor-alkali hub; R&D in UHP purification
Covestro AG ~4–6% MDI-grade HCl; membrane-cell technology Specialty isocyanate integration; sustainability focus
Shin-Etsu Chemical ~3–6% Ultra-high-purity electronic-grade HCl Leading semiconductor-grade supplier in Asia-Pacific
Formosa Plastics ~3–5% Vinyls-integrated HCl; concentrated grades Integrated PVC production in Taiwan and Texas
Solvay SA ~3–5% Specialty and pharmaceutical-grade HCl European distribution; pharma-cGMP certification
Inovyn (INEOS) ~3–5% Chlor-alkali co-product HCl; industrial cleaning chemicals Pan-European chlor-alkali; Runcorn and Tavaux sites
Tata Chemicals ~2–4% Industrial-grade HCl; soda-ash co-production Indian subcontinent distribution; water treatment acids
SABIC ~2–4% Petrochemical-integrated HCl; oil well acidizing grades Middle East feedstock advantage; Jubail complex


Recent News & Developments


  • U.S. EPA (October 2024): Published the revised Lead and Copper Rule Improvements (LCRI), mandating corrosion-control optimization using pH control chemicals at over 73,000 public water systems nationwide [8].
  • Tenova S.p.A. (June 2024): Delivered a 120,000-ton/year spent-acid regeneration plant to ArcelorMittal's Ghent facility, recovering over 98% of free HCl from steel pickling chemicals liquor [14].


Hydrochloric Acid Market Report Scope

Parameter Detail
Market Scope Global Hydrochloric Acid Market by Grade, End-User Industry, and Geography
Study Period 2021–2035
CAGR 5.92% (2026–2035)
Market Size (2025) 8.15 Million Tons
Market Size (2035) 14.02 Million Tons
Fastest Growing Segment Ultra-High Purity (by Grade); Oil and Gas (by End-User Industry)
Companies Profiled 10 (Olin, Westlake, BASF, Covestro, Shin-Etsu, Formosa Plastics, Solvay, Inovyn, Tata Chemicals, SABIC)
Valuation Unit Volume (Million Tons)


FAQs

How does the chlor-alkali co-production model affect HCl procurement stability?
HCl supply is structurally tied to caustic-soda demand, so buyers face availability swings when downstream caustic markets soften. Securing multi-year offtake contracts with integrated producers mitigates exposure to spot-market volatility [11].
What purity certifications should semiconductor fabs require from HCl suppliers?
Fabs at 5 nm and below should mandate SEMI C27 certification, which specifies parts-per-trillion limits for 30+ metallic contaminants. Suppliers must demonstrate multi-stage distillation and clean-room packaging capabilities [2].
How does spent-acid regeneration compare to virgin HCl procurement on a total-cost basis?
SAR systems recover over 98% of free acid from steel pickling liquor, reducing net procurement costs by 25–35% while eliminating hazardous-waste disposal fees. Payback periods for SAR installations average 3–4 years [14].
What role does the Hydrochloric Acid Market play in lithium-battery recycling economics?
Hydrometallurgical recycling routes consume 0.8–1.2 tons of HCl per ton of black mass to leach cathode metals. Rising battery end-of-life volumes could add 1.5 million tons of annual demand by 2032 [6].
How are transport regulations reshaping the Hydrochloric Acid Market distribution model?
ADR/DOT Class 8 hazmat rules add USD 15–25/ton in logistics costs, incentivizing on-site acid-generation systems and regional hub-and-spoke distribution networks over long-haul shipments [12].
Which emerging geographic markets offer the strongest growth for Hydrochloric Acid Market participants?
India and Indonesia lead emerging-market growth, fueled by pharmaceutical API expansion and palm-oil processing, respectively. Both countries are investing heavily in domestic water treatment acids infrastructure [8].
How does energy-cost volatility in Europe impact the global Hydrochloric Acid Market supply balance?
High electricity prices have curtailed European chlor-alkali output, redirecting buyers toward Middle Eastern and Asian imports. This shift is accelerating regional supply-chain realignment toward lower-cost production zones [3].
Author
Author
Author Profile
Chitranshi Jaiswal LinkedIn
Team Lead - Research
Chitranshi is a Team Leader in the Chemicals & Materials (CnM) and Energy & Power (EnP) domains, with 6+ years of experience in market research. She leads and mentors teams to deliver cross-domain projects that equip clients with actionable insights and growth strategies. She is skilled in market estimation, forecasting, competitive benchmarking, and both primary & secondary research, enabling her to turn complex data into decision-ready insights. An engineer and MBA professional, she combines technical expertise with strategic acumen to solve dynamic market challenges. Chitranshi has successfully managed projects that support market entry, investment planning, and competitive positioning, while building strong client relationships. Certified in Advanced Excel & Power BI she leverages data-driven approaches to ensure accuracy, clarity, and impactful outcomes.

Research Approach

Research Methodology on Hydrochloric Acid Market

The research methodology for this report on the Global Hydrochloric Acid Market is developed based on various primary and secondary research materials and data. The secondary research phase includes a comprehensive search of various industry-related data sources such as published literature, industry reports, journals, white papers, and other sources. Additionally, a thorough analysis of the competitive landscape is conducted, which includes a comparison of the strategic moves, market shares, and product portfolios of the major players in the Global Hydrochloric Acid Market.

Primary research is conducted by contacting key market players and industry experts such as managing directors, chief technology officers (CTOs), vice presidents (VPs), and senior executives present in the Global Hydrochloric Acid Market. Primary research includes in-person interviews with respondents and the collection of their valuable insights and comments on the market and industry performance. The primary research phase also includes a detailed questionnaire and guided discussions.

Data Triangulation

To provide the reader with a holistic view of the Global Hydrochloric Acid Market, the data points obtained from primary and secondary research sources are triangulated to validate the accuracy of the data.

Market Estimation

The market estimation is one of the major stages of our study. During this stage, the market size and revenue from 2023 to 2030 are estimated. The revenue estimation is then extrapolated and documented in the form of market projections. The market projections are validated and reconfirmed with the help of expert opinion obtained from industry professionals and subject matter experts.

Data Validation & Scrutiny

The market data obtained from primary and secondary sources is then cautiously validated by the MRFR research analysts to ensure that the figures reported are correct and reliable. Furthermore, the report is scrutinized thoroughly for accuracy and consistency.

Vendor Profiling

Vendor profiling is conducted to identify and document the major players in the Global Hydrochloric Acid Market. The vendor profiling phase includes competitive analysis, information regarding the product portfolios, and market shares of the major players. Furthermore, detailed information regarding the strategies, SWOT analysis, and recent developments of the players are also included in the report.

Base Year & Forecasting Period

The base year for this study is 2022 and the forecasting horizon is 2023 to 2030. The key demand, supply, and support factors of the Global Hydrochloric Acid Market are also taken into consideration while evaluating the market growth prospects.

Download Free Sample

Kindly complete the form below to receive a free sample of this Report

Download PDF ×

We do not share your information with anyone. However, we may send you emails based on your report interest from time to time. You may contact us at any time to opt-out.

















