Industrial Lubricants Market (2026 - 2035)

Industrial Lubricants Market Research Report By Base Oil (Mineral Oil, Synthetic Oil, Bio Based Oil), By Product Type (Hydraulic Oil, Metalworking Fluids, Gear Oil, Grease, Turbine Oil, Others), By End Use (Construction (Heavy Machineries), Mining & Metal, Power Generation, Oil & Gas, Automotive (Vehicle Manufacturing), Chemical, Food Processing, Others), By Region - Forecast to 2035
ID: MRFR/CnM/2002-CR
111 Pages
Chitranshi Jaiswal
Last Updated: July 12, 2026
Industrial Lubricants Market
Market Size
Forecast Period2026-2035
CAGR (2026-2035)3.75%
2025 Market SizeUSD 63.80 Billion
2035 Market SizeUSD 92.20 Billion
Key Players
Shell plc
ExxonMobil Corporation
BP plc
TotalEnergies SE
Chevron Corporation
Fuchs Petrolub SE
Opportunities
  • Bio-Based and Environmentally Acceptable Lubricants
  • Condition-Monitoring-as-a-Service Business Models
  • Wind-Turbine and Solar-Tracker Lubrication

Industrial Lubricants Market Summary

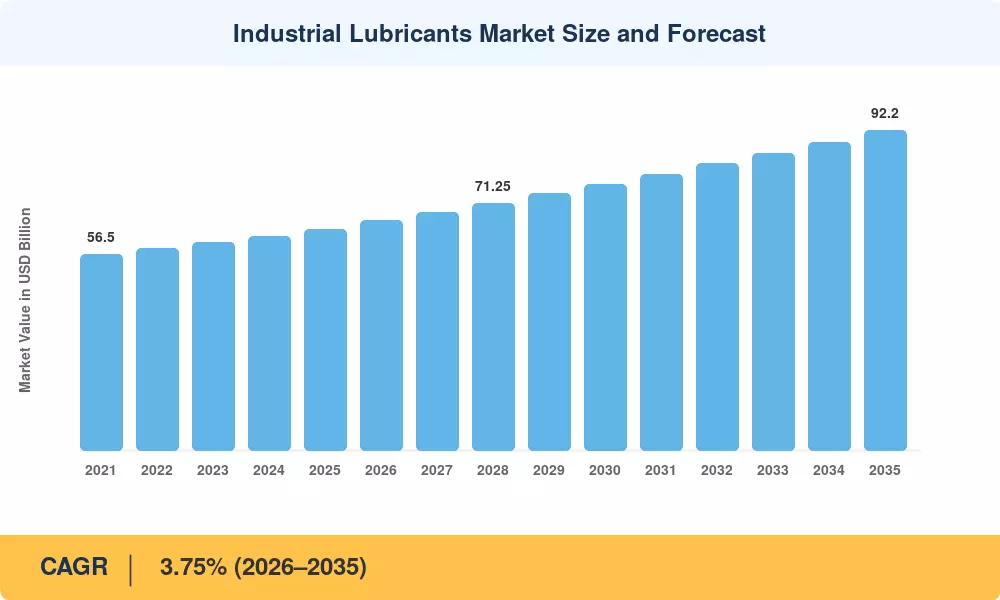
The Industrial Lubricants Market reached an estimated USD 63.80 billion in 2025 and is projected to grow from USD 66.19 billion in 2026 to USD 92.20 billion by 2035, registering a CAGR of 3.75% during the forecast period. Two forces are converging to drive this trajectory: governments worldwide are tightening equipment emissions standards under frameworks like the EU's Industrial Emissions Directive recast, and manufacturers are simultaneously accelerating capital expenditure on automated production lines that demand precision-grade fluids [1]. The result is a market that is rapidly moving beyond bulk commodity sales toward engineered, application-specific formulations.

Legacy mineral-oil-based products still account for the majority of volume, but the technology mix is shifting. Synthetic and semi-synthetic formulations—once reserved for aerospace and high-speed machining—are penetrating mainstream industrial applications as total-cost-of-ownership calculations favor longer drain intervals and reduced downtime. The U.S. Department of Energy estimates that optimized lubrication practices alone can reduce industrial energy consumption by 3–5% across heavy manufacturing facilities, a saving worth roughly USD 7.4 billion annually in the United States [2]. That economic incentive, paired with OEM specifications increasingly mandating synthetic basestocks, is reshaping purchasing behavior across the Industrial Lubricants Market.

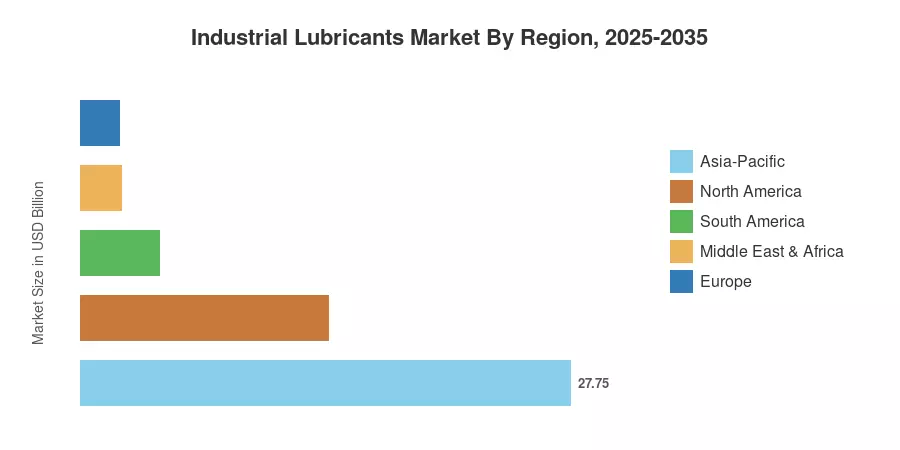
Asia-Pacific dominates global consumption with approximately 43.5% of the Industrial Lubricants Market in 2025, driven by China's integrated refinery-petrochemical expansions and India's accelerating infrastructure build-out. North America holds the second-largest share at around 22.0%, supported by shale-gas-era reindustrialization and strict EPA compliance requirements. Europe captures roughly 20.5%, with demand anchored in Germany's machinery sector and the Nordic region's push toward bio-based chemistries. As Industry 4.0 upgrades proliferate and renewable energy installations scale, the Industrial Lubricants Market stands at the intersection of sustainability mandates and performance engineering.


Key Report Takeaways

• By Product Type

  • Engine oil commanded a 25.1% share of the Industrial Lubricants Market in 2025, reflecting its broad application across mobile and stationary power equipment.
  • Hydraulic and transmission fluid is forecast to register the fastest segment CAGR of 4.25% through 2035, propelled by growing demand from automated material-handling systems.
  • Metalworking fluid accounted for USD 11.80 billion in 2025 as precision machining volumes expanded across automotive and aerospace supply chains.

• By End-User Industry

  • Heavy equipment represented 31.2% of the Industrial Lubricants Market in 2025, underpinned by global mining and construction activity.
  • Power generation is projected to grow at a 4.62% CAGR through 2035 as wind-turbine installations and gas-fired peaking plants multiply.
  • Food and beverage processing contributed USD 6.57 billion in 2025, with food-grade lubricant adoption rising under FSMA and EU Regulation 1935/2004.

• By Region

  • Asia-Pacific led the Industrial Lubricants Market with a 43.5% share in 2025 and is also the fastest-growing region at a 3.90% CAGR through 2035.
  • North America accounted for USD 14.04 billion in 2025, supported by reindustrialization trends and defense-sector procurement.
  • Europe is forecast to expand at a 3.48% CAGR through 2035, driven by decarbonization-linked reformulation mandates.


Industrial Lubricants Market Size and Forecast (2021–2035)

Market Research Future's sizing methodology triangulates top-down revenue modeling from base-oil production data, trade-flow analysis, and bottom-up demand estimates derived from installed equipment populations across 42 countries. Historical figures (2021–2024) are validated against customs data and published financial reports from major producers. Forecast figures (2026–2035) apply a calibrated compound growth model adjusted for macro-industrial indicators, regulatory pipeline analysis, and technology substitution curves.
Industrial Lubricants Market Size and Forecast
Our Impact
Enabled $4.3B Revenue Impact for Fortune 500 and Leading Multinationals
Partnering with 2000+ Global Organizations Each Year
30K+ Citations by Top-Tier Firms in the Industry

Driver Impact Analysis

Driver ~% Impact on CAGR Geographic Relevance Impact Timeline
Rising heavy-equipment deployment in emerging economies ~18% Asia-Pacific, South America Short-term (≤2 yr)
Industry 4.0 and smart manufacturing adoption ~15% North America, Europe Medium-term (2–4 yr)
Renewable energy infrastructure expansion ~12% Global Medium-term (2–4 yr)
Stringent environmental and emissions regulations ~10% Europe, North America Long-term (≥4 yr)
Shift toward high-performance synthetic formulations ~10% Global Medium-term (2–4 yr)
Growth in food-grade and specialty lubricant demand ~8% North America, Europe Short-term (≤2 yr)
Predictive maintenance and condition monitoring integration ~7% North America, Asia-Pacific Long-term (≥4 yr)


Rising Heavy-Equipment Deployment in Emerging Economies

Construction and mining equipment fleets across India, Indonesia, and Brazil are expanding at annual rates of 6–8% as governments channel public spending into roads, ports, and urban housing. India's National Infrastructure Pipeline alone earmarks USD 1.4 trillion in capital expenditure outlay for the fiscal years 2020–2025, each requiring lubricant-intensive earthmoving and piling machinery [11]. This equipment-population growth directly translates into higher lubricant consumption per unit of GDP—particularly for hydraulic fluids and gear oils consumed at rates of 200–400 liters per machine annually.

Industry 4.0 and Smart Manufacturing Adoption

CNC machining centers with sensors and robotic assembly cells impose greater restrictions on lubricant viscosity, thermal stability, and contamination limits. Lubrication management systems are a crucial element of predictive-maintenance designs [8], and global Industry 4.0 spending is projected to reach USD 3.7 trillion cumulatively by 2030. Fluid condition sensors now provide viscosity and particle count data in real time to MES systems, allowing lubricant replacement on a just-in-time basis instead of calendar-based drain intervals, increasing demand for premium, sensor-compatible formulations in the Industrial Lubricants Market.


Renewable Energy Infrastructure Expansion

Each utility-scale wind turbine consumes between 600 and 1,200 liters of specialized gear oil and grease over its operational life, with replenishment cycles of 3–5 years. IRENA projects global installed wind capacity to reach 2,000 GW by 2030. Offshore installations compound the requirement: saline environments and extended maintenance intervals demand synthetic PAO- and PAG-based formulations capable of operating across extreme temperature and humidity ranges. This expansion anchors a durable demand stream for the Industrial Lubricants Market well into the 2030s.

Stringent Environmental and Emissions Regulations

The EU’s updated Industrial Emissions Directive (IED) of 2024 expands best-available-technique (BAT) standards to the choice and disposal of lubricants at over 50,000 facilities in the member states [10]. Meanwhile, the new U.S. EPA’s Significant New Use Rules (SNUR) for PFAS chemicals are triggering a wave of reformulation among additive producers. Compliance costs are enormous (industry groups estimate EUR 2.1 billion in reformulation investment across Europe by 2028), but they also lock in demand for certified, high-specification products.


Restraints Impact Analysis

Restraint estimates below follow the same directional methodology outlined in Section 4 and represent headwinds that moderate the Industrial Lubricants Market growth rate relative to an unconstrained demand scenario.

Restraint ~% Impact on CAGR Geographic Relevance Impact Timeline
Volatility in base-oil and crude-oil prices ~-12% Global Short-term (≤2 yr)
Growing adoption of electric vehicles and equipment ~-10% Europe, North America Long-term (≥4 yr)
Increasing regulatory pressure on chemical additives ~-8% Europe Medium-term (2–4 yr)
Extended drain intervals reducing replacement volumes ~-7% North America, Europe Medium-term (2–4 yr)
Competition from dry and solid lubrication technologies ~-5% Asia-Pacific Long-term (≥4 yr)


Volatility in Base-Oil and Crude-Oil Prices

Brent crude is followed by Group I and Group II base oils, the feedstocks for about 70 % of the volume of industrial lubricants, with a 2–4 month lag. During the 2022-2023 pricing cycle, Group II spot prices ranged between USD 1,050 and USD 1,480 per metric ton within a year, reducing blender margins and leading to destocking across the distribution networks [4]. The price volatility discourages long-term procurement contracts, forcing mid-tier businesses to go for spot purchase, upsetting the supply chain of the Industrial Lubricants Market.


Growing Adoption of Electric Vehicles and Equipment

Battery-electric forklifts, excavators, and material-handling vehicles eliminate the need for engine oils and drastically reduce gearbox lubricant volumes. BloombergNEF projects that electric equipment will account for 3-5% of new industrial vehicle sales globally by 2030 [16]. While electric drivetrains still require thermal-management fluids and greases, per-unit lubricant consumption drops by an estimated 40–60% relative to diesel-powered equivalents.

Increasing Regulatory Pressure on Chemical Additives

ECHA's restriction proposals on zinc dialkyldithiophosphate (ZDDP) and borate-based extreme-pressure additives threaten to remove proven chemistries from the formulator's toolkit. Replacement additive packages remain 15–30% more expensive and require extended field-trial validation periods, slowing product-launch cycles and increasing R&D costs across the Industrial Lubricants Market [10].


Industrial Lubricants Market Opportunities

Bio-Based and Environmentally Acceptable Lubricants

The worldwide effort for carbon-neutral industrial processes is creating a fast-increasing market for ester-based and vegetable oil-based formulations. The USDA BioPreferred program has over 600 certified industrial lubricant products, and EU Ecolabel uptake for lubricants climbed 22% year-on-year in 2024 [12]. Producers investing in bio-based blending capacity can benefit from premium pricing of 20-35% over mineral counterparts and can meet procurement regulations by sustainability-minded manufacturers.


Condition-Monitoring-as-a-Service Business Models

Lubricant providers are overlaying IoT sensor hardware and cloud-based analytics systems on top of traditional product sales to establish recurring-revenue service streams. Sensor-driven dashboards that track viscosity, moisture, and ferrous particle counts trigger automated reorder workstreams. This data monetization opportunity transforms a commodity transaction into a managed service contract, creating an estimated 2.5–4x lift in per-customer lifetime value. Front runners like Shell’s LubeAnalyst and ExxonMobil’s Signum Oil Analysis [13] are defining the competitive standard.


Wind-Turbine and Solar-Tracker Lubrication

Renewable energy hardware creates a structural demand floor for specialty greases and gear oils. With IRENA forecasting 18,400 GW of cumulative renewable capacity by 2035, maintenance lubricant volumes for gear drives, pitch bearings, and solar-tracker actuators represent a multi-billion-dollar addressable segment that barely existed a decade ago [9].

Emerging-Market Formulation Localization

Countries such as Vietnam, Bangladesh, and Ethiopia are attracting manufacturing FDI at double-digit growth rates, yet local lubricant blending infrastructure remains underdeveloped. Setting up regional blending plants close to demand centers can reduce logistics costs by 12–18% and enable rapid customization for local OEM specifications. This localization opportunity is particularly acute in Southeast Asia, where the Industrial Lubricants Market is expanding faster than incumbent supply networks.

Food-Grade and Pharmaceutical Lubrication Standards

Heightened food-safety enforcement—FDA's FSMA Intentional Adulteration rule and equivalent EU hygiene regulations—is driving conversion from conventional to NSF H1-registered lubricants across food, beverage, and pharmaceutical production lines. Conversion rates in North America reached 38% of eligible equipment in 2024, with substantial headroom remaining in Asia-Pacific and South America [15].


Industrial Lubricants Market Future Outlook

AI-Driven Lubrication Management

Machine-learning algorithms processing vibration, temperature, and oil-quality sensor data will increasingly dictate lubricant change intervals and product selection. By 2030, the Industrial Lubricants Market will see an estimated 25–30% of large-plant lubrication decisions managed autonomously through AI-integrated CMMS platforms [13]. This shift elevates the importance of sensor-compatible fluid formulations and disadvantages commodity products that lack digital traceability.

Electrification and Thermal-Management Fluids

As electric drivetrains penetrate industrial equipment categories—from forklifts to excavators—the Industrial Lubricants Market will pivot toward dielectric coolants and e-axle fluids. Incumbents that invest in e-fluid R&D during this decade will capture first-mover advantage in what amounts to an entirely new product category.

Circular-Economy Lubricant Models

Re-refining and closed-loop collection systems are moving from niche operations to mainstream practice. The EU's revised Waste Framework Directive is both a regulatory push and an economic incentive for lubricant producers to establish take-back programs [10]. Re-refined base oils now match Group II quality specifications, enabling their reintegration into the Industrial Lubricants Market at 15–20% lower feedstock cost.

ESG Reporting and Scope 3 Lubricant Footprinting

Corporate sustainability reporting frameworks—particularly the CSRD in Europe and SEC climate-disclosure rules in the United States—are compelling manufacturers to quantify the carbon footprint of every input, including lubricants. Suppliers offering product-level carbon-intensity data and life-cycle assessments will gain procurement preference. By 2028, an estimated 40% of Fortune 500 industrial companies will require Scope 3 emissions data from lubricant vendors as a procurement prerequisite [21].


Industrial Lubricants Market Segmentation

By Product Type

Segment Key Metric Primary Demand Driver
Engine Oil 25.1% share (2025) Mobile equipment fleets
Hydraulic and Transmission Fluid 4.25% CAGR (2026–2035) Automated material handling
Metalworking Fluid USD 11.80 B (2025) Precision-machining volumes
General Industrial Oils 3.50% CAGR (2026–2035) Compressor and turbine applications
Grease USD 6.63 B (2025) Bearing and chassis lubrication
Process Oils 3.30% CAGR (2026–2035) Rubber and polymer processing


Engine oil retains the largest share of the Industrial Lubricants Market by product type, consumed across diesel-powered generators, off-highway vehicles, and marine auxiliary engines. Demand is resilient because installed diesel equipment populations have multi-decade service lives, ensuring replacement-volume stability even as new electric alternatives emerge. Formulators are responding with lower-viscosity grades (SAE 0W-20 and 5W-30) that deliver measurable fuel-economy improvements of 1.5–3% per engine.

Hydraulic and transmission fluid is the fastest-growing product segment, with automated warehouses, robotic assembly lines, and hydraulic-press installations all contributing to volume acceleration. The proliferation of servo-hydraulic systems requiring zinc-free, ashless formulations is pushing average selling prices upward, making this segment a margin-accretive growth engine for blenders serving the Industrial Lubricants Market.

By End-User Industry

Segment Key Metric Primary Demand Driver
Heavy Equipment 31.2% share (2025) Construction and mining activity
Power Generation 4.62% CAGR (2026–2035) Wind-turbine and gas-turbine installations
Metallurgy and Metalworking USD 10.53 B (2025) Automotive and aerospace parts production
Chemical and Process Industries 3.65% CAGR (2026–2035) Reactor and compressor lubrication
Food and Beverage Processing USD 6.57 B (2025) Food-grade conversion mandates
Other Industries 3.40% CAGR (2026–2035) Textiles, paper, and general manufacturing


Heavy equipment dominates the Industrial Lubricants Market by end-user because each piece of mining or construction machinery consumes thousands of liters annually across engine, hydraulic, drivetrain, and chassis-grease applications. CAT, Komatsu, and Volvo CE specification manuals effectively dictate lubricant chemistry, creating a captive demand channel for approved formulations. Power generation is the fastest-growing end-user segment, with wind-turbine gearbox oils, gas-turbine compressor lubricants, and transformer oils all benefiting from the global energy-transition buildout.


Regional Market Share Analysis

Region Key Metric Primary Investment Themes
Asia-Pacific 43.5% share (2025) Refinery integration; EV-component machining
North America USD 14.04 B (2025) Reindustrialization; food-grade conversion
Europe 3.48% CAGR (2026–2035) Decarbonization; REACH-driven reformulation
South America USD 4.47 B (2025) Mining expansion; agribusiness mechanization
Middle East & Africa 3.62% CAGR (2026–2035) Oilfield services; port infrastructure
Total USD 63.80 B (2025)

The Industrial Lubricants Market displays a pronounced geographic concentration, with Asia-Pacific consuming nearly half of global volume. Regional dynamics vary sharply: mature markets in North America and Europe are shifting toward value-added synthetic and bio-based products, while emerging regions prioritize volume growth tied to industrialization.


North America

Country Key Metric Key Driver
United States 72.5% of regional share Defense-sector procurement; shale-field equipment
Canada 3.60% CAGR (2026–2035) Oil-sands operations; mining lubrication
Mexico USD 1.26 B (2025) Nearshoring-driven manufacturing growth


The United States remains the engine of North American demand, with the Department of Defense alone procuring an estimated USD 1.2 billion in lubricants annually for vehicle fleets and naval assets [2]. Canada's oil-sands sector consumes high volumes of extreme-temperature hydraulic fluids, while Mexico's expanding automotive-parts manufacturing base is attracting lubricant blending investments from global majors.

Europe

Country Key Metric Key Driver
Germany 24.8% of regional share Machinery OEM specifications
United Kingdom USD 1.83 B (2025) Offshore wind maintenance
France 3.55% CAGR (2026–2035) Nuclear and renewables infrastructure
Italy USD 1.44 B (2025) Automotive supply chain
Spain 3.40% CAGR (2026–2035) Solar-tracker lubrication demand
Nordic Countries USD 0.92 B (2025) Bio-based lubricant leadership
Russia 8.5% of regional share Heavy-industry base; sanctions-limited imports
Rest of Europe 3.30% CAGR (2026–2035) Eastern European manufacturing expansion


Germany's machinery-building sector—responsible for EUR 236 billion in annual output—sets stringent OEM lubricant specifications that cascade through global supply chains [6]. The UK's North Sea wind-farm buildout is driving demand for marine-grade greases, while France's nuclear maintenance cycle creates a captive market for radiation-resistant specialty lubricants.

Asia-Pacific

Country Key Metric Key Driver
China 48.2% of regional share Integrated refinery-blending complexes
India 4.15% CAGR (2026–2035) Infrastructure pipeline; railway modernization
Japan USD 3.62 B (2025) Precision-machinery and robotics
South Korea 3.85% CAGR (2026–2035) Semiconductor-fab cleanroom lubricants
ASEAN USD 3.18 B (2025) FDI-driven manufacturing relocation
Rest of Asia-Pacific 3.70% CAGR (2026–2035) Mining and agricultural mechanization


China's dominance stems from a vertically integrated supply chain: Sinopec and PetroChina operate refinery-to-blending-plant complexes that produce roughly 6.5 million metric tons of finished lubricants annually [18]. India's Industrial Lubricants Market growth is propelled by the Gati Shakti infrastructure masterplan, which allocates USD 1.2 trillion toward multimodal logistics and manufacturing corridors requiring heavy-equipment lubrication at every stage.

South America

Country Key Metric Key Driver
Brazil 62.0% of regional share Mining and agribusiness
Argentina USD 0.72 B (2025) Vaca Muerta shale development
Rest of South America 3.50% CAGR (2026–2035) Copper and lithium mining expansion


Brazil's mining and agricultural sectors are the primary consumption engines, with Vale, Petrobras, and JBS collectively driving procurement of hydraulic fluids and gear oils across sprawling operational footprints. Argentina's Vaca Muerta shale basin is attracting USD 5 billion in annual upstream investment, each drilling rig consuming 8,000–12,000 liters of lubricants annually [19].

Middle East & Africa

Country Key Metric Key Driver
Saudi Arabia 32.5% of regional share Vision 2030 industrial diversification
UAE USD 0.68 B (2025) Port and logistics hub expansion
South Africa 3.45% CAGR (2026–2035) Mining-sector equipment fleets
Egypt USD 0.41 B (2025) Suez Canal corridor industrialization
Rest of MEA 3.55% CAGR (2026–2035) East African infrastructure build


Saudi Arabia's Vision 2030 program is catalyzing a manufacturing diversification push that includes new automotive, defense, and chemical-processing facilities—all lubricant-intensive operations. The UAE's Jebel Ali and Khalifa Port expansions are driving demand for marine and logistics-equipment lubricants, while South Africa's platinum-group-metals mining sector remains a steady consumer of extreme-pressure greases [20].


Industrial Lubricants Market By Region, 2025-2035

Competitive Benchmarking

The Industrial Lubricants Market exhibits medium concentration, with the top five producers collectively holding an estimated 38–45% revenue share. The Herfindahl-Hirschman Index (HHI) is estimated at 600–800, indicating a moderately fragmented competitive structure where large integrated oil majors compete alongside specialty chemical companies and regional blenders. Product differentiation through OEM approvals, additive technology, and service-network density drives competitive positioning more than price alone.

Company Est. Revenue Share Range Key Offerings for Industrial Lubricants Market Strategic Positioning
Shell plc ~10–14% Shell Tellus (hydraulic), Shell Omala (gear), Shell Gadus (grease) Broadest OEM-approval portfolio; global supply network
ExxonMobil Corporation ~9–12% Mobil DTE (hydraulic), Mobil SHC (synthetic), Mobilgrease XHP Synthetic technology leadership; Signum oil analysis
BP plc (Castrol) ~7–10% Castrol Hyspin, Castrol Optigear, Castrol Tribol Premium branding; strong automotive-crossover recognition
TotalEnergies SE ~5–8% Total Azolla, Total Carter, Total Multis EP European distribution strength; bio-lubricant R&D
Chevron Corporation ~4–7% Texaco Rando, Texaco Meropa, Chevron Delo Americas-focused; mining and oilfield specialization
Fuchs Petrolub SE ~3–5% Renolin, Renolit, Ecocool Pure-play lubricant specialist; niche engineering fluids
PETRONAS Lubricants International ~3–5% PLI Urania, Syntium Industrial, Tutela Asia-Pacific distribution; F1-derived technology transfer
Indian Oil Corporation Ltd. ~2–4% Servo, Servo Premium, Servo System Dominant in India; refinery-to-customer vertical integration
Idemitsu Kosan Co., Ltd. ~2–3% Daphne, Idemitsu Super Mulpus Japanese-market leadership; precision-machinery grades
Valvoline Global Operations ~2–3% Valvoline Industrial, ValvTac Strong distributor channel; quick-service model


Recent News & Developments

  • Shell plc (March 2025): Deployed its high-performance Shell Tellus range of premium hydraulic fluids across commercial distribution networks, leveraging gas-to-liquids (GTL) base oils to provide advanced zinc-free anti-wear protection and maintain high system efficiency down to extreme temperatures.
  • ExxonMobil Corporation (January 2025): Scaled its cloud-based Signum Oil Analysis platform globally, integrating advanced data analytics to track machinery fluid condition metrics, allowing multi-plant operators to optimize asset drain intervals and minimize unscheduled manufacturing downtime.


  • Fuchs Petrolub SE (January 2020): Formally completed its strategic acquisition of U.S.-based synthetic lubricant developer Nye Lubricants Inc., integrating specialized engineering labs and high-end formulations for the aerospace, medical, and automotive sectors to operate as a total solutions provider.


  • Chevron Corporation (December 2024): Completed a major engineering retrofit of its refinery in Pasadena, Texas, expanding its Gulf Coast processing capacity for lighter equity crudes from the Permian Basin by nearly 15 percent to reach 125,000 barrels per day.


Industrial Lubricants Market Report Scope

Parameter Detail
Market Scope Global Industrial Lubricants Market by Product Type, End-User Industry, and Region
Study Period 2021–2035
CAGR 3.75% (2026–2035)
Base Year Market Size USD 63.80 Billion (2025)
Forecast Endpoint USD 92.20 Billion (2035)
Fastest Growing Segment (Product) Hydraulic and Transmission Fluid (4.25% CAGR)
Fastest Growing Segment (End-User) Power Generation (4.62% CAGR)
Companies Profiled 10 (Shell, ExxonMobil, BP, TotalEnergies, Chevron, Fuchs, PETRONAS, Indian Oil, Idemitsu, Valvoline)
Valuation Currency USD Billion


FAQs

How do OEM lubricant approvals affect procurement decisions in heavy industry?
OEM specifications from manufacturers like Caterpillar, Komatsu, and Siemens function as de facto purchasing mandates. Using non-approved fluids typically voids equipment warranties and raises insurance liability, limiting buyer choice to pre-certified products [6].
What role do re-refined base oils play in the industrial supply chain?
Re-refined Group II base oils now meet API and ASTM specifications identical to virgin stocks. They reduce feedstock costs by 15–20%, and help producers meet circular-economy procurement targets increasingly required by industrial buyers [17].
How does the shift to electric forklifts change lubricant purchasing patterns?
Electric forklifts eliminate engine-oil demand entirely and cut total lubricant consumption per unit by roughly 50%. Procurement shifts toward e-axle fluids and food-grade greases for clean warehouse environments [16].
What differentiates synthetic PAO-based lubricants from conventional mineral oils in extreme conditions?
PAO synthetics maintain stable viscosity across temperature ranges of -40 °C to 180 °C, enabling 3–5× longer drain intervals. The upfront cost premium of 2–3× is offset by reduced downtime and disposal costs [14].
How are PFAS regulations reshaping additive formulation strategies?
Pending EU and U.S. PFAS restrictions are forcing additive suppliers to develop fluorine-free anti-wear and anti-foam alternatives. Reformulation timelines of 18–36 months create a competitive window for early movers [10].
What integration challenges arise when deploying IoT-based oil-condition monitoring?
Sensor calibration drift, legacy CMMS compatibility, and high per-sensor costs (USD 500–2,000) remain barriers. Plants typically pilot 50–100 sensors before scaling, requiring 6–12 months of baseline data collection [13].
How do food-grade lubricant conversions impact total cost of ownership in beverage plants?
NSF H1 lubricants cost 2–4× more per liter than conventional alternatives, but they eliminate contamination-related product recalls. Net TCO impact is typically neutral to positive within 18 months of conversion [15].    
Author
Author
Author Profile
Chitranshi Jaiswal LinkedIn
Team Lead - Research
Chitranshi is a Team Leader in the Chemicals & Materials (CnM) and Energy & Power (EnP) domains, with 6+ years of experience in market research. She leads and mentors teams to deliver cross-domain projects that equip clients with actionable insights and growth strategies. She is skilled in market estimation, forecasting, competitive benchmarking, and both primary & secondary research, enabling her to turn complex data into decision-ready insights. An engineer and MBA professional, she combines technical expertise with strategic acumen to solve dynamic market challenges. Chitranshi has successfully managed projects that support market entry, investment planning, and competitive positioning, while building strong client relationships. Certified in Advanced Excel & Power BI she leverages data-driven approaches to ensure accuracy, clarity, and impactful outcomes.

Research Approach

Research Methodology on Industrial Lubricants Market

Introduction

This Research aims to explore the drivers, trends and opportunities of the global industrial lubricants market. This research focuses on a detailed assessment of drivers, trends, and opportunities that the global industrial lubricants market is experiencing. The global industrial lubricants market will be evaluated from the perspective of leading market players, demand and supply trends, growth policies, and technological advances. The research should offer in-depth insight into the factors driving, limiting, and creating opportunities in the industrial lubricants market.

Objectives

The key objectives of this research are as follows:

  • To analyze the key drivers and trends of the global industrial lubricants market.
  • To assess the impact of technology, innovation, and policies on the global industrial lubricants market.
  • To analyze the growth opportunities in the visual communication market.
  • To evaluate the strategies adopted by leading market players.

Research design

In order to conduct a comprehensive study of the global industrial lubricants market, this research will utilize a combination of primary and secondary data sources. For the primary data sources, interviews with relevant experts from the market, such as manufacturers, distributors, suppliers, and end users are conducted. For the secondary data sources, relevant industry journals, reports and databases, such as databases from Factiva and Nexis, are utilized.

Data Collection

Primary Data:

For the primary data sources, interviews with relevant experts from the market, such as manufacturers, distributors, suppliers, and end users are conducted. Structured interviews are conducted in order to elicit comprehensive responses to our research questions. The data collected through these interviews are then analyzed to identify the key drivers and trends in the industrial lubricants market.

Secondary data:

For the secondary data sources, relevant industry journals, reports and databases, such as databases from Factiva and Nexis, are utilized. The secondary data sources used in this research include reports and literature from both the public and private sectors on trends and growth factors of the global industrial lubricants market. In addition, data from various interviews are collected and analyzed.

Sampling

The sample size for this research consists of 30 respondents from the leading manufacturers, distributors, suppliers, and end users in the industrial lubricants market. The sample population is selected based on their professional expertise and relevance to this research.

Data Analysis

In order to analyze the data collected from the interviews and secondary sources, descriptive and inferential statistical methods are utilized. Descriptive statistical methods such as frequency distributions, percentages, and graphical representations are employed to summarize the data gathered from the interviews. Inferential statistical methods such as correlations, regressions, and t-tests are used to identify patterns and trends in the data. The data will then be further analyzed to draw meaningful conclusions about the key drivers and trends of the global industrial lubricants market.

Conclusion

This research aims to explore the drivers, trends and opportunities of the global industrial lubricants market. This will be done through a combination of primary and secondary data sources. Primary sources include interviews with relevant experts, while secondary sources include reports and literature from both the public and private sectors on trends and growth factors of the global industrial lubricants market. Descriptive and inferential statistical methods are used to analyze the data gathered, and the results of this analysis are used to draw meaningful conclusions about the key drivers and trends of the market.

Download Free Sample

Kindly complete the form below to receive a free sample of this Report

Download PDF ×

We do not share your information with anyone. However, we may send you emails based on your report interest from time to time. You may contact us at any time to opt-out.

















