×
Hero Background
English
Chinese
French
Japanese
Korean
German
Spanish

Joint Compound Market Trends

ID: MRFR/CnM/17652-HCR
128 Pages
Anshula Mandaokar
October 2025

Joint Compound Market Research Report Information By Product Type (Ready Mix, Setting Type, and Drying Type), By End Use (Residential Construction, Commercial Construction, Institutional Construction, and Industrial Construction), By Application (New Construction, and Refurbishments), And By Region (North America, Europe, Asia-Pacific, And Rest Of The World) –Market Forecast Till 2035

Share:
Download PDF ×

We do not share your information with anyone. However, we may send you emails based on your report interest from time to time. You may contact us at any time to opt-out.

Joint Compound Market Infographic
Purchase Options

Market Trends

Key Emerging Trends in the Joint Compound Market

The joint compound market is experiencing significant trends influenced by various factors impacting both supply and demand dynamics. One notable trend is the increasing demand for joint compounds in the construction and building materials industry. Joint compounds, also known as drywall mud or spackle, are essential for finishing drywall installations and repairing surface imperfections. As construction activity continues to grow globally, particularly in residential and commercial sectors, there is a rising demand for high-quality joint compounds that offer ease of application, superior adhesion, and smooth finish. This trend is driven by ongoing urbanization, infrastructure development, and renovation projects, which require reliable and efficient solutions for finishing interior walls and ceilings.

Another prominent trend in the joint compound market is the shift towards eco-friendly and low-VOC (volatile organic compound) formulations. With increasing awareness of indoor air quality and environmental sustainability, there is a growing demand for joint compounds that emit fewer harmful chemicals and contribute to healthier indoor environments. Manufacturers are responding to this trend by developing low-VOC and green building compliant joint compounds that meet stringent regulatory standards while delivering optimal performance and durability. This trend is driven by consumer preferences for sustainable building materials and green construction practices, as well as regulatory mandates promoting environmentally friendly products in the construction industry.

Furthermore, the market is witnessing technological advancements and product innovations aimed at improving the performance and versatility of joint compounds. Manufacturers are investing in research and development to develop lightweight joint compounds with enhanced workability, sag resistance, and sandability, allowing for faster and more efficient finishing of drywall surfaces. Additionally, there is a growing demand for specialty joint compounds tailored to specific applications such as high-humidity environments, fire-rated assemblies, and acoustic insulation. This trend is driven by the need for customized solutions that address the unique requirements of different construction projects and building codes.

The joint compound market is also influenced by shifting consumer preferences and buying behavior in the DIY (do-it-yourself) and home improvement sectors. With the rise of home renovation projects and DIY culture, there is an increasing demand for user-friendly joint compounds that are suitable for non-professional use. Manufacturers are responding to this trend by offering easy-to-use joint compound kits and pre-mixed formulations that require minimal preparation and expertise, enabling homeowners and DIY enthusiasts to achieve professional-looking results with minimal effort. This trend is driving growth in the consumer segment of the joint compound market and expanding the market reach to new demographics and distribution channels.

Moreover, the market is experiencing increased competition and consolidation among key players, leading to strategic partnerships, mergers, and acquisitions to strengthen market positions and expand product portfolios. As the industry becomes more consolidated, companies are focusing on innovation, efficiency, and market expansion to maintain competitiveness and drive growth. This trend is driving investments in research and development, as well as market expansion strategies to tap into emerging markets and untapped opportunities in the joint compound market.

On the supply side, the joint compound market is influenced by factors such as raw material availability, manufacturing processes, and distribution networks. Fluctuations in raw material prices, such as gypsum, polymers, and fillers, can impact production costs and pricing of joint compounds. Additionally, advancements in manufacturing technologies, such as automated mixing and packaging systems, are improving efficiency and reducing production lead times, allowing manufacturers to meet growing demand and maintain competitive pricing. This trend is driving investments in production capacity expansion and supply chain optimization to ensure reliable and timely delivery of joint compounds to customers.

Author
Anshula Mandaokar
Team Lead - Research

Anshula Mandaokar holds an academic degree in Chemical Engineering and has been contributing to the field for more than 5 years. She has expertise in Market Research and Business Consulting and serves as a Team Lead for a reputed Market Research firm under the Chemicals and Materials domain spectrum. She has worked on multiple projects, generating explicit results in a quick turnaround time. Her understanding of data interpretation justifies her role as a leader.

Leave a Comment

FAQs

What is the current valuation of the Joint Compound Market as of 2024?

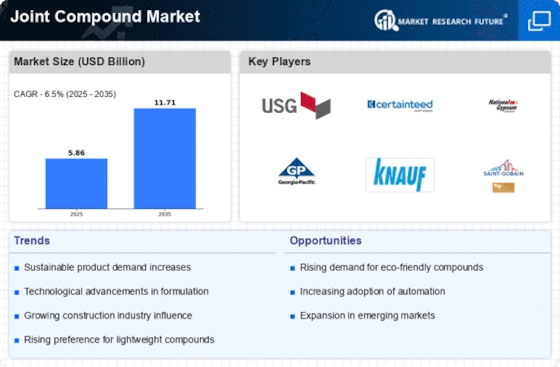
The Joint Compound Market was valued at 5.858 USD Billion in 2024.

What is the projected market size for the Joint Compound Market by 2035?

The market is projected to reach 11.71 USD Billion by 2035.

What is the expected CAGR for the Joint Compound Market during the forecast period 2025 - 2035?

The expected CAGR for the Joint Compound Market during 2025 - 2035 is 6.5%.

Which segment of the Joint Compound Market had the highest valuation in 2024?

In 2024, the Ready Mix segment had the highest valuation at 2.929 USD Billion.

How does the valuation of the Residential Construction segment compare to the Commercial Construction segment?

The Residential Construction segment was valued at 1.5 USD Billion, while the Commercial Construction segment was valued at 1.8 USD Billion in 2024.

What are the projected valuations for the Drying Type segment by 2035?

The Drying Type segment is projected to reach 2.57 USD Billion by 2035.

Market Summary

As per MRFR analysis, the Joint Compound Market Size was estimated at 5.858 USD Billion in 2024. The Joint Compound industry is projected to grow from 6.238 USD Billion in 2025 to 11.71 USD Billion by 2035, exhibiting a compound annual growth rate (CAGR) of 6.5 during the forecast period 2025 - 2035.

Key Market Trends & Highlights

The Joint Compound Market is experiencing a dynamic shift driven by sustainability and technological advancements.

  • North America remains the largest market for joint compounds, reflecting a robust demand in residential construction.
  • The Asia-Pacific region is emerging as the fastest-growing market, propelled by increasing urbanization and infrastructure development.
  • Ready Mix joint compounds dominate the market, while Setting Type compounds are gaining traction due to their rapid application benefits.
  • Key market drivers include sustainability initiatives and the rising demand in renovation projects, which are reshaping consumer preferences.

Market Size & Forecast

2024 Market Size 5.858 (USD Billion)
2035 Market Size 11.71 (USD Billion)
CAGR (2025 - 2035) 6.5%
Largest Regional Market Share in 2024 North America

Major Players

<p>USG Corporation (US), CertainTeed Corporation (US), National Gypsum Company (US), Georgia-Pacific LLC (US), Knauf Gips KG (DE), Saint-Gobain (FR), Boral Limited (AU), LafargeHolcim (CH), Armstrong World Industries (US)</p>

Market Trends

The Joint Compound Market is currently experiencing a dynamic phase characterized by evolving consumer preferences and technological advancements. As construction and renovation activities gain momentum globally, the demand for joint compounds is likely to increase. This growth is driven by the rising need for efficient and high-quality finishing materials in both residential and commercial projects. Furthermore, the market appears to be influenced by a shift towards eco-friendly products, as consumers become more environmentally conscious. Manufacturers are responding by developing sustainable formulations that align with these preferences, potentially enhancing their market position. In addition, the Joint Compound Market seems to be witnessing a trend towards automation and innovation in application techniques. The introduction of advanced tools and equipment may streamline the application process, thereby improving efficiency and reducing labor costs. This technological integration could lead to a more competitive landscape, as companies strive to differentiate their offerings. Overall, the Joint Compound Market is poised for growth, driven by a combination of consumer demand, sustainability initiatives, and technological advancements.

Sustainability Initiatives

The Joint Compound Market is increasingly influenced by sustainability initiatives. Manufacturers are focusing on creating eco-friendly products that minimize environmental impact. This trend reflects a broader consumer demand for greener building materials, which may enhance brand loyalty and market share.

Technological Advancements

Technological advancements are reshaping the Joint Compound Market. Innovations in application techniques and product formulations are emerging, potentially improving efficiency and performance. This trend suggests that companies investing in research and development may gain a competitive edge.

Rising Demand in Renovation Projects

The Joint Compound Market is experiencing a surge in demand driven by renovation projects. As homeowners and businesses seek to upgrade their spaces, the need for high-quality joint compounds is likely to increase. This trend indicates a robust market opportunity for suppliers.

Joint Compound Market Market Drivers

Sustainability Initiatives

The Joint Compound Market is increasingly influenced by sustainability initiatives. Manufacturers are focusing on eco-friendly products that minimize environmental impact. This shift is driven by consumer demand for greener building materials, which has led to the development of low-VOC and biodegradable joint compounds. As regulations tighten around construction materials, companies that prioritize sustainability are likely to gain a competitive edge. The market for sustainable joint compounds is projected to grow, reflecting a broader trend towards environmentally responsible construction practices. This focus on sustainability not only meets regulatory requirements but also appeals to environmentally conscious consumers, thereby expanding the market reach of manufacturers.

Technological Advancements

Technological advancements play a crucial role in shaping the Joint Compound Market. Innovations in formulation and application techniques have led to the development of faster-drying and easier-to-apply joint compounds. These advancements enhance productivity for contractors and reduce labor costs, making them attractive options in the construction sector. Moreover, the integration of digital tools for application and measurement is becoming more prevalent, allowing for greater precision and efficiency. As technology continues to evolve, it is expected that the Joint Compound Market will see an influx of new products that cater to the needs of modern construction practices, potentially increasing market share for tech-savvy manufacturers.

Growth of the Construction Sector

The Joint Compound Market is closely tied to the growth of the construction sector. As infrastructure development and residential construction projects increase, the demand for joint compounds is expected to rise correspondingly. Recent statistics indicate that construction spending has been on an upward trajectory, driven by both public and private investments. This growth is likely to create a favorable environment for joint compound manufacturers, as they supply essential materials for drywall installation and finishing. The expansion of the construction sector not only boosts sales but also encourages innovation within the Joint Compound Market, as companies strive to meet the evolving needs of builders and contractors.

Rising Demand in Renovation Projects

The Joint Compound Market is experiencing a surge in demand due to the increasing number of renovation projects. Homeowners and commercial property owners are investing in renovations to enhance property value and aesthetics. This trend is particularly pronounced in urban areas where older buildings require updates to meet contemporary standards. According to recent data, the renovation sector is projected to grow significantly, which in turn boosts the demand for joint compounds used in drywall finishing. As more projects emerge, manufacturers in the Joint Compound Market are likely to benefit from this trend, leading to increased sales and market expansion.

Increased Focus on Aesthetic Finishes

The Joint Compound Market is witnessing an increased focus on aesthetic finishes in construction and renovation projects. As design trends evolve, there is a growing demand for smooth, flawless wall surfaces that enhance the overall appearance of interiors. This trend is prompting contractors and builders to seek high-quality joint compounds that provide superior finish and durability. The emphasis on aesthetics is likely to drive innovation in product formulations, leading to the introduction of joint compounds that cater specifically to design-oriented applications. As consumer preferences shift towards visually appealing spaces, the Joint Compound Market is expected to adapt, potentially leading to increased market opportunities for manufacturers.

Market Segment Insights

By Type: Ready Mix (Largest) vs. Setting Type (Fastest-Growing)

<p>In the Joint Compound Market, the distribution of market share across the various segment types reveals that Ready Mix joints hold the largest proportion, owing to their convenience and ease of use. They cater to both DIY enthusiasts and professionals seeking quick application solutions. On the other hand, Setting Type compounds are witnessing a surge in popularity among contractors due to their fast-curing properties, effectively making them the fastest-growing segment.</p>

<p>Ready Mix (Dominant) vs. Setting Type (Emerging)</p>

<p>Ready Mix compounds are characterized by their pre-mixed formulations, which facilitate quicker application and robust performance, making them ideal for residential and light commercial applications. Meanwhile, Setting Type compounds, which require mixing with water before application, are gaining traction for their ability to harden rapidly and provide superior bonding, especially in high-stress environments. These features make Ready Mix the dominant choice among users for general purposes, while Setting Type emerges as the preferred option for projects requiring expedited completion times.</p>

By End Use: Residential Construction (Largest) vs. Commercial Construction (Fastest-Growing)

<p>In the Joint Compound Market, the distribution of the end-use segments reflects a diverse construction landscape. Residential construction leads the market, driven by ongoing housing demands and renovations. This segment's strong foothold is underpinned by trends promoting home improvement and increased residential building activity, making it a substantial contributor to market dynamics. On the other hand, commercial construction is rapidly gaining traction, showcasing a significant advance in growth. Businesses are investing more in office spaces, retail establishments, and commercial facilities, thereby fostering a shift towards a booming commercial construction sector. The growth trends within these segments are influenced by various factors. The recovery in housing markets and increased disposable income among the populace significantly stimulate residential construction activities. Furthermore, the push towards sustainable construction practices is reshaping the demand for joint compounds in commercial spaces, leading to innovative product development. The emergence of smart buildings is also contributing to the rapid expansion of the commercial construction segment, as developers seek to integrate state-of-the-art technologies and eco-friendly solutions into their projects.</p>

<p>Residential Construction: Dominant vs. Commercial Construction: Emerging</p>

<p>Residential construction is characterized by its robust demand stemming from an increase in population and shifting demographics that favor homeownership. The continuous influx of new housing projects and renovation activities ensures that joint compounds remain a crucial component in this sector. The quality of joint compounds used is pivotal for meeting the aesthetic and functional needs of homeowners, where factors like ease of application and finish quality play a decisive role. Meanwhile, commercial construction is an emerging force, marked by a shift towards modern facilities and innovative use of joints. This segment is witnessing an increase in investment, largely attributed to a surging need for updated commercial spaces, wherein sustainable materials and advanced joint formulations are gaining prominence. As the market evolves, these two segments showcase distinct characteristics that define their contributions to the overall Joint Compound Market.</p>

By Application: Refurbishments (Largest) vs. New Construction (Fastest-Growing)

<p>In the Joint Compound Market, the application segment is notably dominated by refurbishments, which account for a significant portion of market share. This dominance is driven by ongoing maintenance and upgrading of existing buildings, necessitating the use of joint compounds for drywall finishing. New construction also plays a pivotal role but represents a smaller yet critical share due to the constant demand for new residential and commercial properties. As construction practices evolve, the preference for specific joint compounds is influenced by innovations in terms of ease of application and finish quality. Growth trends in the Joint Compound Market show a promising trajectory for new construction, driven by increasing urbanization and construction activities globally. As cities expand and new settlements emerge, the need for effective joint compounds rises sharply. Additionally, sustainability and efficiency in building practices are propelling innovations in joint compound formulations, aligning with industry demands for greener products. While refurbishments remain a stable source of demand, the rapid growth potential in new construction presents exciting opportunities for market players seeking to capitalize on emerging trends.</p>

<p>Refurbishments: Dominant vs. New Construction: Emerging</p>

<p>The refurbishments segment in the Joint Compound Market is characterized by its established demand based on the need for upgrading existing facilities. This segment benefits from continuous maintenance trends, where builders and contractors seek high-quality joint compounds to ensure durability and finish standards. In contrast, the new construction segment, while currently smaller, is rapidly gaining momentum due to an increase in construction projects spurred by population growth and urban development. New construction also tends to favor innovative, easy-to-use joint compounds that align with modern construction efficiency goals. Both segments play critical roles in shaping the market landscape, with refurbishments offering stability and new construction providing growth opportunities, influenced heavily by changing architectural trends and sustainability imperatives.</p>

Get more detailed insights about Joint Compound Market Research Report - Global Forecast by 2035

Regional Insights

North America : Market Leader in Joint Compounds

North America is the largest market for joint compounds, holding approximately 45% of the global market share. The growth is driven by a robust construction sector, increasing residential and commercial building activities, and a rising trend in home renovations. Regulatory support for sustainable building practices further fuels demand, as manufacturers innovate to meet environmental standards. The United States dominates this market, with key players like USG Corporation, CertainTeed Corporation, and National Gypsum Company leading the charge. The competitive landscape is characterized by a mix of established companies and emerging players, all vying for market share. The presence of these major manufacturers ensures a steady supply of high-quality joint compounds, catering to diverse construction needs.

Europe : Emerging Market Dynamics

Europe is witnessing significant growth in the joint compound market, accounting for approximately 30% of the global share. The demand is primarily driven by increasing construction activities, particularly in the residential sector, and a shift towards eco-friendly building materials. Regulatory frameworks promoting energy efficiency and sustainability are also key catalysts for market expansion. Leading countries in this region include Germany, France, and the UK, where companies like Knauf Gips KG and Saint-Gobain are prominent. The competitive landscape is evolving, with a focus on innovation and sustainability. The presence of established players ensures a competitive market, while new entrants are emerging to meet the growing demand for environmentally friendly products.

Asia-Pacific : Rapidly Expanding Market

Asia-Pacific is rapidly emerging as a significant player in the joint compound market, holding around 20% of the global share. The growth is fueled by urbanization, increasing disposable incomes, and a booming construction industry, particularly in countries like China and India. Government initiatives aimed at infrastructure development and housing projects are also contributing to market expansion. China is the largest market in this region, followed by India and Australia. The competitive landscape features both local and international players, with companies like Boral Limited and Armstrong World Industries making notable impacts. The focus on innovation and product development is driving competition, as manufacturers strive to meet the diverse needs of the growing construction sector.

Middle East and Africa : Emerging Opportunities Ahead

The Middle East and Africa region is gradually emerging in the joint compound market, currently holding about 5% of the global share. The growth is driven by increasing construction activities, particularly in the Gulf Cooperation Council (GCC) countries, where infrastructure projects are on the rise. Additionally, urbanization and a growing population are contributing to the demand for residential and commercial buildings. Leading countries in this region include the UAE and South Africa, where the market is characterized by a mix of local and international players. Companies are focusing on expanding their product offerings to cater to the unique needs of the region. The competitive landscape is evolving, with opportunities for growth as the construction sector continues to develop.

Key Players and Competitive Insights

The Joint Compound Market is currently characterized by a dynamic competitive landscape, driven by increasing demand for construction materials and a growing emphasis on sustainable building practices. Key players such as USG Corporation (US), CertainTeed Corporation (US), and Knauf Gips KG (DE) are strategically positioning themselves through innovation and regional expansion. USG Corporation (US) focuses on enhancing its product offerings with advanced formulations that improve performance and reduce environmental impact, while CertainTeed Corporation (US) emphasizes partnerships with contractors to promote its eco-friendly solutions. Knauf Gips KG (DE) is actively pursuing acquisitions to bolster its market presence, indicating a trend towards consolidation in the industry, which collectively shapes a competitive environment that is both innovative and responsive to market demands.

In terms of business tactics, companies are increasingly localizing manufacturing to reduce lead times and optimize supply chains. The Joint Compound Market appears moderately fragmented, with several key players exerting influence over regional markets. This fragmentation allows for niche players to thrive, yet the collective strength of major companies like National Gypsum Company (US) and Georgia-Pacific LLC (US) ensures that competition remains robust. These companies are leveraging their extensive distribution networks to enhance market penetration, thereby intensifying competitive pressures.

In August 2025, National Gypsum Company (US) announced the launch of a new line of low-VOC joint compounds aimed at environmentally conscious consumers. This strategic move not only aligns with the growing trend towards sustainability but also positions the company as a leader in eco-friendly construction materials. By addressing the increasing regulatory pressures and consumer preferences for greener products, National Gypsum Company (US) is likely to enhance its market share and brand loyalty.

In September 2025, Georgia-Pacific LLC (US) unveiled a digital platform designed to streamline the ordering process for contractors and builders. This initiative reflects a broader trend towards digital transformation within the industry, as companies seek to improve customer experience and operational efficiency. By investing in technology, Georgia-Pacific LLC (US) is not only enhancing its service offerings but also setting a precedent for competitors to follow, potentially reshaping customer expectations in the market.

In October 2025, Knauf Gips KG (DE) completed the acquisition of a regional joint compound manufacturer, which is expected to expand its production capabilities and market reach. This acquisition underscores the ongoing trend of consolidation within the Joint Compound Market, as companies seek to enhance their competitive positioning through strategic growth. By integrating local expertise and resources, Knauf Gips KG (DE) is likely to strengthen its supply chain and improve its responsiveness to regional market demands.

As of October 2025, the Joint Compound Market is witnessing significant trends such as digitalization, sustainability, and the integration of artificial intelligence in production processes. Strategic alliances are increasingly shaping the competitive landscape, as companies collaborate to leverage shared resources and expertise. Looking ahead, it appears that competitive differentiation will evolve from traditional price-based competition to a focus on innovation, technology adoption, and supply chain reliability. This shift may redefine market dynamics, compelling companies to invest in research and development to stay ahead in a rapidly changing environment.

Key Companies in the Joint Compound Market market include

Industry Developments

October 2023: ProForm Finishing Products launches environmentally friendly packaging for its joint compounds, demonstrating a commitment to sustainability without compromising quality. By introducing eco-friendly packaging, ProForm aims to provide a greener solution for the construction industry while maintaining its reputation for high-quality products.

September 2023: Saint-Gobain finalizes its acquisition of Building Products of Canada Corp., seamlessly integrating it into the CertainTeed building materials business within the Americas Region. The addition of Building Products of Canada enhances CertainTeed's Canadian operations, particularly in roofing materials. This strategic move strengthens CertainTeed's leadership position in Canada, with the acquisition contributed $435 million to its existing sales of $1.4 billion in the region.

Future Outlook

Joint Compound Market Future Outlook

<p>The Joint Compound Market is projected to grow at a 6.5% CAGR from 2024 to 2035, driven by increasing construction activities, technological advancements, and rising demand for eco-friendly products.</p>

New opportunities lie in:

  • <p>Expansion into emerging markets with tailored product offerings.</p>
  • <p>Development of sustainable joint compounds using recycled materials.</p>
  • <p>Integration of smart technology for real-time application monitoring.</p>

<p>By 2035, the market is expected to achieve robust growth, positioning itself as a leader in the construction materials sector.</p>

Market Segmentation

Joint Compound Market Type Outlook

  • Ready Mix
  • Setting Type
  • Drying Type

Joint Compound Market End Use Outlook

  • Residential Construction
  • Commercial Construction
  • Institutional Construction
  • Industrial Construction

Joint Compound Market Application Outlook

  • New Construction
  • Refurbishments

Report Scope

MARKET SIZE 20245.858(USD Billion)
MARKET SIZE 20256.238(USD Billion)
MARKET SIZE 203511.71(USD Billion)
COMPOUND ANNUAL GROWTH RATE (CAGR)6.5% (2024 - 2035)
REPORT COVERAGERevenue Forecast, Competitive Landscape, Growth Factors, and Trends
BASE YEAR2024
Market Forecast Period2025 - 2035
Historical Data2019 - 2024
Market Forecast UnitsUSD Billion
Key Companies ProfiledMarket analysis in progress
Segments CoveredMarket segmentation analysis in progress
Key Market OpportunitiesGrowing demand for eco-friendly joint compounds driven by sustainability trends and regulatory changes.
Key Market DynamicsRising demand for eco-friendly joint compounds drives innovation and competition among manufacturers in the market.
Countries CoveredNorth America, Europe, APAC, South America, MEA

FAQs

What is the current valuation of the Joint Compound Market as of 2024?

The Joint Compound Market was valued at 5.858 USD Billion in 2024.

What is the projected market size for the Joint Compound Market by 2035?

The market is projected to reach 11.71 USD Billion by 2035.

What is the expected CAGR for the Joint Compound Market during the forecast period 2025 - 2035?

The expected CAGR for the Joint Compound Market during 2025 - 2035 is 6.5%.

Which segment of the Joint Compound Market had the highest valuation in 2024?

In 2024, the Ready Mix segment had the highest valuation at 2.929 USD Billion.

How does the valuation of the Residential Construction segment compare to the Commercial Construction segment?

The Residential Construction segment was valued at 1.5 USD Billion, while the Commercial Construction segment was valued at 1.8 USD Billion in 2024.

What are the projected valuations for the Drying Type segment by 2035?

The Drying Type segment is projected to reach 2.57 USD Billion by 2035.

  1. SECTION I: EXECUTIVE SUMMARY AND KEY HIGHLIGHTS
    1. EXECUTIVE SUMMARY
      1. Market Overview
      2. Key Findings
      3. Market Segmentation
      4. Competitive Landscape
      5. Challenges and Opportunities
      6. Future Outlook
  2. SECTION II: SCOPING, METHODOLOGY AND MARKET STRUCTURE
    1. MARKET INTRODUCTION
      1. Definition
      2. Scope of the study
    2. RESEARCH METHODOLOGY
      1. Overview
      2. Data Mining
      3. Secondary Research
      4. Primary Research
      5. Forecasting Model
      6. Market Size Estimation
      7. Data Triangulation
      8. Validation
  3. SECTION III: QUALITATIVE ANALYSIS
    1. MARKET DYNAMICS
      1. Overview
      2. Drivers
      3. Restraints
      4. Opportunities
    2. MARKET FACTOR ANALYSIS
      1. Value chain Analysis
      2. Porter's Five Forces Analysis
      3. COVID-19 Impact Analysis
  4. SECTION IV: QUANTITATIVE ANALYSIS
    1. Chemicals and Materials, BY Type (USD Billion)
      1. Ready Mix
      2. Setting Type
      3. Drying Type
    2. Chemicals and Materials, BY End Use (USD Billion)
      1. Residential Construction
      2. Commercial Construction
      3. Institutional Construction
      4. Industrial Construction
    3. Chemicals and Materials, BY Application (USD Billion)
      1. New Construction
      2. Refurbishments
    4. Chemicals and Materials, BY Region (USD Billion)
      1. North America
      2. Europe
      3. APAC
      4. South America
      5. MEA
  5. SECTION V: COMPETITIVE ANALYSIS
    1. Competitive Landscape
      1. Overview
      2. Competitive Analysis
      3. Market share Analysis
      4. Major Growth Strategy in the Chemicals and Materials
      5. Competitive Benchmarking
      6. Leading Players in Terms of Number of Developments in the Chemicals and Materials
      7. Key developments and growth strategies
      8. Major Players Financial Matrix
    2. Company Profiles
      1. USG Corporation (US)
      2. CertainTeed Corporation (US)
      3. National Gypsum Company (US)
      4. Georgia-Pacific LLC (US)
      5. Knauf Gips KG (DE)
      6. Saint-Gobain (FR)
      7. Boral Limited (AU)
      8. LafargeHolcim (CH)
      9. Armstrong World Industries (US)
    3. Appendix
      1. References
      2. Related Reports
  6. LIST OF FIGURES
    1. MARKET SYNOPSIS
    2. NORTH AMERICA MARKET ANALYSIS
    3. US MARKET ANALYSIS BY TYPE
    4. US MARKET ANALYSIS BY END USE
    5. US MARKET ANALYSIS BY APPLICATION
    6. CANADA MARKET ANALYSIS BY TYPE
    7. CANADA MARKET ANALYSIS BY END USE
    8. CANADA MARKET ANALYSIS BY APPLICATION
    9. EUROPE MARKET ANALYSIS
    10. GERMANY MARKET ANALYSIS BY TYPE
    11. GERMANY MARKET ANALYSIS BY END USE
    12. GERMANY MARKET ANALYSIS BY APPLICATION
    13. UK MARKET ANALYSIS BY TYPE
    14. UK MARKET ANALYSIS BY END USE
    15. UK MARKET ANALYSIS BY APPLICATION
    16. FRANCE MARKET ANALYSIS BY TYPE
    17. FRANCE MARKET ANALYSIS BY END USE
    18. FRANCE MARKET ANALYSIS BY APPLICATION
    19. RUSSIA MARKET ANALYSIS BY TYPE
    20. RUSSIA MARKET ANALYSIS BY END USE
    21. RUSSIA MARKET ANALYSIS BY APPLICATION
    22. ITALY MARKET ANALYSIS BY TYPE
    23. ITALY MARKET ANALYSIS BY END USE
    24. ITALY MARKET ANALYSIS BY APPLICATION
    25. SPAIN MARKET ANALYSIS BY TYPE
    26. SPAIN MARKET ANALYSIS BY END USE
    27. SPAIN MARKET ANALYSIS BY APPLICATION
    28. REST OF EUROPE MARKET ANALYSIS BY TYPE
    29. REST OF EUROPE MARKET ANALYSIS BY END USE
    30. REST OF EUROPE MARKET ANALYSIS BY APPLICATION
    31. APAC MARKET ANALYSIS
    32. CHINA MARKET ANALYSIS BY TYPE
    33. CHINA MARKET ANALYSIS BY END USE
    34. CHINA MARKET ANALYSIS BY APPLICATION
    35. INDIA MARKET ANALYSIS BY TYPE
    36. INDIA MARKET ANALYSIS BY END USE
    37. INDIA MARKET ANALYSIS BY APPLICATION
    38. JAPAN MARKET ANALYSIS BY TYPE
    39. JAPAN MARKET ANALYSIS BY END USE
    40. JAPAN MARKET ANALYSIS BY APPLICATION
    41. SOUTH KOREA MARKET ANALYSIS BY TYPE
    42. SOUTH KOREA MARKET ANALYSIS BY END USE
    43. SOUTH KOREA MARKET ANALYSIS BY APPLICATION
    44. MALAYSIA MARKET ANALYSIS BY TYPE
    45. MALAYSIA MARKET ANALYSIS BY END USE
    46. MALAYSIA MARKET ANALYSIS BY APPLICATION
    47. THAILAND MARKET ANALYSIS BY TYPE
    48. THAILAND MARKET ANALYSIS BY END USE
    49. THAILAND MARKET ANALYSIS BY APPLICATION
    50. INDONESIA MARKET ANALYSIS BY TYPE
    51. INDONESIA MARKET ANALYSIS BY END USE
    52. INDONESIA MARKET ANALYSIS BY APPLICATION
    53. REST OF APAC MARKET ANALYSIS BY TYPE
    54. REST OF APAC MARKET ANALYSIS BY END USE
    55. REST OF APAC MARKET ANALYSIS BY APPLICATION
    56. SOUTH AMERICA MARKET ANALYSIS
    57. BRAZIL MARKET ANALYSIS BY TYPE
    58. BRAZIL MARKET ANALYSIS BY END USE
    59. BRAZIL MARKET ANALYSIS BY APPLICATION
    60. MEXICO MARKET ANALYSIS BY TYPE
    61. MEXICO MARKET ANALYSIS BY END USE
    62. MEXICO MARKET ANALYSIS BY APPLICATION
    63. ARGENTINA MARKET ANALYSIS BY TYPE
    64. ARGENTINA MARKET ANALYSIS BY END USE
    65. ARGENTINA MARKET ANALYSIS BY APPLICATION
    66. REST OF SOUTH AMERICA MARKET ANALYSIS BY TYPE
    67. REST OF SOUTH AMERICA MARKET ANALYSIS BY END USE
    68. REST OF SOUTH AMERICA MARKET ANALYSIS BY APPLICATION
    69. MEA MARKET ANALYSIS
    70. GCC COUNTRIES MARKET ANALYSIS BY TYPE
    71. GCC COUNTRIES MARKET ANALYSIS BY END USE
    72. GCC COUNTRIES MARKET ANALYSIS BY APPLICATION
    73. SOUTH AFRICA MARKET ANALYSIS BY TYPE
    74. SOUTH AFRICA MARKET ANALYSIS BY END USE
    75. SOUTH AFRICA MARKET ANALYSIS BY APPLICATION
    76. REST OF MEA MARKET ANALYSIS BY TYPE
    77. REST OF MEA MARKET ANALYSIS BY END USE
    78. REST OF MEA MARKET ANALYSIS BY APPLICATION
    79. KEY BUYING CRITERIA OF CHEMICALS AND MATERIALS
    80. RESEARCH PROCESS OF MRFR
    81. DRO ANALYSIS OF CHEMICALS AND MATERIALS
    82. DRIVERS IMPACT ANALYSIS: CHEMICALS AND MATERIALS
    83. RESTRAINTS IMPACT ANALYSIS: CHEMICALS AND MATERIALS
    84. SUPPLY / VALUE CHAIN: CHEMICALS AND MATERIALS
    85. CHEMICALS AND MATERIALS, BY TYPE, 2024 (% SHARE)
    86. CHEMICALS AND MATERIALS, BY TYPE, 2024 TO 2035 (USD Billion)
    87. CHEMICALS AND MATERIALS, BY END USE, 2024 (% SHARE)
    88. CHEMICALS AND MATERIALS, BY END USE, 2024 TO 2035 (USD Billion)
    89. CHEMICALS AND MATERIALS, BY APPLICATION, 2024 (% SHARE)
    90. CHEMICALS AND MATERIALS, BY APPLICATION, 2024 TO 2035 (USD Billion)
    91. BENCHMARKING OF MAJOR COMPETITORS
  7. LIST OF TABLES
    1. LIST OF ASSUMPTIONS
    2. North America MARKET SIZE ESTIMATES; FORECAST
      1. BY TYPE, 2025-2035 (USD Billion)
      2. BY END USE, 2025-2035 (USD Billion)
      3. BY APPLICATION, 2025-2035 (USD Billion)
    3. US MARKET SIZE ESTIMATES; FORECAST
      1. BY TYPE, 2025-2035 (USD Billion)
      2. BY END USE, 2025-2035 (USD Billion)
      3. BY APPLICATION, 2025-2035 (USD Billion)
    4. Canada MARKET SIZE ESTIMATES; FORECAST
      1. BY TYPE, 2025-2035 (USD Billion)
      2. BY END USE, 2025-2035 (USD Billion)
      3. BY APPLICATION, 2025-2035 (USD Billion)
    5. Europe MARKET SIZE ESTIMATES; FORECAST
      1. BY TYPE, 2025-2035 (USD Billion)
      2. BY END USE, 2025-2035 (USD Billion)
      3. BY APPLICATION, 2025-2035 (USD Billion)
    6. Germany MARKET SIZE ESTIMATES; FORECAST
      1. BY TYPE, 2025-2035 (USD Billion)
      2. BY END USE, 2025-2035 (USD Billion)
      3. BY APPLICATION, 2025-2035 (USD Billion)
    7. UK MARKET SIZE ESTIMATES; FORECAST
      1. BY TYPE, 2025-2035 (USD Billion)
      2. BY END USE, 2025-2035 (USD Billion)
      3. BY APPLICATION, 2025-2035 (USD Billion)
    8. France MARKET SIZE ESTIMATES; FORECAST
      1. BY TYPE, 2025-2035 (USD Billion)
      2. BY END USE, 2025-2035 (USD Billion)
      3. BY APPLICATION, 2025-2035 (USD Billion)
    9. Russia MARKET SIZE ESTIMATES; FORECAST
      1. BY TYPE, 2025-2035 (USD Billion)
      2. BY END USE, 2025-2035 (USD Billion)
      3. BY APPLICATION, 2025-2035 (USD Billion)
    10. Italy MARKET SIZE ESTIMATES; FORECAST
      1. BY TYPE, 2025-2035 (USD Billion)
      2. BY END USE, 2025-2035 (USD Billion)
      3. BY APPLICATION, 2025-2035 (USD Billion)
    11. Spain MARKET SIZE ESTIMATES; FORECAST
      1. BY TYPE, 2025-2035 (USD Billion)
      2. BY END USE, 2025-2035 (USD Billion)
      3. BY APPLICATION, 2025-2035 (USD Billion)
    12. Rest of Europe MARKET SIZE ESTIMATES; FORECAST
      1. BY TYPE, 2025-2035 (USD Billion)
      2. BY END USE, 2025-2035 (USD Billion)
      3. BY APPLICATION, 2025-2035 (USD Billion)
    13. APAC MARKET SIZE ESTIMATES; FORECAST
      1. BY TYPE, 2025-2035 (USD Billion)
      2. BY END USE, 2025-2035 (USD Billion)
      3. BY APPLICATION, 2025-2035 (USD Billion)
    14. China MARKET SIZE ESTIMATES; FORECAST
      1. BY TYPE, 2025-2035 (USD Billion)
      2. BY END USE, 2025-2035 (USD Billion)
      3. BY APPLICATION, 2025-2035 (USD Billion)
    15. India MARKET SIZE ESTIMATES; FORECAST
      1. BY TYPE, 2025-2035 (USD Billion)
      2. BY END USE, 2025-2035 (USD Billion)
      3. BY APPLICATION, 2025-2035 (USD Billion)
    16. Japan MARKET SIZE ESTIMATES; FORECAST
      1. BY TYPE, 2025-2035 (USD Billion)
      2. BY END USE, 2025-2035 (USD Billion)
      3. BY APPLICATION, 2025-2035 (USD Billion)
    17. South Korea MARKET SIZE ESTIMATES; FORECAST
      1. BY TYPE, 2025-2035 (USD Billion)
      2. BY END USE, 2025-2035 (USD Billion)
      3. BY APPLICATION, 2025-2035 (USD Billion)
    18. Malaysia MARKET SIZE ESTIMATES; FORECAST
      1. BY TYPE, 2025-2035 (USD Billion)
      2. BY END USE, 2025-2035 (USD Billion)
      3. BY APPLICATION, 2025-2035 (USD Billion)
    19. Thailand MARKET SIZE ESTIMATES; FORECAST
      1. BY TYPE, 2025-2035 (USD Billion)
      2. BY END USE, 2025-2035 (USD Billion)
      3. BY APPLICATION, 2025-2035 (USD Billion)
    20. Indonesia MARKET SIZE ESTIMATES; FORECAST
      1. BY TYPE, 2025-2035 (USD Billion)
      2. BY END USE, 2025-2035 (USD Billion)
      3. BY APPLICATION, 2025-2035 (USD Billion)
    21. Rest of APAC MARKET SIZE ESTIMATES; FORECAST
      1. BY TYPE, 2025-2035 (USD Billion)
      2. BY END USE, 2025-2035 (USD Billion)
      3. BY APPLICATION, 2025-2035 (USD Billion)
    22. South America MARKET SIZE ESTIMATES; FORECAST
      1. BY TYPE, 2025-2035 (USD Billion)
      2. BY END USE, 2025-2035 (USD Billion)
      3. BY APPLICATION, 2025-2035 (USD Billion)
    23. Brazil MARKET SIZE ESTIMATES; FORECAST
      1. BY TYPE, 2025-2035 (USD Billion)
      2. BY END USE, 2025-2035 (USD Billion)
      3. BY APPLICATION, 2025-2035 (USD Billion)
    24. Mexico MARKET SIZE ESTIMATES; FORECAST
      1. BY TYPE, 2025-2035 (USD Billion)
      2. BY END USE, 2025-2035 (USD Billion)
      3. BY APPLICATION, 2025-2035 (USD Billion)
    25. Argentina MARKET SIZE ESTIMATES; FORECAST
      1. BY TYPE, 2025-2035 (USD Billion)
      2. BY END USE, 2025-2035 (USD Billion)
      3. BY APPLICATION, 2025-2035 (USD Billion)
    26. Rest of South America MARKET SIZE ESTIMATES; FORECAST
      1. BY TYPE, 2025-2035 (USD Billion)
      2. BY END USE, 2025-2035 (USD Billion)
      3. BY APPLICATION, 2025-2035 (USD Billion)
    27. MEA MARKET SIZE ESTIMATES; FORECAST
      1. BY TYPE, 2025-2035 (USD Billion)
      2. BY END USE, 2025-2035 (USD Billion)
      3. BY APPLICATION, 2025-2035 (USD Billion)
    28. GCC Countries MARKET SIZE ESTIMATES; FORECAST
      1. BY TYPE, 2025-2035 (USD Billion)
      2. BY END USE, 2025-2035 (USD Billion)
      3. BY APPLICATION, 2025-2035 (USD Billion)
    29. South Africa MARKET SIZE ESTIMATES; FORECAST
      1. BY TYPE, 2025-2035 (USD Billion)
      2. BY END USE, 2025-2035 (USD Billion)
      3. BY APPLICATION, 2025-2035 (USD Billion)
    30. Rest of MEA MARKET SIZE ESTIMATES; FORECAST
      1. BY TYPE, 2025-2035 (USD Billion)
      2. BY END USE, 2025-2035 (USD Billion)
      3. BY APPLICATION, 2025-2035 (USD Billion)
    31. PRODUCT LAUNCH/PRODUCT DEVELOPMENT/APPROVAL
    32. ACQUISITION/PARTNERSHIP

Joint Compound Market Segmentation

Joint Compound Masks Product Type Outlook (USD Billion, 2018-2032)

  • Ready Mix
  • Setting Type
  • Drying Type

Joint Compound Masks End Use Outlook (USD Billion, 2018-2032)

  • Residential Construction
  • Commercial Construction
  • Institutional Construction
  • Industrial Construction

Joint Compound Masks Application Outlook (USD Billion, 2018-2032)

  • New Construction
  • Refurbishment

Joint Compound Masks Regional Outlook (USD Billion, 2018-2032)

  • North America Outlook (USD Billion, 2018-2032)

    • North America Joint Compound Masks by Product Type
      • Ready Mix
      • Setting Type
      • Drying Type
    • North America Joint Compound Masks by End Use
      • Residential Construction
      • Commercial Construction
    • North America Joint Compound Masks by Application
      • New Construction
      • Refurbishment
    • US Outlook (USD Billion, 2018-2032)

    • US Joint Compound Masks by Product Type
      • Ready Mix
      • Setting Type
      • Drying Type
    • US Joint Compound Masks by End Use
      • Residential Construction
      • Commercial Construction
      • Institutional Construction
      • Industrial Construction
    • US Joint Compound Masks by Application
      • New Construction
      • Refurbishment
    • CANADA Outlook (USD Billion, 2018-2032)

    • CANADA Joint Compound Masks by Product Type
      • Ready Mix
      • Setting Type
      • Drying Type
    • CANADA Joint Compound Masks by End Use
      • Residential Construction
      • Commercial Construction
      • Institutional Construction
      • Industrial Construction
    • CANADA Joint Compound Masks by Application
      • New Construction
      • Refurbishment
  • Europe Outlook (USD Billion, 2018-2032)

    • Europe Joint Compound Masks by Product Type
      • Ready Mix
      • Setting Type
      • Drying Type
    • Europe Joint Compound Masks by End Use
      • Residential Construction
      • Commercial Construction
      • Institutional Construction
      • Industrial Construction
    • Europe Joint Compound Masks by Application
      • New Construction
      • Refurbishment
    • Germany Outlook (USD Billion, 2018-2032)

    • Germany Joint Compound Masks by Product Type
      • Ready Mix
      • Setting Type
      • Drying Type
    • Germany Joint Compound Masks by End Use
      • Residential Construction
      • Commercial Construction
      • Institutional Construction
      • Industrial Construction
    • Germany Joint Compound Masks by Application
      • New Construction
      • Refurbishment
    • France Outlook (USD Billion, 2018-2032)

    • France Joint Compound Masks by Product Type
      • Ready Mix
      • Setting Type
      • Drying Type
    • France Joint Compound Masks by End Use
      • Residential Construction
      • Commercial Construction
      • Institutional Construction
      • Industrial Construction
    • France Joint Compound Masks by Application
      • New Construction
      • Refurbishment
    • UK Outlook (USD Billion, 2018-2032)

    • UK Joint Compound Masks by Product Type
      • Ready Mix
      • Setting Type
      • Drying Type
    • UK Joint Compound Masks by End Use
      • Residential Construction
      • Commercial Construction
      • Institutional Construction
      • Industrial Construction
    • UK Joint Compound Masks by Application
      • New Construction
      • Refurbishment
    • ITALY Outlook (USD Billion, 2018-2032)

    • ITALY Joint Compound Masks by Product Type
      • Ready Mix
      • Setting Type
      • Drying Type
    • ITALY Joint Compound Masks by End Use
      • Residential Construction
      • Commercial Construction
      • Institutional Construction
      • Industrial Construction
    • ITALY Joint Compound Masks by Application
      • New Construction
      • Refurbishment
    • SPAIN Outlook (USD Billion, 2018-2032)

    • Spain Joint Compound Masks by Product Type
      • Ready Mix
      • Setting Type
      • Drying Type
    • Spain Joint Compound Masks by End Use
      • Residential Construction
      • Commercial Construction
      • Institutional Construction
      • Industrial Construction
    • Spain Joint Compound Masks by Application
      • New Construction
      • Refurbishment
    • Rest Of Europe Outlook (USD Billion, 2018-2032)

    • Rest Of Europe Joint Compound Masks by Product Type
      • Ready Mix
      • Setting Type
      • Drying Type
    • REST OF EUROPE Joint Compound Masks by End Use
      • Residential Construction
      • Commercial Construction
      • Institutional Construction
      • Industrial Construction
    • REST OF EUROPE Joint Compound Masks by Application
      • New Construction
      • Refurbishment
  • Asia-Pacific Outlook (USD Billion, 2018-2032)

    • Asia-Pacific Joint Compound Masks by Product Type
      • Ready Mix
      • Setting Type
      • Drying Type
    • Asia-Pacific Joint Compound Masks by End Use
      • Residential Construction
      • Commercial Construction
      • Institutional Construction
      • Industrial Construction
    • Asia-Pacific Joint Compound Masks by Application
      • New Construction
      • Refurbishment
    • China Outlook (USD Billion, 2018-2032)

    • China Joint Compound Masks by Product Type
      • Ready Mix
      • Setting Type
      • Drying Type
    • China Joint Compound Masks by End Use
      • Residential Construction
      • Commercial Construction
      • Institutional Construction
      • Industrial Construction
    • China Joint Compound Masks by Application
      • New Construction
      • Refurbishment
    • Japan Outlook (USD Billion, 2018-2032)

    • Japan Joint Compound Masks by Product Type
      • Ready Mix
      • Setting Type
      • Drying Type
    • Japan Joint Compound Masks by End Use
      • Residential Construction
      • Commercial Construction
      • Institutional Construction
      • Industrial Construction
    • Japan Joint Compound Masks by Application
      • New Construction
      • Refurbishment
    • India Outlook (USD Billion, 2018-2032)

    • India Joint Compound Masks by Product Type
      • Ready Mix
      • Setting Type
      • Drying Type
    • India Joint Compound Masks by End Use
      • Residential Construction
      • Commercial Construction
      • Institutional Construction
      • Industrial Construction
    • India Joint Compound Masks by Application
      • New Construction
      • Refurbishment
    • Australia Outlook (USD Billion, 2018-2032)

    • Australia Joint Compound Masks by Product Type
      • Ready Mix
      • Setting Type
      • Drying Type
    • Australia Joint Compound Masks by End Use
      • Residential Construction
      • Commercial Construction
      • Institutional Construction
      • Industrial Construction
    • Australia Joint Compound Masks by Application
      • New Construction
      • Refurbishment
    • Rest of Asia-Pacific Outlook (USD Billion, 2018-2032)

    • Rest of Asia-Pacific Joint Compound Masks by Product Type
      • Ready Mix
      • Setting Type
      • Drying Type
    • Rest of Asia-Pacific Joint Compound Masks by End Use
      • Residential Construction
      • Commercial Construction
      • Institutional Construction
      • Industrial Construction
    • Rest of Asia-Pacific Joint Compound Masks by Application
      • New Construction
      • Refurbishment
  • Rest of the World Outlook (USD Billion, 2018-2032)

    • Rest of the World Joint Compound Masks by Product Type
      • Ready Mix
      • Setting Type
      • Drying Type
    • Rest of the World Joint Compound Masks by End Use
      • Residential Construction
      • Commercial Construction
      • Institutional Construction
      • Industrial Construction
    • Rest of World Joint Compound Masks by Application
      • New Construction
      • Refurbishment
    • Middle East Outlook (USD Billion, 2018-2032)

    • Middle East Joint Compound Masks by Product Type
      • Ready Mix
      • Setting Type
      • Drying Type
    • Middle East Joint Compound Masks by End Use
      • Residential Construction
      • Commercial Construction
      • Institutional Construction
      • Industrial Construction
    • Middle East Joint Compound Masks by Application
      • New Construction
      • Refurbishment
    • Africa Outlook (USD Billion, 2018-2032)

    • Africa Joint Compound Masks by Product Type
      • Ready Mix
      • Setting Type
      • Drying Type
    • Africa Joint Compound Masks by End Use
      • Residential Construction
      • Commercial Construction
      • Institutional Construction
      • Industrial Construction
    • Africa Joint Compound Masks by Application
      • New Construction
      • Refurbishment
    • Latin America Outlook (USD Billion, 2018-2032)

    • Latin America Joint Compound Masks by Product Type
      • Ready Mix
      • Setting Type
      • Drying Type
    • Latin America Joint Compound Masks by End Use
      • Residential Construction
      • Commercial Construction
      • Institutional Construction
      • Industrial Construction
    • Latin America Joint Compound Masks by Application
      • New Construction
      • Refurbishment
Infographic

Free Sample Request

Kindly complete the form below to receive a free sample of this Report

Get Free Sample

Customer Strories

“I am very pleased with how market segments have been defined in a relevant way for my purposes (such as "Portable Freezers & refrigerators" and "last-mile"). In general the report is well structured. Thanks very much for your efforts.”

Victoria Milne

Founder

Compare Licence

×
Features License Type
Single User Multiuser License Enterprise User
Price $4,950 $5,950 $7,250
Maximum User Access Limit 1 User Upto 10 Users Unrestricted Access Throughout the Organization
Free Customization
Direct Access to Analyst
Deliverable Format
Platform Access
Discount on Next Purchase 10% 15% 15%
Printable Versions