• Cat-intel
  • MedIntelliX
  • Resources
  • About Us
  • Hero Background
    English
    Chinese
    French
    Japanese
    Korean
    German
    Spanish

    Light olefin market Share

    ID: MRFR/CnM/0531-CR
    115 Pages
    Anshula Mandaokar
    February 2021

    Light Olefins Market Research Report Information: By Type (Ethylene, Propylene), Derivatives (Polypropylene, Propylene Oxide, Acrylonitrile, Cumene, Acrylic Acid, Oxo Alcohols, Polyethylene), Application (Chemical Commodities, Refinery), And By Region – Forecast Till 2035

    Share:
    Download PDF ×

    We do not share your information with anyone. However, we may send you emails based on your report interest from time to time. You may contact us at any time to opt-out.

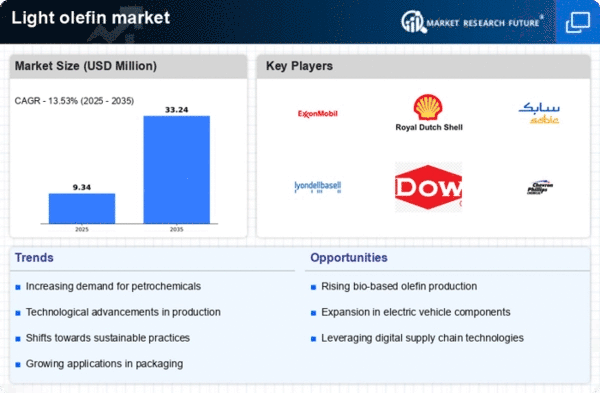
    Light olefin market Infographic
    $ 4,950.0
    $ 5,950.0
    $ 7,250.0

    Market Share

    Light olefin market Share Analysis

    The emergence of shale gas presents abundant opportunities as a viable alternative to oil, unlocking significant potential for countries heavily invested in shale gas development to enhance their global competitiveness. Prominent among these nations are the United States, China, and Canada, where shale gas development has become a transformative force, reshaping energy dynamics. In particular, the United States has experienced a paradigm shift with shale gas development emerging as a game-changing phenomenon. This transformative process involves tapping into previously untapped shale gas deposits and actively developing several others. The result is a substantial addition to the fuel supply, and notably, at a comparatively lower cost. This development positions the United States strategically, providing an advantageous opportunity to engage in international trade with Asian and European countries, offering shale gas derived from ethylene. The significance of this trade lies in its potential to establish long-term contractual agreements, fostering stable and mutually beneficial relationships. By offering shale gas at a competitive price, the U.S. can reduce its reliance on traditional crude oil exports. The competitive pricing, made possible by the abundance of shale gas, enhances the feasibility of establishing enduring trade partnerships with nations across Asia and Europe. Reducing dependency on crude oil has far-reaching implications for the United States, offering both economic and strategic advantages. The diversification of energy sources, with a focus on shale gas, contributes to energy security by mitigating the risks associated with overreliance on a single resource. Additionally, the affordability of shale gas positions the U.S. favorably in the global energy market, creating avenues for sustained economic growth and competitiveness. The shale gas boom, particularly in the United States, opens up unprecedented opportunities for global energy trade. By leveraging shale gas derived from ethylene, the U.S. can establish itself as a key player in the international market, offering a cost-effective and strategically valuable alternative to crude oil. This not only transforms the energy landscape but also provides a platform for long-term collaboration and reduced dependence on conventional energy sources.

    Market Summary

    As per Market Research Future Analysis, the global light olefins market is projected to generate revenue exceeding USD 475.8 million by 2030, with a CAGR of 5.58%. Light olefins are produced through hydrocracking of hydrocarbons, utilizing raw materials such as ethane, naphtha, propane, biomass, and butane. The market is driven by the rising demand for green tires and synthetic rubber, alongside a shift from traditional materials to light olefins due to cost-effectiveness. The COVID-19 pandemic initially hindered growth, but recovery is anticipated as demand for eco-friendly products increases. Key players include Royal Dutch Shell, Reliance Industries, and DowDuPont, among others.

    Key Market Trends & Highlights

    The light olefins market is witnessing significant growth driven by environmental concerns and technological advancements.

    • Market revenue expected to exceed USD 475.8 million by 2030.
    • CAGR of 5.58% projected until 2030.
    • Increased demand for green tires and synthetic rubber due to environmental regulations.
    • Asia-Pacific dominates the market, driven by e-commerce growth in China, Japan, and India.

    Market Size & Forecast

    Market Size USD 475.8 million by 2030
    CAGR 5.58%
    Dominant Region Asia-Pacific
    Key Drivers Demand for green tires and synthetic rubber

    Major Players

    Royal Dutch Shell (Netherlands), Reliance Industries Limited (India), Honeywell International Inc. (U.S.), DowDuPont (U.S.), Gazprom (Russian Federation), BASF SE (Germany), PetroChina (China), China Petro & Chemical Corp (China), Exxon Mobil Corporation (U.S.), Saudi Arabian Oil Co. (Saudi Arabia)

    Market Trends

    The Global Light Olefins Market is poised for expansion, driven by increasing demand in the petrochemical sector and advancements in production technologies.

    U.S. Energy Information Administration

    Light olefin market Market Drivers

    Market Growth Projections

    The Global Light Olefins Market Industry is projected to experience substantial growth over the coming years. With a market value expected to reach 321.2 USD Million in 2024 and further expand to 624.2 USD Million by 2035, the industry is poised for a robust trajectory. The anticipated compound annual growth rate of 6.23% from 2025 to 2035 reflects the increasing demand for light olefins across various sectors. This growth is underpinned by technological advancements, expanding applications, and supportive regulatory frameworks that collectively enhance the market's potential.

    Expansion of End-Use Industries

    The expansion of end-use industries such as packaging, textiles, and consumer goods is a key driver for the Global Light Olefins Market Industry. As these sectors grow, the demand for light olefins, particularly ethylene and propylene, is expected to rise correspondingly. The versatility of light olefins in producing various materials, including films, fibers, and containers, positions them as essential raw materials in these industries. This growth trajectory is likely to be supported by increasing consumer preferences for sustainable and recyclable products, further enhancing the market's potential. The ongoing expansion of these industries is anticipated to significantly contribute to the overall market dynamics.

    Rising Demand for Petrochemicals

    The Global Light Olefins Market Industry is experiencing a surge in demand for petrochemicals, driven by their extensive applications in various sectors such as automotive, construction, and consumer goods. As industries increasingly rely on light olefins for the production of plastics and synthetic fibers, the market is projected to reach 321.2 USD Million in 2024. This growth is indicative of the broader trend towards lightweight materials that enhance fuel efficiency and reduce emissions, aligning with global sustainability goals. The increasing adoption of light olefins in manufacturing processes is likely to further bolster market expansion.

    Technological Advancements in Production

    Technological innovations in the production of light olefins are significantly influencing the Global Light Olefins Market Industry. Advanced catalytic processes and improved cracking technologies enhance yield and reduce production costs. For instance, the development of more efficient steam cracking methods allows for higher output of ethylene and propylene, which are key components in various chemical products. These advancements not only improve profitability for manufacturers but also contribute to meeting the growing global demand. As a result, the market is expected to witness a compound annual growth rate of 6.23% from 2025 to 2035, reflecting the positive impact of these technological improvements.

    Growing Applications in Automotive Sector

    The automotive sector is increasingly adopting light olefins for the production of lightweight materials, which are essential for enhancing fuel efficiency and reducing carbon emissions. The Global Light Olefins Market Industry benefits from this trend, as manufacturers seek to incorporate materials derived from light olefins into vehicle components. This shift is driven by stringent regulations aimed at reducing environmental impact, prompting automakers to innovate. As the automotive industry evolves, the demand for light olefins is likely to escalate, contributing to the projected market growth to 624.2 USD Million by 2035. This trend underscores the pivotal role of light olefins in sustainable automotive manufacturing.

    Regulatory Support for Sustainable Practices

    Regulatory frameworks promoting sustainable practices are increasingly shaping the Global Light Olefins Market Industry. Governments worldwide are implementing policies that encourage the use of environmentally friendly materials and processes, which often include light olefins. These regulations aim to reduce carbon footprints and promote recycling, thereby enhancing the appeal of light olefins in various applications. As industries adapt to these regulations, the demand for light olefins is expected to rise, aligning with global sustainability initiatives. This supportive regulatory environment is likely to drive market growth, as companies seek to comply with evolving standards and consumer expectations.

    Market Segment Insights

    Regional Insights

    Key Companies in the Light olefin market market include

    Industry Developments

    August 2021- Lummus Technology has disclosed that the start-up of company’s CDAlky alkylation unit located at Zhejiang Petroleum & Chemical Co. Ltd's refinery in Zhejiang Province, China. The latest facility will have a capacity of over 45 000 bpsd of alkylate product, resulting it to be the largest alkylation unit across the globe certified by Lummus.The latest alkylation unit deals with C4s from upstream refining and petrochemical units, causing an extremely high isobutylene concentration in the net olefins mixture while manufacturing a greater alkylate quality.

    October 2021- Siemens Energy and Technip Energies have announced the signing of an exclusive contract to collaboratively build, commercialize, and license the Rotating Olefins Cracker (ROC) technology to make the olefin production process carbon-free. The ROC technology uses a dynamic reactor system, which replaces traditional furnaces used for pyrolysis while producing light olefins- the raw material for chemical products used in everyday materials.

    November 2021- The Board of Reliance Industries Ltd (RIL) has planned to deploy a Scheme of Arrangement to turn over Gasification Enterprise into a Wholly Owned Subsidiary (WOS). The Jamnagar Gasification project was established to manufacture syngas to fulfill the needs as refinery off-gases that catered as fuel in the past were redesigned into feedstock for the Refinery Off Gas Cracker (ROGC). The company stated that this deployment allows olefins manufacturing at competitive capital and operating costs. The statement further revealed that Syngas as a fuel guarantees supply reliability and aid lower volatility in the energy costs.

    In 2018, Exxon Mobil collaborated with Saudi Basic Industries Corporation (SABIC) to build the world’s largest plant for ethylene production. This collaboration was more than 1.4 billion US dollars of worth. 

    In June 2018, a Cumene unit was built in Germany by a leading light olefin market player i.e. INEOS Phenol (UK) to maintain continuity between customer's demand and supply. This construction helped the company's plants in Gladbeck and Antwerp to improve the security of this supply and demand by the year 2020. 

    Future Outlook

    Light olefin market Future Outlook

    The Global Light Olefins Market is projected to grow at a 6.23% CAGR from 2024 to 2035, driven by rising demand in petrochemicals, automotive, and packaging industries.

    New opportunities lie in:

    • Invest in advanced catalytic technologies to enhance production efficiency.
    • Develop bio-based light olefins to meet sustainability targets.
    • Expand into emerging markets with tailored product offerings.

    By 2035, the market is expected to achieve substantial growth, solidifying its position as a key player in the chemical industry.

    Market Segmentation

    Report Overview:

    Report Scope

    Attribute/Metric Details
      Market Size   2030 : 475.8 million
      CAGR   2030 : 5.58%
      Base Year   2021
      Forecast Period   2022 to 2030
      Historical Data   2019 & 2020
      Forecast Units    Value (USD Million)
      Report Coverage   Revenue Forecast, Competitive Landscape, Growth Factors, and Trends
      Segments Covered   By Type, Derivatives, Application and Region
      Geographies Covered   North America, Europe, Asia-Pacific, and Rest of the World (RoW)
      Key Vendors   Royal Dutch Shell (Netherlands), Reliance Industries Limited (India), Honeywell International Inc. (U.S.), DowDuPont (U.S.), Gazprom (Russian Federation), BASF SE (Germany), PetroChina (China), China Petro & Chemical Corp (China), Exxon Mobil Corporation (U.S.), and Saudi Arabian Oil Co. (Saudi Arabia).
      Key Market Opportunities   Increase in demand for products that help in the reduction of gases like nitrogen dioxide, coke, and carbon dioxide.
      Key Market Drivers   Rise in demand for synthetic rubber to produce green tires and their coating.

    Market Highlights

    Author

    Anshula Mandaokar
    Team Lead - Research

    She holds an experience of about 6+ years in market research and business consulting, working under the spectrum of information communication technology, telecommunications and semiconductor domains. aarti conceptualizes and implements a scalable business strategy and provides strategic leadership to the clients. her expertise lies in market estimation, competitive intelligence, pipeline analysis, customer assessment, etc.

    Leave a Comment

    Latest Comments

    John Doe
    john@example.com

    This is a great article! Really helped me understand the topic better.

    Posted on July 23, 2025, 10:15 AM
    Jane Smith
    jane@domain.com

    Thanks for sharing this. I’ve bookmarked it for later reference.

    Posted on July 22, 2025, 7:45 PM

    FAQs

    What is the expected CAGR of the light olefins market?

    The global light olefins market is expected to register a CAGR of 5.58% by the forecast year 2030

    How is the light olefins market segmented by derivatives?

    The light olefins market is segmented by derivatives as propylene oxide, cumene, acetate monomer, oxo alcohols, ethylene oxide, EDC/ VCM/ PVC, alpha-olefins, polypropylene, acrylonitrile, acrylic acid, polyethylene, glycol, and styrene.

    Who is the market-dominant of the global light olefins market?

    Asia-Pacific is the market-dominant of the global light olefins market.

    1. Report Prologue
    2. Scope Of The Report
      1. Market Definition 17
      2. The Scope of the Study 17
        1. Research Objectives 17
        2. Assumptions 17
        3. Limitations 17
      3. Market Structure 18
    3. Research Methodology
      1. Research Process 21
      2. Primary Research 21
      3. Secondary Research 21
      4. Market Size Estimation 22
      5. Forecast Model 23
    4. Market Dynamics
      1. Introduction 25
      2. Drivers 26
        1. Increasing Demand For Polymer 26
        2. Excellent Conversion Of Light Olefins From Methanol 27
      3. Restraint 28
        1. Ethylene Exposure To Air Affects The Environment 28
      4. Opportunity 29
        1. Shale Gas Development 29
      5. Trends 29
        1. Biomass Feedstock To Bio-Ethylene 29
    5. Market Impact Analysis
      1. Supply Chain Analysis 31
        1. Raw Material Suppliers 31
        2. Light Olefins Producers 31
        3. Distributors 32
        4. End User 32
      1. Porter’s Five Forces 32
        1. Threat Of New Entrants 32
        2. The Intensity Of Competitive Rivalry 32
        3. Bargaining Power Of Supplier 32
        4. Bargaining Power Of Buyer 32
        5. Threat Of Substitute 32
    6. Global Light Olefins Market, By Type
      1. Ethylene 35
      2. Propylene 36
    7. Global Light Olefins Market, By Derivatives
      1. Polypropylene 40
      2. Propylene Oxide 41
      3. Acrylonitrile 42
      4. Cumene 43
      5. Acrylic Acid 44
      6. Oxo Alcohols 45
      7. Polyethylene 46
      8. Ethylene Oxide/Glycol 47
      9. EDC/VCM/PVC 48
      10. Styrene 49
      11. Alpha Olefins 50
      12. Vinyl Acetate Monomer 51
    8. Global Light Olefins Market, By Application
      1. Chemical Commodities 54
      2. Refinery 55
    9. Global Light Olefins Market, By Region
      1. Introduction 57
      2. North America 62
        1. US 66
        2. Canada 69
      3. Europe 73
        1. Germany 78
        2. France 81
        3. UK 84
        4. Spain 87
        5. Italy 90
        6. Rest Of Europe 93
      4. Asia Pacific 97
        1. China 101
        2. Japan 104
        3. India 107
        4. Rest Of Asia Pacific 110
      5. Latin America 114
      6. Middle East & Africa 119
    10. Competitive Landscape
      1. Introduction 125
        1. Market Strategy Overview 125
      2. Key Development Analysis 126
        1. Expansion 126
        2. Acquisition 126
        3. Joint Venture 127
        4. Agreement 127
    11. Company Profile
      1. Royal Dutch Shell 129
        1. Company Overview 129
        2. Financials 129
        3. Products 129
        4. Strategy 129
        5. Key Developments 129
      2. PetroChina 130
        1. Company Overview 130
        2. Financials 130
        3. Products 130
        4. Strategy 130
        5. Key Developments 130
      3. Relience Industries Limited 131
        1. Company Overview 131
        2. Financials 131
        3. Products 131
        4. Strategy 131
        5. Key Developments 131
      4. China Petro& Chemical Corp 132
        1. Company Overview 132
        2. Financials 132
        3. Products 132
        4. Strategy 132
        5. Key Developments 132
      5. DowDuPont, Inc 133
        1. Company Overview 133
        2. Financials 133
        3. Products 133
        4. Strategy 133
        5. Key Developments 133
      6. Exxon Mobil Corporation 134
        1. Company Overview 134
        2. Financials 134
        3. Products 134
        4. Strategy 134
        5. Key Developments 134
      7. Gazprom 135
        1. Company Overview 135
        2. Financials 135
        3. Products 135
        4. Strategy 135
        5. Key Developments 135
      8. Saudi Arabian Oil Co. 136
        1. Company Overview 136
        2. Financials 136
        3. Products 136
        4. Strategy 136
        5. Key Developments 136
      9. BASF SE 137
        1. Company Overview 137
        2. Financials 137
        3. Products 137
        4. Strategy 137
        5. Key Developments 137
      10. Honeywell International Inc 138
        1. Company Overview 138
        2. Financials 138
        3. Products 138
        4. Strategy 138
        5. Key Developments 138
    12. Conclusion
    13. List of Tables and Figures
      1. 13 List Of Tables
      2. TABLE 1 GLOBAL LIGHT OLEFINS MARKET, BY TYPE, 2020-2027 (USD BILLION) 34
      3. TABLE 2 GLOBAL LIGHT OLEFINS MARKET, BY TYPE, 2020-2027 (MILLION TONS) 35
      4. TABLE 3 GLOBAL LIGHT OLEFINS MARKET FOR ETHYLENE, 2020-2027 (USD BILLION) 35
      5. TABLE 4 GLOBAL LIGHT OLEFINS MARKET FOR ETHYLENE, 2020-2027 (MILLION TONS) 35
      6. TABLE 5 GLOBAL LIGHT OLEFINS MARKET FOR PROPYLENE, 2020-2027 (USD BILLION) 36
      7. TABLE 6 GLOBAL LIGHT OLEFINS MARKET FOR PROPYLENE, 2020-2027 (MILLION TONS) 36
      8. TABLE 7 GLOBAL LIGHT OLEFINS MARKET, BY DERIVATIVES, 2020-2027 (USD BILLION) 38
      9. TABLE 8 GLOBAL LIGHT OLEFINS MARKET, BY DERIVATIVES, 2020-2027 (MILLION TONS) 39
      10. TABLE 9 GLOBAL LIGHT OLEFINS MARKET FOR POLYPROPYLENE, 2020-2027 (USD BILLION) 40
      11. TABLE 10 GLOBAL LIGHT OLEFINS MARKET FOR POLYPROPYLENE, 2020-2027 (MILLION TONS) 40
      12. TABLE 11 GLOBAL LIGHT OLEFINS MARKET FOR PROPYLENE OXIDE, 2020-2027 (USD BILLION) 41
      13. TABLE 12 GLOBAL LIGHT OLEFINS MARKET FOR PROPYLENE OXIDE, 2020-2027 (MILLION TONS) 41
      14. TABLE 13 GLOBAL LIGHT OLEFINS MARKET FOR ACRYLONITRILE, 2020-2027 (USD BILLION) 42
      15. TABLE 14 GLOBAL LIGHT OLEFINS MARKET FOR ACRYLONITRILE, 2020-2027 (MILLION TONS) 42
      16. TABLE 15 GLOBAL LIGHT OLEFINS MARKET FOR CUMENE, 2020-2027 (USD BILLION) 43
      17. TABLE 16 GLOBAL LIGHT OLEFINS MARKET FOR CUMENE, 2020-2027 (MILLION TONS) 43
      18. TABLE 17 GLOBAL LIGHT OLEFINS MARKET FOR ACRYLIC ACID, 2020-2027 (USD BILLION) 44
      19. TABLE 18 GLOBAL LIGHT OLEFINS MARKET FOR ACRYLIC ACID, 2020-2027 (MILLION TONS) 44
      20. TABLE 19 GLOBAL LIGHT OLEFINS MARKET FOR OXO ALCOHOLS, 2020-2027 (USD BILLION) 45
      21. TABLE 20 GLOBAL LIGHT OLEFINS MARKET FOR OXO ALCOHOLS, 2020-2027 (MILLION TONS) 45
      22. TABLE 21 GLOBAL LIGHT OLEFINS MARKET FOR POLYETHYLENE, 2020-2027 (USD BILLION) 46
      23. TABLE 22 GLOBAL LIGHT OLEFINS MARKET FOR POLYETHYLENE, 2020-2027 (MILLION TONS) 46
      24. TABLE 23 GLOBAL LIGHT OLEFINS MARKET FOR ETHYLENE OXIDE/GLYCOL, 2020-2027 (USD BILLION) 47
      25. TABLE 24 GLOBAL LIGHT OLEFINS MARKET FOR ETHYLENE OXIDE/GLYCOL, 2020-2027 (MILLION TONS) 47
      26. TABLE 25 GLOBAL LIGHT OLEFINS MARKET FOR EDC/VCM/PVC, 2020-2027 (USD BILLION) 48
      27. TABLE 26 GLOBAL LIGHT OLEFINS MARKET FOR EDC/VCM/PVC, 2020-2027 (MILLION TONS) 48
      28. TABLE 27 GLOBAL LIGHT OLEFINS MARKET FOR STYRENE, 2020-2027 (USD BILLION) 49
      29. TABLE 28 GLOBAL LIGHT OLEFINS MARKET FOR STYRENE, 2020-2027 (MILLION TONS) 49
      30. TABLE 29 GLOBAL LIGHT OLEFINS MARKET FOR ALPHA OLEFINS, 2020-2027 (USD BILLION) 50
      31. TABLE 30 GLOBAL LIGHT OLEFINS MARKET FOR ALPHA OLEFINS, 2020-2027 (MILLION TONS) 50
      32. TABLE 31 GLOBAL LIGHT OLEFINS MARKET FOR VINYL ACETATE MONOMER, 2020-2027 (USD BILLION) 51
      33. TABLE 32 GLOBAL LIGHT OLEFINS MARKET FOR VINYL ACETATE MONOMER, 2020-2027 (MILLION TONS) 51
      34. TABLE 33 GLOBAL LIGHT OLEFINS MARKET, BY APPLICATION, 2020-2027 (USD BILLION) 53
      35. TABLE 34 GLOBAL LIGHT OLEFINS MARKET, BY APPLICATION, 2020-2027 (MILLION TONS) 54
      36. TABLE 35 GLOBAL LIGHT OLEFINS MARKET FOR CHEMICAL COMMODITIES, 2020-2027 (USD BILLION) 54
      37. TABLE 36 GLOBAL LIGHT OLEFINS MARKET FOR CHEMICAL COMMODITIES, 2020-2027 (USD BILLION) 54
      38. TABLE 37 GLOBAL LIGHT OLEFINS MARKET FOR REFINERY, 2020-2027 (USD BILLION) 55
      39. TABLE 38 GLOBAL LIGHT OLEFINS MARKET FOR REFINERY, 2020-2027 (USD BILLION) 55
      40. TABLE 39 GLOBAL LIGHT OLEFINS MARKET, BY REGION, 2020-2027 (USD BILLION) 57
      41. TABLE 40 GLOBAL LIGHT OLEFINS MARKET, BY REGION, 2020-2027 (MILLION TONS) 58
      42. TABLE 41 GLOBAL LIGHT OLEFINS MARKET, BY TYPE, 2020-2027 (USD BILLION) 58
      43. TABLE 42 GLOBAL LIGHT OLEFINS MARKET, BY TYPE, 2020-2027 (MILLION TONS) 59
      44. TABLE 43 GLOBAL LIGHT OLEFINS MARKET, BY DERIVATIVES, 2020-2027 (USD BILLION) 59
      45. TABLE 44 GLOBAL LIGHT OLEFINS MARKET, BY DERIVATIVES, 2020-2027 (MILLION TONS) 60
      46. TABLE 45 GLOBAL LIGHT OLEFINS MARKET, BY APPLICATION, 2020-2027 (USD BILLION) 60
      47. TABLE 46 GLOBAL LIGHT OLEFINS MARKET, BY APPLICATION, 2020-2027 (MILLION TONS) 61
      48. TABLE 47 NORTH AMERICA LIGHT OLEFINS MARKET, BY COUNTRY, 2020-2027 (USD BILLION) 63
      49. TABLE 48 NORTH AMERICA LIGHT OLEFINS MARKET, BY COUNTRY, 2020-2027 (MILLION TONS) 63
      50. TABLE 49 NORTH AMERICA LIGHT OLEFINS MARKET, BY TYPE, 2020-2027 (USD BILLION) 63
      51. TABLE 50 NORTH AMERICA LIGHT OLEFINS MARKET, BY TYPE, 2020-2027 (MILLION TONS) 64
      52. TABLE 51 NORTH AMERICA LIGHT OLEFINS MARKET, BY DERIVATIVES, 2020-2027 (USD BILLION) 64
      53. TABLE 52 NORTH AMERICA LIGHT OLEFINS MARKET, BY DERIVATIVES, 2020-2027 (MILLION TONS) 65
      54. TABLE 53 NORTH AMERICA LIGHT OLEFINS MARKET, BY APPLICATION, 2020-2027 (USD BILLION) 65
      55. TABLE 54 NORTH AMERICA LIGHT OLEFINS MARKET, BY APPLICATION, 2020-2027 (MILLION TONS) 66
      56. TABLE 55 US LIGHT OLEFINS MARKET, BY TYPE, 2020-2027 (USD BILLION) 66
      57. TABLE 56 US LIGHT OLEFINS MARKET, BY TYPE, 2020-2027 (MILLION TONS) 66
      58. TABLE 57 US LIGHT OLEFINS MARKET, BY DERIVATIVES, 2020-2027 (USD BILLION) 67
      59. TABLE 58 US LIGHT OLEFINS MARKET, BY DERIVATIVES, 2020-2027 (MILLION TONS) 68
      60. TABLE 59 US LIGHT OLEFINS MARKET, BY APPLICATION, 2020-2027 (USD BILLION) 68
      61. TABLE 60 US LIGHT OLEFINS MARKET, BY APPLICATION, 2020-2027 (MILLION TONS) 69
      62. TABLE 61 CANADA LIGHT OLEFINS MARKET, BY TYPE, 2020-2027 (USD BILLION) 69
      63. TABLE 62 CANADA LIGHT OLEFINS MARKET, BY TYPE, 2020-2027 (MILLION TONS) 69
      64. TABLE 63 CANADA LIGHT OLEFINS MARKET, BY DERIVATIVES, 2020-2027 (USD BILLION) 70
      65. TABLE 64 CANADA LIGHT OLEFINS MARKET, BY DERIVATIVES, 2020-2027 (MILLION TONS) 71
      66. TABLE 65 CANADA LIGHT OLEFINS MARKET, BY APPLICATION, 2020-2027 (USD BILLION) 71
      67. TABLE 66 CANADA LIGHT OLEFINS MARKET, BY APPLICATION, 2020-2027 (MILLION TONS) 72
      68. TABLE 67 EUROPE LIGHT OLEFINS MARKET, BY COUNTRY, 2020-2027 (USD BILLION) 74
      69. TABLE 68 EUROPE LIGHT OLEFINS MARKET, BY COUNTRY, 2020-2027 (MILLION TONS) 74
      70. TABLE 69 EUROPE LIGHT OLEFINS MARKET, BY TYPE, 2020-2027 (USD BILLION) 75
      71. TABLE 70 EUROPE LIGHT OLEFINS MARKET, BY TYPE, 2020-2027 (MILLION TONS) 75
      72. TABLE 71 EUROPE LIGHT OLEFINS MARKET, BY DERIVATIVES, 2020-2027 (USD BILLION) 76
      73. TABLE 72 EUROPE LIGHT OLEFINS MARKET, BY DERIVATIVES, 2020-2027 (MILLION TONS) 77
      74. TABLE 73 EUROPE LIGHT OLEFINS MARKET, BY APPLICATION, 2020-2027 (USD BILLION) 77
      75. TABLE 74 EUROPE LIGHT OLEFINS MARKET, BY APPLICATION, 2020-2027 (MILLION TONS) 78
      76. TABLE 75 GERMANY LIGHT OLEFINS MARKET, BY TYPE, 2020-2027 (USD BILLION) 78
      77. TABLE 76 GERMANY LIGHT OLEFINS MARKET, BY TYPE, 2020-2027 (MILLION TONS) 78
      78. TABLE 77 GERMANY LIGHT OLEFINS MARKET, BY DERIVATIVES, 2020-2027 (USD BILLION) 79
      79. TABLE 78 GERMANY LIGHT OLEFINS MARKET, BY DERIVATIVES, 2020-2027 (MILLION TONS) 80
      80. TABLE 79 GERMANY LIGHT OLEFINS MARKET, BY APPLICATION, 2020-2027 (USD BILLION) 80
      81. TABLE 80 GERMANY LIGHT OLEFINS MARKET, BY APPLICATION, 2020-2027 (MILLION TONS) 81
      82. TABLE 81 FRANCE LIGHT OLEFINS MARKET, BY TYPE, 2020-2027 (USD BILLION) 81
      83. TABLE 82 FRANCE LIGHT OLEFINS MARKET, BY TYPE, 2020-2027 (MILLION TONS) 81
      84. TABLE 83 FRANCE LIGHT OLEFINS MARKET, BY DERIVATIVES, 2020-2027 (USD BILLION) 82
      85. TABLE 84 FRANCE LIGHT OLEFINS MARKET, BY DERIVATIVES, 2020-2027 (MILLION TONS) 83
      86. TABLE 85 FRANCE LIGHT OLEFINS MARKET, BY APPLICATION, 2020-2027 (USD BILLION) 83
      87. TABLE 86 FRANCE LIGHT OLEFINS MARKET, BY APPLICATION, 2020-2027 (MILLION TONS) 84
      88. TABLE 87 UK LIGHT OLEFINS MARKET, BY TYPE, 2020-2027 (USD BILLION) 84
      89. TABLE 88 UK LIGHT OLEFINS MARKET, BY TYPE, 2020-2027 (MILLION TONS) 84
      90. TABLE 89 UK LIGHT OLEFINS MARKET, BY DERIVATIVES, 2020-2027 (USD BILLION) 85
      91. TABLE 90 UK LIGHT OLEFINS MARKET, BY DERIVATIVES, 2020-2027 (MILLION TONS) 86
      92. TABLE 91 UK LIGHT OLEFINS MARKET, BY APPLICATION, 2020-2027 (USD BILLION) 86
      93. TABLE 92 UK LIGHT OLEFINS MARKET, BY APPLICATION, 2020-2027 (MILLION TONS) 87
      94. TABLE 93 SPAIN LIGHT OLEFINS MARKET, BY TYPE, 2020-2027 (USD BILLION) 87
      95. TABLE 94 SPAIN LIGHT OLEFINS MARKET, BY TYPE, 2020-2027 (MILLION TONS) 87
      96. TABLE 95 SPAIN LIGHT OLEFINS MARKET, BY DERIVATIVES, 2020-2027 (USD BILLION) 88
      97. TABLE 96 SPAIN LIGHT OLEFINS MARKET, BY DERIVATIVES, 2020-2027 (MILLION TONS) 89
      98. TABLE 97 SPAIN LIGHT OLEFINS MARKET, BY APPLICATION, 2020-2027 (USD BILLION) 89
      99. TABLE 98 SPAIN LIGHT OLEFINS MARKET, BY APPLICATION, 2020-2027 (MILLION TONS) 90
      100. TABLE 99 ITALY LIGHT OLEFINS MARKET, BY TYPE, 2020-2027 (USD BILLION) 90
      101. TABLE 100 ITALY LIGHT OLEFINS MARKET, BY TYPE, 2020-2027 (MILLION TONS) 90
      102. TABLE 101 ITALY LIGHT OLEFINS MARKET, BY DERIVATIVES, 2020-2027 (USD BILLION) 91
      103. TABLE 102 ITALY LIGHT OLEFINS MARKET, BY DERIVATIVES, 2020-2027 (MILLION TONS) 92
      104. TABLE 103 ITALY LIGHT OLEFINS MARKET, BY APPLICATION, 2020-2027 (USD BILLION) 92
      105. TABLE 104 ITALY LIGHT OLEFINS MARKET, BY APPLICATION, 2020-2027 (MILLION TONS) 93
      106. TABLE 105 REST OF EUROPE LIGHT OLEFINS MARKET, BY TYPE, 2020-2027 (USD BILLION) 93
      107. TABLE 106 REST OF EUROPE LIGHT OLEFINS MARKET, BY TYPE, 2020-2027 (MILLION TONS) 93
      108. TABLE 107 REST OF EUROPE LIGHT OLEFINS MARKET, BY DERIVATIVES, 2020-2027 (USD BILLION) 94
      109. TABLE 108 REST OF EUROPE LIGHT OLEFINS MARKET, BY DERIVATIVES, 2020-2027 (MILLION TONS) 95
      110. TABLE 109 REST OF EUROPE LIGHT OLEFINS MARKET, BY APPLICATION, 2020-2027 (USD BILLION) 95
      111. TABLE 110 REST OF EUROPE LIGHT OLEFINS MARKET, BY APPLICATION, 2020-2027 (MILLION TONS) 96
      112. TABLE 111 ASIA PACIFIC LIGHT OLEFINS MARKET, BY COUNTRY, 2020-2027 (USD BILLION) 98
      113. TABLE 112 ASIA PACIFIC LIGHT OLEFINS MARKET, BY COUNTRY, 2020-2027 (MILLION TONS) 98
      114. TABLE 113 ASIA PACIFIC LIGHT OLEFINS MARKET, BY TYPE, 2020-2027 (USD BILLION) 98
      115. TABLE 114 ASIA PACIFIC LIGHT OLEFINS MARKET, BY TYPE, 2020-2027 (MILLION TONS) 99
      116. TABLE 115 ASIA PACIFIC LIGHT OLEFINS MARKET, BY DERIVATIVES, 2020-2027 (USD BILLION) 99
      117. TABLE 116 ASIA PACIFIC LIGHT OLEFINS MARKET, BY DERIVATIVES, 2020-2027 (MILLION TONS) 100
      118. TABLE 117 ASIA PACIFIC LIGHT OLEFINS MARKET, BY APPLICATION, 2020-2027 (USD BILLION) 100
      119. TABLE 118 ASIA PACIFIC LIGHT OLEFINS MARKET, BY APPLICATION, 2020-2027 (MILLION TONS) 101
      120. TABLE 119 CHINA LIGHT OLEFINS MARKET, BY TYPE, 2020-2027 (USD BILLION) 101
      121. TABLE 120 CHINA LIGHT OLEFINS MARKET, BY TYPE, 2020-2027 (MILLION TONS) 101
      122. TABLE 121 CHINA LIGHT OLEFINS MARKET, BY DERIVATIVES, 2020-2027 (USD BILLION) 102
      123. TABLE 122 CHINA LIGHT OLEFINS MARKET, BY DERIVATIVES, 2020-2027 (MILLION TONS) 103
      124. TABLE 123 CHINA LIGHT OLEFINS MARKET, BY APPLICATION, 2020-2027 (USD BILLION) 103
      125. TABLE 124 CHINA LIGHT OLEFINS MARKET, BY APPLICATION, 2020-2027 (MILLION TONS) 104
      126. TABLE 125 JAPAN LIGHT OLEFINS MARKET, BY TYPE, 2020-2027 (USD BILLION) 104
      127. TABLE 126 JAPAN LIGHT OLEFINS MARKET, BY TYPE, 2020-2027 (MILLION TONS) 105
      128. TABLE 127 JAPAN LIGHT OLEFINS MARKET, BY DERIVATIVES, 2020-2027 (USD BILLION) 106
      129. TABLE 128 JAPAN LIGHT OLEFINS MARKET, BY DERIVATIVES, 2020-2027 (MILLION TONS) 106
      130. TABLE 129 JAPAN LIGHT OLEFINS MARKET, BY APPLICATION, 2020-2027 (USD BILLION) 107
      131. TABLE 130 JAPAN LIGHT OLEFINS MARKET, BY APPLICATION, 2020-2027 (MILLION TONS) 107
      132. TABLE 131 INDIA LIGHT OLEFINS MARKET, BY TYPE, 2020-2027 (USD BILLION) 107
      133. TABLE 132 INDIA LIGHT OLEFINS MARKET, BY TYPE, 2020-2027 (MILLION TONS) 108
      134. TABLE 133 INDIA LIGHT OLEFINS MARKET, BY DERIVATIVES, 2020-2027 (USD BILLION) 108
      135. TABLE 134 INDIA LIGHT OLEFINS MARKET, BY DERIVATIVES, 2020-2027 (MILLION TONS) 109
      136. TABLE 135 INDIA LIGHT OLEFINS MARKET, BY APPLICATION, 2020-2027 (USD BILLION) 109
      137. TABLE 136 INDIA LIGHT OLEFINS MARKET, BY APPLICATION, 2020-2027 (MILLION TONS) 110
      138. TABLE 137 REST OF ASIA PACIFIC LIGHT OLEFINS MARKET, BY TYPE, 2020-2027 (USD BILLION) 110
      139. TABLE 138 REST OF ASIA PACIFIC LIGHT OLEFINS MARKET, BY TYPE, 2020-2027 (MILLION TONS) 110
      140. TABLE 139 REST OF ASIA PACIFIC LIGHT OLEFINS MARKET, BY DERIVATIVES, 2020-2027 (USD BILLION) 111
      141. TABLE 140 REST OF ASIA PACIFIC LIGHT OLEFINS MARKET, BY DERIVATIVES, 2020-2027 (MILLION TONS) 112
      142. TABLE 141 REST OF ASIA PACIFIC LIGHT OLEFINS MARKET, BY APPLICATION, 2020-2027 (USD BILLION) 112
      143. TABLE 142 REST OF ASIA PACIFIC LIGHT OLEFINS MARKET, BY APPLICATION, 2020-2027 (MILLION TONS) 113
      144. TABLE 143 LATIN AMERICA LIGHT OLEFINS MARKET, BY TYPE, 2020-2027 (USD BILLION) 115
      145. TABLE 144 LATIN AMERICA LIGHT OLEFINS MARKET, BY TYPE, 2020-2027 (MILLION TONS) 115
      146. TABLE 145 LATIN AMERICA LIGHT OLEFINS MARKET, BY DERIVATIVES, 2020-2027 (USD BILLION) 116
      147. TABLE 146 LATIN AMERICA LIGHT OLEFINS MARKET, BY DERIVATIVES, 2020-2027 (MILLION TONS) 117
      148. TABLE 147 LATIN AMERICA LIGHT OLEFINS MARKET, BY APPLICATION, 2020-2027 (USD BILLION) 117
      149. TABLE 148 LATIN AMERICA LIGHT OLEFINS MARKET, BY APPLICATION, 2020-2027 (MILLION TONS) 118
      150. TABLE 150 MIDDLE EAST & AFRICA LIGHT OLEFINS MARKET, BY TYPE, 2020-2027 (USD BILLION) 120
      151. TABLE 151 MIDDLE EAST & AFRICA LIGHT OLEFINS MARKET, BY TYPE, 2020-2027 (MILLION TONS) 120
      152. TABLE 152 MIDDLE EAST & AFRICA LIGHT OLEFINS MARKET, BY DERIVATIVES, 2020-2027 (USD BILLION) 121
      153. TABLE 153 MIDDLE EAST & AFRICA LIGHT OLEFINS MARKET, BY DERIVATIVES, 2020-2027 (MILLION TONS) 122
      154. TABLE 154 MIDDLE EAST & AFRICA LIGHT OLEFINS MARKET, BY APPLICATION, 2020-2027 (USD BILLION) 122
      155. TABLE 155 MIDDLE EAST & AFRICA LIGHT OLEFINS MARKET, BY APPLICATION, 2020-2027 (MILLION TONS) 123 14 List Of Figures
      156. FIGURE 1 TOP DOWN & Bottom-up Approach 22
      157. FIGURE 2 FORECAST MODEL 23
      158. FIGURE 3 DRIVERS, RESTRAINT, OPPORTUNITY, AND TREND OF GLOBAL LIGHT OLEFINSMARKET 25
      159. FIGURE 4 SUPPLY CHAIN ANALYSIS 31
      160. FIGURE 1 GLOBAL LIGHT OLEFINS MARKET, BY TYPE, 2020-2027 (USD BILLION) 34
      161. FIGURE 2 GLOBAL LIGHT OLEFINS MARKET, BY TYPE, 2020-2027 (MILLION TONS) 34
      162. FIGURE 3 GLOBAL LIGHT OLEFINS MARKET, BY DERIVATIVES, 2020-2027 (USD BILLION) 38
      163. FIGURE 4 GLOBAL LIGHT OLEFINS MARKET, BY DERIVATIVES, 2020-2027 (MILLION TONS) 39
      164. FIGURE 5 GLOBAL LIGHT OLEFINS MARKET, BY APPLICATION, 2020-2027 (USD BILLION) 53
      165. FIGURE 6 GLOBAL LIGHT OLEFINS MARKET, BY APPLICATION, 2020-2027 (MILLION TONS) 53
      166. FIGURE 7 GLOBAL LIGHT OLEFINS MARKET, BY REGION, 2020-2027 (USD BILLION) 57
      167. FIGURE 8 GLOBAL LIGHT OLEFINS MARKET, BY REGION, 2020-2027 (MILLION TONS) 58

    Light Olefins Market Segmentation

    Market Segmentation Overview

    • Detailed segmentation data will be available in the full report
    • Comprehensive analysis by multiple parameters
    • Regional and country-level breakdowns
    • Market size forecasts by segment
    Infographic

    Free Sample Request

    Kindly complete the form below to receive a free sample of this Report

    Get Free Sample

    Customer Strories

    “I am very pleased with how market segments have been defined in a relevant way for my purposes (such as "Portable Freezers & refrigerators" and "last-mile"). In general the report is well structured. Thanks very much for your efforts.”

    Victoria Milne

    Founder
    Case Study
    Chemicals and Materials