• Cat-intel
  • MedIntelliX
  • Resources
  • About Us
  • Hero Background
    English
    Chinese
    French
    Japanese
    Korean
    German
    Spanish

    Low E Glass Market Share

    ID: MRFR/CO/10765-HCR
    111 Pages
    Snehal Singh
    October 2025

    Low E-glass Market Research Report Information By Glazing (Single Glazing, Double Glazing, and Triple Glazing), By Coating Type (Solar Control Low-E Coating, Passive Low-E Coating, and Others), By End use (Building and Construction, Automotive, and Others) And By Region (North America, Europe, Asia-Pacific, And Rest Of The World) –Market Forecast Till 2035

    Share:
    Download PDF ×

    We do not share your information with anyone. However, we may send you emails based on your report interest from time to time. You may contact us at any time to opt-out.

    Low E Glass Market Infographic
    $ 4,950.0
    $ 5,950.0
    $ 7,250.0

    Market Share

    Low E Glass Market Share Analysis

    The Low E Glass Market is witnessing strategic shifts as companies aim to establish a prominent presence in the energy-efficient glass sector. To gain a competitive edge, businesses are implementing various market positioning strategies that encompass technological innovation, customization, and sustainability. Here are key strategies employed in the market share positioning of Low E Glass: Advancements in Coating Technologies: Leading companies in the Low E Glass Market prioritize continuous advancements in coating technologies. This involves the development of high-performance low emissivity (Low E) coatings with enhanced thermal insulation properties, UV protection, and optical clarity. Innovations in coating technologies contribute to the introduction of energy-efficient glass products that meet the evolving demands of the construction and automotive industries, positioning manufacturers as leaders in the field. Diversification Across Applications: To broaden market reach, companies focus on diversifying the applications of Low E Glass. This includes its use in windows, doors, facades, and automotive glazing. Diversification allows companies to cater to the varied needs of different industries, positioning Low E Glass as a versatile solution for energy efficiency. Customization for Climate Requirements: Customization is a key strategy, with companies tailoring Low E Glass products for specific climate conditions. Offering variations that address different climate requirements enhances the appeal of these glasses for both residential and commercial construction projects in diverse geographical locations. Providing customized solutions improves the suitability of Low E Glass for varying energy efficiency needs, making it an attractive option for a wide range of customers. Sustainability and Environmental Considerations: With an increasing focus on sustainability, companies in the Low E Glass Market are adopting eco-friendly practices. This includes the use of low-emission coatings that reduce energy consumption in buildings, contributing to sustainability goals. Positioning Low E Glass as an environmentally conscious choice aligns with global green building standards and attracts environmentally conscious customers. Strategic Alliances with Architects and Designers: Collaborative efforts with architects, designers, and construction professionals form a strategic approach. Partnerships enable companies to work closely with industry stakeholders, providing insights into design trends, ensuring the integration of Low E Glass into architectural projects, and enhancing the aesthetic appeal of energy-efficient glass solutions. Joint ventures and collaborations with key influencers in the construction and design sectors strengthen a company's positioning in the market. Global Market Expansion: Companies aiming for increased market share strategically expand their global presence. This involves entering new markets, establishing partnerships with distributors, and adapting Low E Glass products to meet diverse international standards. A global footprint not only widens the customer base but also positions a company as a reliable supplier capable of meeting the diverse needs of an international clientele. Investment in Research and Development: A commitment to research and development is crucial for staying competitive in the Low E Glass Market. Companies invest in R&D to explore new coating formulations, improve manufacturing processes, and stay ahead of industry trends. Innovations stemming from R&D efforts contribute to positioning manufacturers as leaders in the development of cutting-edge energy-efficient glass solutions. Education and Awareness Programs: Providing education and awareness programs about the benefits of Low E Glass is a strategic approach. This includes educating architects, builders, and consumers about the energy-saving properties, cost-effectiveness, and long-term advantages of using Low E Glass in construction projects. Educated stakeholders are more likely to consider and specify Low E Glass, contributing to increased market adoption and positioning these products as essential components in energy-efficient building design.

    Market Summary

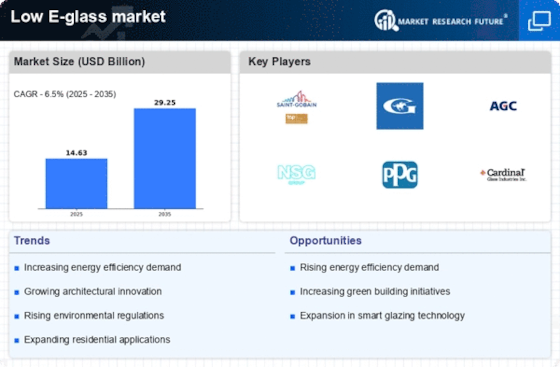
    As per Market Research Future Analysis, the Global Low E-glass Market was valued at USD 12.9 Billion in 2022 and is projected to reach USD 22.74 Billion by 2032, growing at a CAGR of 6.50% from 2023 to 2032. Key drivers include expanding construction projects, increased awareness of energy-saving practices, and rising use in automobiles. The market is significantly influenced by the demand for energy-efficient solutions in residential and commercial buildings, with low-E-glass providing benefits such as reduced UV and infrared radiation, improved thermal insulation, and energy cost savings.

    Key Market Trends & Highlights

    The Low E-glass market is witnessing significant growth driven by urban development and energy efficiency initiatives.

    • Market Size in 2022: USD 12.9 Billion; Projected Market Size by 2032: USD 22.74 Billion.
    • CAGR from 2023 to 2032: 6.50%; Dominant segment: Building and Construction.
    • Single glazing segment leads due to cost-effectiveness and ease of installation.
    • North America holds the largest market share, driven by investments in energy-efficient construction.

    Market Size & Forecast

    2022 Market Size USD 12.9 Billion
    2023 Market Size USD 13.74 Billion
    2032 Market Size USD 22.74 Billion
    CAGR 6.50%.

    Major Players

    Key players include Asahi Glass Co. Ltd., Saint-Gobain SA, Corning Inc., Nippon Sheet Glass Co., Ltd., Xinyi Glass Holdings Limited, and PPG Industries, Inc.

    Market Trends

    Growing urban development initiatives on a big scale is driving the market growth

    Market CAGR for low e-glass is being driven by the rising urban development initiatives on a big scale. Low-E-glass, sometimes referred to as low-emissivity glass, is made to lessen the amount of UV and infrared radiation that enters our home while simultaneously limiting the amount of light that may flow through a building's glass. Inside Low-E-glass windows, there is a microscopic-thin, translucent layer that deflects heat and keeps the space cool. The low-E coating helps to keep a steady temperature within the house by reflecting internal heat.

    Additionally, the demand for low-E-glass is significantly influenced by the construction of residential and commercial buildings. The worldwide construction sector was estimated to be worth USD 22.04 trillion in 2020 by the World Bank U.S. The demand for low-E-glass is significantly fueled by these examples of revenue development in the construction of commercial and residential buildings. Due to energy-saving, solar control, and better thermal insulation, low-E-glasses are being employed more and more in modern construction and green buildings. In comparison to uncoated regular toughened glass units, installing low-E-glass units is typically more expensive for residential and commercial windows.

    The cost of Low-E coated windows is approximately 10% to 15% higher than that of standard windows, according to the US Department of Energy.

    Low-E-glass panels are increasingly being used by home and business builders, developers, architects, and green building contractors due to its ability to save energy. Additionally, to improve mileage, heat insulation, sun control, and CO2 emissions, automobile manufacturers are switching from standard to low-E-glass. The characteristics of low-E-glass also contribute to reducing the U-value and shading coefficient (SC), which improves the overall energy economy of automobiles. The rise of the low-E-glass business is being largely fueled by the need to lower energy costs by lowering carbon emissions.

    For instance, the International Energy Agency (IEA) Paris estimates that buildings utilize roughly 30% of the energy consumed worldwide and 55% of the electricity. Numerous attempts to create energy-efficient buildings are being undertaken as a result of growing efforts to reduce energy usage at an individual level. The market for low-E-glass is being driven by conscious efforts in the residential and commercial sectors to reduce energy usage. Thus, result in driving the Low E-glass market revenue.

    The increasing demand for energy-efficient building materials, such as Low E-glass, reflects a broader commitment to sustainability and energy conservation in the construction sector.

    U.S. Department of Energy

    Low E Glass Market Market Drivers

    Market Growth Projections

    The Global Low E-glass market Industry is poised for substantial growth, with projections indicating a market size of 14.5 USD Billion in 2024 and an anticipated increase to 27.5 USD Billion by 2035. This growth trajectory suggests a compound annual growth rate of 5.97% from 2025 to 2035, driven by factors such as rising energy efficiency demands, regulatory support, and technological advancements. The market's expansion reflects a broader trend towards sustainable construction practices, as stakeholders increasingly recognize the benefits of Low E-glass in reducing energy consumption and enhancing building performance. Such projections underscore the industry's potential for innovation and investment in the coming years.

    Regulatory Support and Incentives

    The Global Low E-glass market Industry benefits from supportive regulatory frameworks and financial incentives aimed at promoting sustainable construction practices. Governments are increasingly offering tax credits, rebates, and grants to encourage the use of energy-efficient materials, including Low E-glass. This regulatory support not only enhances the market appeal of Low E-glass but also stimulates investment in energy-efficient technologies. As a result, the market is likely to witness a compound annual growth rate of 5.97% from 2025 to 2035. Such incentives are pivotal in driving the adoption of Low E-glass in both residential and commercial sectors, thereby contributing to the overall growth of the industry.

    Growing Demand for Energy Efficiency

    The Global Low E-glass market Industry experiences a surge in demand driven by the increasing emphasis on energy efficiency in buildings. Low E-glass, known for its ability to reflect infrared light while allowing visible light to pass through, plays a crucial role in reducing energy consumption. As governments worldwide implement stringent energy codes and standards, the adoption of Low E-glass is likely to rise. In 2024, the market is projected to reach 14.5 USD Billion, reflecting a growing awareness of sustainable building practices. This trend is expected to continue, with the market potentially reaching 27.5 USD Billion by 2035, indicating a robust growth trajectory fueled by energy efficiency initiatives.

    Diverse Applications Across Industries

    The Global Low E-glass market Industry benefits from its diverse applications across various sectors, including residential, commercial, and automotive. Low E-glass is utilized in windows, facades, and skylights, providing energy efficiency and aesthetic appeal. The versatility of Low E-glass allows it to meet the specific needs of different industries, thereby expanding its market reach. As urbanization continues to rise globally, the demand for energy-efficient building materials is likely to increase, further driving the adoption of Low E-glass. This trend suggests a promising outlook for the market, with expectations of a compound annual growth rate of 5.97% from 2025 to 2035, reflecting the growing integration of Low E-glass in various applications.

    Technological Advancements in Glass Manufacturing

    Technological advancements in glass manufacturing processes significantly enhance the performance and affordability of Low E-glass, thereby propelling the Global Low E-glass market Industry. Innovations such as improved coating techniques and the development of new materials have led to enhanced thermal insulation and durability of Low E-glass products. These advancements not only improve energy efficiency but also reduce production costs, making Low E-glass more accessible to a broader range of consumers. As manufacturers continue to invest in research and development, the market is expected to expand, potentially reaching 27.5 USD Billion by 2035, reflecting the positive impact of these technological innovations.

    Increasing Awareness of Sustainable Building Practices

    The Global Low E-glass market Industry is witnessing increased awareness regarding sustainable building practices among architects, builders, and consumers. This heightened awareness is driven by the growing recognition of the environmental impact of traditional building materials. Low E-glass, with its energy-saving properties, is increasingly specified in new construction and renovation projects. As more stakeholders prioritize sustainability, the demand for Low E-glass is likely to rise. This trend is expected to contribute to the market's growth, with projections indicating a potential market size of 14.5 USD Billion in 2024 and a significant increase to 27.5 USD Billion by 2035, underscoring the shift towards eco-friendly construction solutions.

    Market Segment Insights

    Low E-glass Glazing Insights

    The Low E-glass market segmentation, based on Glazing, includes Single Glazing, Double Glazing, and Triple Glazing. The single glazing segment dominated the market. Single-glass panels are rapidly becoming common in automotive and architecture and construction, which is boosting the segment's income. Because it is simple to install and is a less expensive choice, single glazing is frequently utilized in construction and building.

    Low E-glass Coating Type Insights

    The Low E-glass market segmentation, based on Coating Type, includes Solar control low-e coating, Passive low-E coating, and Others. The solar control low-e coating category generated the most income. To block damaging ultraviolet (UV) rays and consume less air conditioning, solar control low-E coatings are frequently used in commercial buildings like airports, exhibition halls, auditoriums, malls, and hospitals. It also provides great thermal insulation, reducing up to 60% of the solar heat that enters the space. Using the Magnetron Sputtering Vapor Deposition (MSVD) method, solar control low-E coating is created.

    Off-line, at room temperature, and on pre-cut glass, the coating is placed.

    Low E-glass End use Insights

    The Low E-glass market segmentation, based on End use, includes Building and Construction, Automotive, and Others. The building and construction category generated the most income. It is predicted that the overall product demand would increase as building and construction projects advance quickly. To lessen the quantity of UV and infrared light entering through the-glass, passive and solar control low-E coatings are frequently used in doors and windows.

    Figure1: Low E-glass Market, by End Use, 2022&2032 (USD Billion)Source: Primary Research, Secondary Research, Market Research Future Database and Analyst Review

    Get more detailed insights about Low E Glass Market Research Report - Global Forecast 2032

    Regional Insights

    By region, the study provides the market insights into North America, Europe, Asia-Pacific and Rest of the World. The North American Low E-glass market area will dominate this market. The region's expanding investment prospects in residential and commercial construction projects as well as end users' growing awareness of the benefits of utilizing energy-efficient glass window panes are the main factors expected to propel industry growth over the projection period.

    Further, the major countries studied in the market report are The US, German, France, Canada, the UK, Spain, China, Italy, Japan, India, South Korea, Australia, and Brazil.

    Figure2: LOW E-GLASS MARKET SHARE BY REGION 2022 (USD Billion) LOW E-GLASS MARKET SHARE BY REGION 2022Source: Primary Research, Secondary Research, Market Research Future Database and Analyst Review

    Europe Low E-glass market accounts for the second-largest market share because of the growing use of double- or triple-glazed low-emission glass modules in new construction or as replacement glazing, because of the increased thermal properties. Further, the German Low E-glass market held the largest market share, and the UK Low E-glass market was the fastest growing market in the European region

    The Asia-Pacific Low E-glass Market is anticipated to experience the greatest CAGR growth from 2023 to 2032. This is due to the region's growing urbanization, smart city and tower construction projects are major drivers of the market's revenue growth throughout the projection period. Moreover, China’s Low E-glass market held the largest market share, and the Indian Low E-glass market was the fastest growing market in the Asia-Pacific region.

    Key Players and Competitive Insights

    Leading market players are putting significant share in R&D to broaden their product ranges, which will help the market for Low E-glass grow even further. Additionally, market participants are engaging in a range of strategic initiatives to increase their worldwide reach, with important market developments such as the introduction of new products, contracts, mergers and acquisitions, increased investments, and cooperation with other organizations. To grow and endure in an increasingly competitive and challenging market environment, Low E-glass industry must offer cost-effective items.

    One of the main business strategies employed by manufacturers is to produce locally to reduce operational expenses in the Low E-glass industry to customers and expand the market sector. In recent years, the Low E-glass industry has offered some of the most significant advantages to continue urbanization. Major players in the Low E-glass market, including Asahi Glass Co. Ltd., Saint-Gobain SA, Corning Inc., Nippon Sheet Glass Co., Ltd., Xinyi Glass Holdings Limited, PPG Industries, Inc., and others, invest in operations for research and development in an effort to improve market demand.

    French international company Compagnie de Saint-Gobain S.A. was established in Paris in 1665, with offices in Courbevoie and La Défense. Originally a producer of mirrors, it now produces a range of building, high-performance, and other materials. By 2022, Saint-Gobain will have operations in 76 nations and employ more than 170,000 people. In the last few years, Saint-Gobain has acquired a number of new companies. The largest producer of plasterboard in the world, British firm BPB plc, was acquired by it for US$6.7 billion in December 2005.

    In 2023, Twiga Fibreglass, a producer of glass wool with facilities close to Mumbai and Delhi, was bought by the company's India division.

    Corning Incorporated is an American technology corporation that specialises in specialty glass, ceramics, and related materials and technologies, including cutting-edge optics, principally for industrial and scientific purposes. Before 1989, the business was known as Corning Glass Works. In 1998, Corning sold its consumer product lines, including Pyrex glass bakeware, CorningWare and Visions Pyroceram cookware, Corelle Vitrelle tableware, to Borden. In 2019, In order to create and manufacture the-glass required for several of its devices, including the iPhone, Apple Watch, and iPad, Apple announced that it would invest $250 million in Corning.

    Although neither business has confirmed it, the funding might someday be put towards creating new goods.

    Key Companies in the Low E Glass Market market include

    Industry Developments

    February 2022: The Echo 5G Boost subscriber repeater for low-E-glass windows was just released, according to Pivotal Commware, a leader in 5G mmWave smart infrastructure technology. The purpose of Echo 5G Boost is to reduce mmWave losses due to structure shadowing, reflection, and penetration.

    June 2023: Vitro has released a new Advanced Low-E-glass Sample Kit that includes a variety of its high-performance Solarban sun control, low-e-glass products. Each product sample in the Advanced Low-E-glass Sample Kit has a solar heat gain coefficient (SHGC) of 0.25 or less, indicating a superior capacity to minimize the transmittance of heat energy from the sun. This makes them perfect for use in façade designs that need to control day lighting.

    Future Outlook

    Low E Glass Market Future Outlook

    The Global Low E-glass market is projected to grow at a 5.97% CAGR from 2024 to 2035, driven by energy efficiency regulations, rising construction activities, and technological advancements.

    New opportunities lie in:

    • Develop advanced Low E-coatings for enhanced thermal performance.
    • Expand product lines to cater to the growing demand in emerging markets.
    • Invest in smart glass technologies integrating Low E-glass for energy management.

    By 2035, the Low E-glass market is expected to achieve substantial growth, reflecting evolving consumer preferences and regulatory landscapes.

    Market Segmentation

    Low E-glass Glazing Outlook

    • Single Glazing
    • Double Glazing
    • Triple Glazing

    Low E-glass Regional Outlook

    North America
    • US
    • Canada
    • Mexico

    Low E-glass End use Outlook

    • Building and Construction
    • Automotive
    • Others

    Low E-glass Coating Type Outlook

    • Solar control low-E coating
    • Passive low-E coating
    • Others

    Report Scope

    Report Attribute/Metric Details
    Market Size2022 USD 12.9 Billion
    Market Size 2023 USD 13.74 Billion
    Market Size2032 USD 22.74 Billion
    Compound Annual Growth Rate (CAGR) 6.50% (2023-2032)
    Base Year 2022
    Market Forecast Period 2023-2032
    Historical Data 2018- 2022
    Market Forecast Units Value (USD Billion)
    Report Coverage Revenue Forecast, Market Competitive Landscape, Growth Factors, and Trends
    Segments Covered Glazing, Coating Type, End use, and Region
    Geographies Covered North America, Europe, AsiaPacific, and the Rest of the World
    Countries Covered The US, Canada, France, German, UK, Italy, Spain, Japan, India, China, Australia, South Korea, and Brazil
    Key Companies Profiled  Asahi Glass Co. Ltd., Saint-Gobain SA, Corning Inc., Nippon Sheet Glass Co., Ltd., Xinyi Glass Holdings Limited, PPG Industries, Inc.
    Key Market Opportunities improvements in glass expand the market profitably
    Key Market Dynamics the expansion of construction projects around the world

    Market Highlights

    Author

    Snehal Singh
    Assistant Manager - Research

    She holds an experience of about 6+ years in market research and business consulting, working under the spectrum of information communication technology, telecommunications and semiconductor domains. aarti conceptualizes and implements a scalable business strategy and provides strategic leadership to the clients. her expertise lies in market estimation, competitive intelligence, pipeline analysis, customer assessment, etc.

    Leave a Comment

    Latest Comments

    John Doe
    john@example.com

    This is a great article! Really helped me understand the topic better.

    Posted on July 23, 2025, 10:15 AM
    Jane Smith
    jane@domain.com

    Thanks for sharing this. I’ve bookmarked it for later reference.

    Posted on July 22, 2025, 7:45 PM

    FAQs

    How big is the market for Low E-glass?

    It was predicted that the market for Low E-glass would be worth USD 12.9 billion in 2022.

    What is the market growth rate for Low E-glass?

    It is anticipated that between 2023 and 2032, the market would expand at a CAGR of 6.50%.

    Which region held the largest share of the low-e-glass market?

    North America maintained the biggest market share globally.

    Who are the leading companies in the market for Low E-glass?

    Corning Inc., Asahi Glass Co. Ltd., Saint-Gobain SA, Nippon Sheet Glass Co., Ltd., Xinyi Glass Holdings Limited, PPG Industries, Inc., CSG Holding Co. Ltd

    Which Glazing dominated the market for Low E-glass?

    In 2022, the market was dominated by the single glazing category.

    In the market for Low E-glass, which coating type held the biggest market share?

    In terms of market share worldwide, solar control low-E coating was most popular.

    1. List of Tables and Figures
      1. |-
      2. Table of Contents 1. Executive Summary 2. Market Introduction 2.1. Definition 2.2. Scope of the Study 2.2.1. Research Objective 2.2.2. Assumptions 2.2.3. Limitations 3. Research Methodology 3.1. Overview 3.2. Data Mining 3.3. Secondary Research 3.4. Primary Research 3.4.1. Primary Interviews and Information Gathering Process 3.4.2. Breakdown of Primary Respondents 3.5. Forecasting Model 3.6. Market Size Estimation 3.6.1. Bottom-up Approach 3.6.2. Top-Down Approach 3.7. Data Triangulation 3.8. Validation 4. MARKET DYNAMICS 4.1. Overview 4.2. Drivers 4.3. Restraints 4.4. Opportunities 5. MARKET FACTOR ANALYSIS 5.1. Value Chain Analysis 5.2. Porter’s Five Forces Analysis 5.2.1. Bargaining Power of Suppliers 5.2.2. Bargaining Power of Buyers 5.2.3. Threat of New Entrants 5.2.4. Threat of Substitutes 5.2.5. Intensity of Rivalry 5.3. COVID-19 Impact Analysis 5.3.1. Market Impact Analysis 5.3.2. Regional Impact 5.3.3. Opportunity and Threat Analysis 6. GLOBAL LOW E GLASS MARKET,BY GLAZING 6.1. Overview 6.2. Single Glazing 6.3. Double Glazing 6.4. Triple Glazing 7. GLOBAL LOW E GLASS MARKET,BY COATING TYPE 7.1. Overview 7.2. Solar control low-E coating 7.3. Passive low-E coating 7.4. Others 8. GLOBAL LOW E GLASS MARKET,BY END USE 8.1. Overview 8.2. Building and Construction 8.3. Automotive 8.4. Others 9. GLOBAL LOW E GLASS MARKET, BY REGION 9.1. Overview 9.1. North America 9.1.1. US 9.1.2. Canada 9.2. Europe 9.2.1. Germany 9.2.2. France 9.2.3. UK 9.2.4. Italy 9.2.5. Spain 9.2.6. Rest of Europe 9.3. Asia-Pacific 9.3.1. China 9.3.2. India 9.3.3. Japan 9.3.4. South Korea 9.3.5. Australia 9.3.6. Rest of Asia-Pacific 9.4. Rest of the World 9.4.1. Middle East 9.4.2. Africa 9.4.3. Latin America 10. Competitive Landscape 10.1. Overview 10.2. Competitive Analysis 10.3. Market Share Analysis 10.4. Major Growth Strategy in the Global Low E Glass Market, 10.5. Competitive Benchmarking 10.6. Leading Players in Terms of Number of Developments in the Global Low E Glass Market, 10.7. Key developments and Growth Strategies 10.7.1. New ProductLaunch/Service Deployment 10.7.2. Merger &Acquisitions 10.7.3. Joint Ventures 10.8. Major Players Financial Matrix 10.8.1. Sales & Operating Income,2022 10.8.2. Major Players R&D Expenditure.2022 11. COMPANY PROFILES 11.1. Asahi Glass Co. Ltd., 11.1.1. Company Overview 11.1.2. Financial Overview 11.1.3. Products Offered 11.1.4. Key Developments 11.1.5. SWOT Analysis 11.1.6. Key Strategies 11.2. Saint-Gobain SA, 11.2.1. Company Overview 11.2.2. Financial Overview 11.2.3. Products Offered 11.2.4. Key Developments 11.2.5. SWOT Analysis 11.2.6. Key Strategies 11.3. Corning Inc., 11.3.1. Company Overview 11.3.2. Financial Overview 11.3.3. Products Offered 11.3.4. Key Developments 11.3.5. SWOT Analysis 11.3.6. Key Strategies 11.4. Nippon Sheet Glass Co., Ltd., 11.4.1. Company Overview 11.4.2. Financial Overview 11.4.3. Products Offered 11.4.4. Key Developments 11.4.5. SWOT Analysis 11.4.6. Key Strategies 11.5. Xinyi Glass Holdings Limited, 11.5.1. Company Overview 11.5.2. Financial Overview 11.5.3. Products Offered 11.5.4. Key Developments 11.5.5. SWOT Analysis 11.5.6. Key Strategies 11.6. PPG Industries, Inc., 11.6.1. Company Overview 11.6.2. Financial Overview 11.6.3. Products Offered 11.6.4. Key Developments 11.6.5. SWOT Analysis 11.6.6. Key Strategies 11.7. CSG Holding Co. Ltd., 11.7.1. Company Overview 11.7.2. Financial Overview 11.7.3. Products Offered 11.7.4. Key Developments 11.7.5. SWOT Analysis 11.7.6. Key Strategies 11.8. Taiwan Glass Industry Corporation, 11.8.1. Company Overview 11.8.2. Financial Overview 11.8.3. Products Offered 11.8.4. Key Developments 11.8.5. SWOT Analysis 11.8.6. Key Strategies 11.9. China Glass Holdings Limited, 11.9.1. Company Overview 11.9.2. Financial Overview 11.9.3. Products Offered 11.9.4. Key Developments 11.9.5. SWOT Analysis 11.9.6. Key Strategies 11.10. Sisecam. 11.10.1. Company Overview 11.10.2. Financial Overview 11.10.3. Products Offered 11.10.4. Key Developments 11.10.5. SWOT Analysis 11.10.6. Key Strategies 12. APPENDIX 12.1. References 12.2. Related Reports   LIST OF TABLES
      3. TABLE 1 GLOBAL LOW E GLASS MARKET, SYNOPSIS, 2018-2032
      4. TABLE 2 GLOBAL LOW E GLASS MARKET, ESTIMATES &FORECAST, 2018-2032(USD BILLION)
      5. TABLE 3 GLOBAL LOW E GLASS MARKET,BY GLAZING, 2018-2032 (USD BILLION)
      6. TABLE 4 GLOBAL LOW E GLASS MARKET,BY COATING TYPE, 2018-2032 (USD BILLION)
      7. TABLE 5 GLOBAL LOW E GLASS MARKET,BY END USE, 2018-2032 (USD BILLION)
      8. TABLE 6 NORTH AMERICA: LOW E GLASS MARKET,BY GLAZING, 2018-2032 (USD BILLION)
      9. TABLE 7 NORTH AMERICA: LOW E GLASS MARKET,BY COATING TYPE, 2018-2032 (USD BILLION)
      10. TABLE 8 NORTH AMERICA: LOW E GLASS MARKET,BY END USE, 2018-2032 (USD BILLION)
      11. TABLE 9 US: LOW E GLASS MARKET,BY GLAZING, 2018-2032 (USD BILLION)
      12. TABLE 10 US: LOW E GLASS MARKET,BY COATING TYPE, 2018-2032 (USD BILLION)
      13. TABLE 11 US: LOW E GLASS MARKET,BY END USE, 2018-2032 (USD BILLION)
      14. TABLE 12 CANADA: LOW E GLASS MARKET,BY GLAZING, 2018-2032 (USD BILLION)
      15. TABLE 13 CANADA: LOW E GLASS MARKET,BY COATING TYPE, 2018-2032 (USD BILLION)
      16. TABLE 14 CANADA: LOW E GLASS MARKET,BY END USE, 2018-2032 (USD BILLION)
      17. TABLE 1 EUROPE: LOW E GLASS MARKET,BY GLAZING, 2018-2032 (USD BILLION)
      18. TABLE 2 EUROPE: LOW E GLASS MARKET, BY COATING TYPE , 2018-2032 (USD BILLION)
      19. TABLE 3 EUROPE: LOW E GLASS MARKET, BY END USE, 2018-2032 (USD BILLION)
      20. TABLE 4 GERMANY: LOW E GLASS MARKET,BY GLAZING,2018-2032 (USD BILLION)
      21. TABLE 5 GERMANY: LOW E GLASS MARKET, BY COATING TYPE, 2018-2032 (USD BILLION)
      22. TABLE 6 GERMANY: LOW E GLASS MARKET, BY END USE , 2018-2032 (USD BILLION)
      23. TABLE 7 FRANCE: LOW E GLASS MARKET,BY GLAZING, 2018-2032 (USD BILLION)
      24. TABLE 8 FRANCE: LOW E GLASS MARKET, BY COATING TYPE, 2018-2032 (USD BILLION)
      25. TABLE 9 FRANCE: LOW E GLASS MARKET, BY END USE, 2018-2032 (USD BILLION)
      26. TABLE 10 ITALY: LOW E GLASS MARKET,BY GLAZING, 2018-2032 (USD BILLION)
      27. TABLE 11 ITALY: LOW E GLASS MARKET, BY COATING TYPE, 2018-2032 (USD BILLION)
      28. TABLE 12 ITALY: LOW E GLASS MARKET, BY END USE, 2018-2032 (USD BILLION)
      29. TABLE 13 SPAIN: LOW E GLASS MARKET,BY GLAZING, 2018-2032 (USD BILLION)
      30. TABLE 14 SPAIN: LOW E GLASS MARKET, BY COATING TYPE, 2018-2032 (USD BILLION)
      31. TABLE 15 SPAIN: LOW E GLASS MARKET, BY END USE, 2018-2032 (USD BILLION)
      32. TABLE 16 UK: LOW E GLASS MARKET,BY GLAZING, 2018-2032 (USD BILLION)
      33. TABLE 17 UK: LOW E GLASS MARKET, BY COATING TYPE, 2018-2032 (USD BILLION)
      34. TABLE 18 UK: LOW E GLASS MARKET, BY END USE, 2018-2032 (USD BILLION)
      35. TABLE 19 REST OF EUROPE: LOW E GLASS MARKET,BY GLAZING, 2018-2032 (USD BILLION)
      36. TABLE 20 REST OF EUROPE: LOW E GLASS MARKET, BY COATING TYPE, 2018-2032 (USD BILLION)
      37. TABLE 21 REST OF EUROPE: LOW E GLASS MARKET, BY END USE, 2018-2032 (USD BILLION)
      38. TABLE 22 ASIA-PACIFIC: LOW E GLASS MARKET,BY GLAZING, 2018-2032 (USD BILLION)
      39. TABLE 23 ASIA-PACIFIC: LOW E GLASS MARKET, BY COATING TYPE, 2018-2032 (USD BILLION)
      40. TABLE 24 ASIA-PACIFIC: LOW E GLASS MARKET, BY END USE, 2018-2032 (USD BILLION)
      41. TABLE 25 JAPAN: LOW E GLASS MARKET,BY GLAZING, 2018-2032 (USD BILLION)
      42. TABLE 26 JAPAN: LOW E GLASS MARKET, BY COATING TYPE, 2018-2032 (USD BILLION)
      43. TABLE 27 JAPAN: LOW E GLASS MARKET, BY END USE, 2018-2032 (USD BILLION)
      44. TABLE 28 CHINA: LOW E GLASS MARKET,BY GLAZING, 2018-2032 (USD BILLION)
      45. TABLE 29 CHINA: LOW E GLASS MARKET, BY COATING TYPE, 2018-2032 (USD BILLION)
      46. TABLE 30 CHINA: LOW E GLASS MARKET, BY END USE, 2018-2032 (USD BILLION)
      47. TABLE 31 INDIA: LOW E GLASS MARKET,BY GLAZING, 2018-2032 (USD BILLION)
      48. TABLE 32 INDIA: LOW E GLASS MARKET, BY COATING TYPE, 2018-2032 (USD BILLION)
      49. TABLE 33 INDIA: LOW E GLASS MARKET, BY END USE, 2018-2032 (USD BILLION)
      50. TABLE 34 AUSTRALIA: LOW E GLASS MARKET,BY GLAZING, 2018-2032 (USD BILLION)
      51. TABLE 35 AUSTRALIA: LOW E GLASS MARKET, BY COATING TYPE, 2018-2032 (USD BILLION)
      52. TABLE 36 AUSTRALIA: LOW E GLASS MARKET, BY END USE, 2018-2032 (USD BILLION)
      53. TABLE 37 SOUTH KOREA: LOW E GLASS MARKET,BY GLAZING, 2018-2032 (USD BILLION)
      54. TABLE 38 SOUTH KOREA: LOW E GLASS MARKET, BY COATING TYPE, 2018-2032 (USD BILLION)
      55. TABLE 39 SOUTH KOREA: LOW E GLASS MARKET, BY END USE, 2018-2032 (USD BILLION)
      56. TABLE 40 REST OF ASIA-PACIFIC: LOW E GLASS MARKET,BY GLAZING, 2018-2032 (USD BILLION)
      57. TABLE 41 REST OF ASIA-PACIFIC: LOW E GLASS MARKET, BY COATING TYPE, 2018-2032 (USD BILLION)
      58. TABLE 42 REST OF ASIA-PACIFIC: LOW E GLASS MARKET, BY END USE, 2018-2032 (USD BILLION)
      59. TABLE 43 REST OF THE WORLD: LOW E GLASS MARKET,BY GLAZING, 2018-2032 (USD BILLION)
      60. TABLE 44 REST OF THE WORLD: LOW E GLASS MARKET, BY COATING TYPE, 2018-2032 (USD BILLION)
      61. TABLE 45 REST OF THE WORLD: LOW E GLASS MARKET, BY END USE, 2018-2032 (USD BILLION)
      62. TABLE 46 MIDDLE EAST: LOW E GLASS MARKET,BY GLAZING, 2018-2032 (USD BILLION)
      63. TABLE 47 MIDDLE EAST: LOW E GLASS MARKET, BY COATING TYPE, 2018-2032 (USD BILLION)
      64. TABLE 48 MIDDLE EAST: LOW E GLASS MARKET, BY END USE, 2018-2032 (USD BILLION)
      65. TABLE 49 AFRICA: LOW E GLASS MARKET,BY GLAZING, 2018-2032 (USD BILLION)
      66. TABLE 50 AFRICA: LOW E GLASS MARKET, BY COATING TYPE, 2018-2032 (USD BILLION)
      67. TABLE 51 AFRICA: LOW E GLASS MARKET, BY END USE, 2018-2032 (USD BILLION)
      68. TABLE 52 LATIN AMERICA: LOW E GLASS MARKET,BY GLAZING, 2018-2032 (USD BILLION)
      69. TABLE 53 LATIN AMERICA: LOW E GLASS MARKET, BY COATING TYPE, 2018-2032 (USD BILLION)
      70. TABLE 54 LATIN AMERICA: LOW E GLASS MARKET, BY END USE, 2018-2032 (USD BILLION) LIST OF FIGURES
      71. FIGURE 1 RESEARCH PROCESS
      72. FIGURE 2 MARKET STRUCTURE FOR THE GLOBAL LOW E GLASS MARKET
      73. FIGURE 3 MARKET DYNAMICS FOR THE GLOBAL LOW E GLASS MARKET
      74. FIGURE 4 GLOBAL LOW E GLASS MARKET, SHARE (%), BY GLAZING, 2022
      75. FIGURE 5 GLOBAL LOW E GLASS MARKET, SHARE (%), BY COATING TYPE, 2022
      76. FIGURE 6 GLOBAL LOW E GLASS MARKET, SHARE (%), BY END USE, 2022
      77. FIGURE 7 GLOBAL LOW E GLASS MARKET, SHARE (%), BY REGION, 2022
      78. FIGURE 8 NORTH AMERICA: LOW E GLASS MARKET, SHARE (%), BY REGION, 2022
      79. FIGURE 9 EUROPE: LOW E GLASS MARKET, SHARE (%), BY REGION, 2022
      80. FIGURE 10 ASIA-PACIFIC: LOW E GLASS MARKET, SHARE (%), BY REGION, 2022
      81. FIGURE 11 REST OF THE WORLD: LOW E GLASS MARKET, SHARE (%), BY REGION, 2022
      82. FIGURE 12 GLOBAL LOW E GLASS MARKET: COMPANY SHARE ANALYSIS, 2022 (%)
      83. FIGURE 13 ASAHI GLASS CO. LTD.: FINANCIAL OVERVIEW SNAPSHOT
      84. FIGURE 14 ASAHI GLASS CO. LTD.: SWOT ANALYSIS
      85. FIGURE 15 SAINT-GOBAIN SA:FINANCIAL OVERVIEW SNAPSHOT
      86. FIGURE 16 SAINT-GOBAIN SA:SWOT ANALYSIS
      87. FIGURE 17 CORNING INC.:FINANCIAL OVERVIEW SNAPSHOT
      88. FIGURE 18 CORNING INC.:SWOT ANALYSIS
      89. FIGURE 19 NIPPON SHEET GLASS CO., LTD.: FINANCIAL OVERVIEW SNAPSHOT
      90. FIGURE 20 NIPPON SHEET GLASS CO., LTD.:SWOT ANALYSIS
      91. FIGURE 21 XINYI GLASS HOLDINGS LIMITED.:FINANCIAL OVERVIEW SNAPSHOT
      92. FIGURE 22 XINYI GLASS HOLDINGS LIMITED.:SWOT ANALYSIS
      93. FIGURE 23 PPG INDUSTRIES, INC.:FINANCIAL OVERVIEW SNAPSHOT
      94. FIGURE 24 PPG INDUSTRIES, INC.:SWOT ANALYSIS
      95. FIGURE 25 CSG HOLDING CO. LTD.: FINANCIAL OVERVIEW SNAPSHOT
      96. FIGURE 26 CSG HOLDING CO. LTD.: SWOT ANALYSIS
      97. FIGURE 27 TAIWAN GLASS INDUSTRY CORPORATION: FINANCIAL OVERVIEW SNAPSHOT
      98. FIGURE 28 TAIWAN GLASS INDUSTRY CORPORATION: SWOT ANALYSIS
      99. FIGURE 29 CHINA GLASS HOLDINGS LIMITED: FINANCIAL OVERVIEW SNAPSHOT
      100. FIGURE 30 CHINA GLASS HOLDINGS LIMITED: SWOT ANALYSIS
      101. FIGURE 31 SISECAM:FINANCIAL OVERVIEW SNAPSHOT
      102. FIGURE 32 SISECAM:SWOT ANALYSIS

    Low E-glass Market Segmentation

    Low E-glass Market By Glazing Outlook (USD Billion, 2018-2032)

    • Single Glazing
    • Double Glazing
    • Triple Glazing

    Low E-glass Market By Coating Type Outlook (USD Billion, 2018-2032)

    • Solar control low-E coating
    • Passive low-E coating
    • Others

    Low E-glass Market By End use Outlook (USD Billion, 2018-2032)

    • Building and Construction
    • Automotive
    • Others

    Low E-glass Market Regional Outlook (USD Billion, 2018-2032)

    • North America Outlook (USD Billion, 2018-2032)

      • North America Low E-glass Market by Glazing
    • Single Glazing
    • Double Glazing
    • Triple Glazing
      • North America Low E-glass Market by Coating Type
        • Solar control low-E coating
        • Passive low-E coating
        • Others
      • North America Low E-glass Market by End use
        • Building and Construction
        • Automotive
        • Others
      • US Outlook (USD Billion, 2018-2032)

      • US Low E-glass Market by Glazing
    • Single Glazing
    • Double Glazing
    • Triple Glazing
      • US Low E-glass Market by Coating Type
        • Solar control low-E coating
        • Passive low-E coating
        • Others
      • US Low E-glass Market by End use
        • Building and Construction
        • Automotive
        • Others
      • CANADA Outlook (USD Billion, 2018-2032)

      • CANADA Low E-glass Market by Glazing
    • Single Glazing
    • Double Glazing
    • Triple Glazing
      • CANADA Low E-glass Market by Coating Type
        • Solar control low-E coating
        • Passive low-E coating
        • Others
      • CANADA Low E-glass Market by End use
        • Building and Construction
        • Automotive
        • Others
    • Europe Outlook (USD Billion, 2018-2032)

      • Europe Low E-glass Market by Glazing
    • Single Glazing
    • Double Glazing
    • Triple Glazing
      • Europe Low E-glass Market by Coating Type
        • Solar control low-E coating
        • Passive low-E coating
        • Others
      • Europe Low E-glass Market by End use
        • Building and Construction
        • Automotive
        • Others
      • Germany Outlook (USD Billion, 2018-2032)

      • Germany Low E-glass Market by Glazing
    • Single Glazing
    • Double Glazing
    • Triple Glazing
      • Germany Low E-glass Market by Coating Type
        • Solar control low-E coating
        • Passive low-E coating
        • Others
      • Germany Low E-glass Market by End use
        • Building and Construction
        • Automotive
        • Others
      • France Outlook (USD Billion, 2018-2032)

      • France Low E-glass Market by Glazing
    • Single Glazing
    • Double Glazing
    • Triple Glazing
      • France Low E-glass Market by Coating Type
        • Solar control low-E coating
        • Passive low-E coating
        • Others
      • France Low E-glass Market by End use
        • Building and Construction
        • Automotive
        • Others
      • UK Outlook (USD Billion, 2018-2032)

      • UK Low E-glass Market by Glazing
    • Single Glazing
    • Double Glazing
    • Triple Glazing
      • UK Low E-glass Market by Coating Type
        • Solar control low-E coating
        • Passive low-E coating
        • Others
      • UK Low E-glass Market by End use
        • Building and Construction
        • Automotive
        • Others
      • ITALY Outlook (USD Billion, 2018-2032)

      • ITALY Low E-glass Market by Glazing
    • Single Glazing
    • Double Glazing
    • Triple Glazing
      • ITALY Low E-glass Market by Coating Type
        • Solar control low-E coating
        • Passive low-E coating
        • Others
      • ITALY Low E-glass Market by End use
        • Building and Construction
        • Automotive
        • Others
      • SPAIN Outlook (USD Billion, 2018-2032)

      • Spain Low E-glass Market by Glazing
    • Single Glazing
    • Double Glazing
    • Triple Glazing
      • Spain Low E-glass Market by Coating Type
        • Solar control low-E coating
        • Passive low-E coating
        • Others
      • Spain Low E-glass Market by End use
        • Building and Construction
        • Automotive
        • Others
      • Rest Of Europe Outlook (USD Billion, 2018-2032)

      • Rest Of Europe Low E-glass Market by Glazing
    • Single Glazing
    • Double Glazing
    • Triple Glazing
      • REST OF EUROPE Low E-glass Market by Coating Type
        • Solar control low-E coating
        • Passive low-E coating
        • Others
      • REST OF EUROPE Low E-glass Market by End use
        • Building and Construction
        • Automotive
        • Others
    • Asia-Pacific Outlook (USD Billion, 2018-2032)

      • Asia-Pacific Low E-glass Market by Glazing
    • Single Glazing
    • Double Glazing
    • Triple Glazing
      • Asia-Pacific Low E-glass Market by Coating Type
        • Solar control low-E coating
        • Passive low-E coating
        • Others
      • Asia-Pacific Low E-glass Market by End use
        • Building and Construction
        • Automotive
        • Others
      • China Outlook (USD Billion, 2018-2032)

      • China Low E-glass Market by Glazing
    • Single Glazing
    • Double Glazing
    • Triple Glazing
      • China Low E-glass Market by Coating Type
        • Solar control low-E coating
        • Passive low-E coating
        • Others
      • China Low E-glass Market by End use
        • Building and Construction
        • Automotive
        • Others
      • Japan Outlook (USD Billion, 2018-2032)

      • Japan Low E-glass Market by Glazing
    • Single Glazing
    • Double Glazing
    • Triple Glazing
      • Japan Low E-glass Market by Coating Type
        • Solar control low-E coating
        • Passive low-E coating
        • Others
      • Japan Low E-glass Market by End use
        • Building and Construction
        • Automotive
        • Others
      • India Outlook (USD Billion, 2018-2032)

      • India Low E-glass Market by Glazing
    • Single Glazing
    • Double Glazing
    • Triple Glazing
      • India Low E-glass Market by Coating Type
        • Solar control low-E coating
        • Passive low-E coating
        • Others
      • India Low E-glass Market by End use
        • Building and Construction
        • Automotive
        • Others
      • Australia Outlook (USD Billion, 2018-2032)

      • Australia Low E-glass Market by Glazing
    • Single Glazing
    • Double Glazing
    • Triple Glazing
      • Australia Low E-glass Market by Coating Type
        • Solar control low-E coating
        • Passive low-E coating
        • Others
      • Australia Low E-glass Market by End use
        • Building and Construction
        • Automotive
        • Others
      • Rest of Asia-Pacific Outlook (USD Billion, 2018-2032)

      • Rest of Asia-Pacific Low E-glass Market by Glazing
    • Single Glazing
    • Double Glazing
    • Triple Glazing
      • Rest of Asia-Pacific Low E-glass Market by Coating Type
        • Solar control low-E coating
        • Passive low-E coating
        • Others
      • Rest of Asia-Pacific Low E-glass Market by End use
        • Building and Construction
        • Automotive
        • Others
    • Rest of the World Outlook (USD Billion, 2018-2032)

      • Rest of the World Low E-glass Market by Glazing
    • Single Glazing
    • Double Glazing
    • Triple Glazing
      • Rest of the World Low E-glass Market by Coating Type
        • Solar control low-E coating
        • Passive low-E coating
        • Others
      • Rest of the World Low E-glass Market by End use
        • Building and Construction
        • Automotive
        • Others
      • Middle East Outlook (USD Billion, 2018-2032)

      • Middle East Low E-glass Market by Glazing
    • Single Glazing
    • Double Glazing
    • Triple Glazing
      • Middle East Low E-glass Market by Coating Type
        • Solar control low-E coating
        • Passive low-E coating
        • Others
      • Middle East Low E-glass Market by End use
        • Building and Construction
        • Automotive
        • Others
      • Africa Outlook (USD Billion, 2018-2032)

      • Africa Low E-glass Market by Glazing
    • Single Glazing
    • Double Glazing
    • Triple Glazing
      • Africa Low E-glass Market by Coating Type
        • Solar control low-E coating
        • Passive low-E coating
        • Others
      • Africa Low E-glass Market by End use
        • Building and Construction
        • Automotive
        • Others
      • Latin America Outlook (USD Billion, 2018-2032)

      • Latin America Low E-glass Market by Glazing
    • Single Glazing
    • Double Glazing
    • Triple Glazing
      • Latin America Low E-glass Market by Coating Type
        • Solar control low-E coating
        • Passive low-E coating
        • Others
      • Latin America Low E-glass Market by End use
        • Building and Construction
        • Automotive
        • Others
    Infographic

    Free Sample Request

    Kindly complete the form below to receive a free sample of this Report

    Get Free Sample

    Customer Strories

    “I am very pleased with how market segments have been defined in a relevant way for my purposes (such as "Portable Freezers & refrigerators" and "last-mile"). In general the report is well structured. Thanks very much for your efforts.”

    Victoria Milne

    Founder
    Case Study
    Chemicals and Materials