Lung Cancer Market (2026 - 2035)

Lung Cancer Market Research Report: Size, Share, Trend Analysis By Treatment Type (Chemotherapy, Radiation Therapy, Targeted Therapy, Immunotherapy), By Diagnosis Type (Imaging Tests, Biopsy, Sputum Cytology, Blood Tests), By Patient Demographics (Age, Gender, Smoking History, Geographic Location), By Stage of Cancer (Early Stage, Locally Advanced Stage, Metastatic Stage) and By Regional (North America, Europe, South America, Asia Pacific, Middle East and Africa) - Growth Outlook & Industry Forecast 2025 To 2035

Forecast Period
2026-2035
CAGR
11.5%
2025 Market Size
USD 29.84 Billion
2035 Market Size
USD 89.22 Billion
Healthcare ● Updated August 24, 2026 Report ID: MRFR/HC/0679-CR | Pages: 200 | Author: Nidhi Mandole, Rahul Gotadki

Lung Cancer Market Summary

The Lung Cancer Therapeutics Market reached USD 29.84 billion in 2025 and opens the forecast window at USD 33.51 billion in 2026, tracking toward USD 89.22 billion by 2035 at an 11.5% CAGR. Two catalysts anchor that trajectory. Regulators cleared an unusually dense run of thoracic oncology approvals between late 2023 and mid-2025, and payers in Asia-Pacific widened formulary coverage for high-cost oncology agents, converting clinical demand into paid treatment volume [4][15].

The treatment practice is being rebuilt. The backbone of thoracic oncology for 30 years, platinum doublet chemotherapy, is slowly losing its first-line position to checkpoint inhibitors, mutation-matched oral medicines and, from 2024, bispecific T-cell engagers. Next-generation sequencing has been transferred from academic centers to community practice and full molecular profiling is considered the standard of treatment upon diagnosis by guideline organizations and not a specialized add-on [8][10]. That one change alone accounts for about a quarter of newly diagnosed non-small cell patients being sent to branded targeted regimens they wouldn’t have received in 2018.

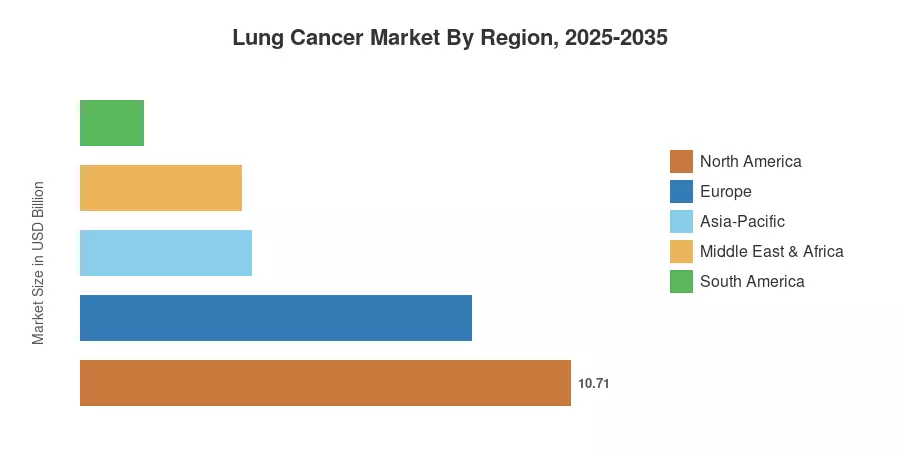
Geography still concentrates the wealth. North America is expected to contribute 35.9% of the total revenue share of the Lung Cancer Therapeutics Market in 2025 and is backed by early launch access and depth of commercial reimbursement, while Asia-Pacific is expected to compound at 12.5% through 2035 owing to the national insurance listings in China, Japan and South Korea. Europe is second, at USD 8.54 billion in 2025, as the region’s new unified clinical assessment process is changing launch sequencing [7]. In the Lung Cancer Therapeutics Market, companies that have a differentiated asset and a credible access plan in the second-tier economies are going to be rewarded.


Key Report Takeaways

• By Disease Type

  • Non-small cell lung cancer commanded 71.3% of 2025 revenue in the Lung Cancer Therapeutics Market, reflecting its share of global incidence and the density of approved targeted options.
  • Small cell lung cancer is the faster mover at a 12.2% CAGR to 2035, unlocked by DLL3-directed bispecifics after a long innovation drought.


• By Treatment Modality

  • Chemotherapy still accounts for 39.8% of modality revenue, largely as a combination partner rather than a standalone regimen.

• By Drug Class

  • Small-molecule agents held a 59.5% share in 2025, sustained by successive generations of EGFR, ALK, ROS1 and KRAS inhibitors.
  • Biologics and biosimilars grow fastest at a 12.3% CAGR, as antibody-drug conjugates and bispecifics enter earlier treatment lines.


• By Distribution Channel

  • Hospital pharmacies dispensed 64.4% of the 2025 value in the Lung Cancer Therapeutics Market, a function of infusion-based administration.

• By Region

  • North America contributed USD 10.71 billion in 2025, the largest single-region pool
  • Asia-Pacific posts the steepest trajectory at 12.5% CAGR through 2035
  • Middle East & Africa remains small but expands at 11.8% CAGR as Gulf states build national oncology networks


Market Size and Forecast (2021–2035)

Estimates below combine bottom-up modelling of branded and generic thoracic oncology revenue disclosed in company annual filings, incidence and mortality inputs from IARC and national cancer registries, treatment-pattern data from guideline bodies, and reimbursement listings from major national payers. Historical years are reconciled against reported product-level sales; forecast years apply penetration curves by line of therapy and region.
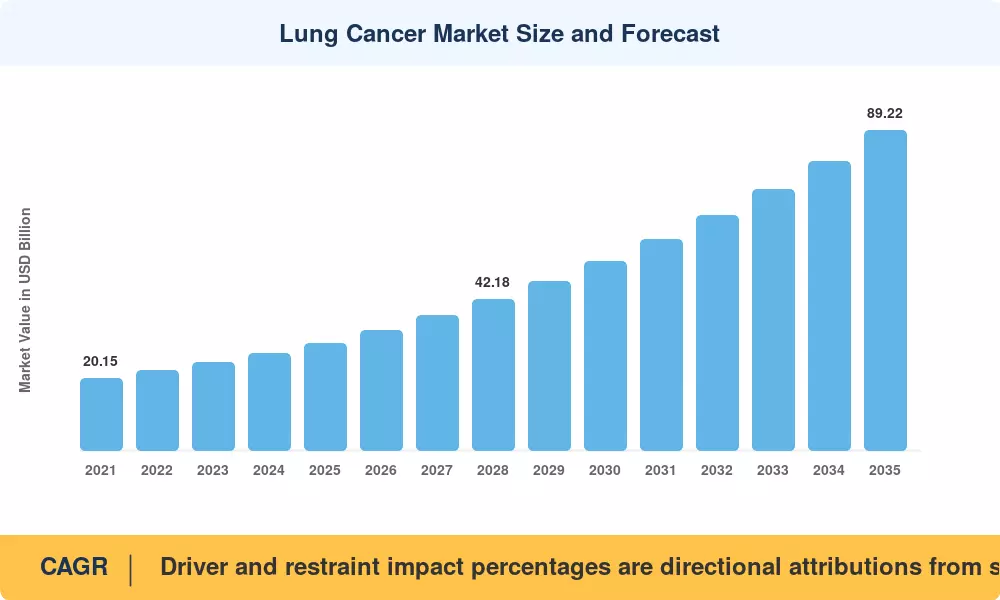
Lung Cancer Market Size and Forecast
Our Impact
Enabled $4.3B Revenue Impact for Fortune 500 and Leading Multinationals
Partnering with 2000+ Global Organizations Each Year
30K+ Citations by Top-Tier Firms in the Industry

Driver Impact Analysis

Driver ~% Impact on CAGR Geographic Relevance Impact Timeline
Immuno-oncology and bispecific pipeline expansion +2.4 pp Global Long-term (≥4 yr)
Mainstreaming of biomarker and NGS testing +1.9 pp North America, Europe, Asia-Pacific Medium-term (2–4 yr)
Accelerated regulatory pathways and Project Orbis +1.6 pp Global Short-term (≤2 yr)
Reimbursement expansion across Asia-Pacific and Latin America +1.5 pp Asia-Pacific, South America Medium-term (2–4 yr)
Organised lung screening lifting early-stage diagnosis +1.3 pp North America, Europe Long-term (≥4 yr)
Antibody-drug conjugate and combination platform launches +1.2 pp Global Medium-term (2–4 yr)
Rising incidence and population ageing +1.1 pp Global Long-term (≥4 yr)


Immuno-oncology and Bispecific Engagers Reset the Ceiling

Checkpoint blockade lifted five-year survival in advanced disease from single digits to roughly 15–20% in PD-L1-high populations, and the Lung Cancer Therapeutics Market has spent the last three years monetising that durability. The more consequential development is bispecific engagement. Amgen's tarlatamab, cleared by the US Food and Drug Administration in May 2024 as the first DLL3-targeting T-cell engager, addressed a small cell population that had seen no mechanistically novel approval in over two decades [4]. Longer treatment duration compounds directly into revenue: each additional month of median progression-free survival across a US small cell population of roughly 30,000 annual cases translates into meaningful incremental spend.

Biomarker Testing Converts Diagnosis into Branded Prescriptions

Comprehensive genomic profiling is now the gatekeeper for most of the high-value inventory. Guideline bodies recommend broad panel testing at diagnosis for all non-squamous advanced non-small cell patients, covering EGFR, ALK, ROS1, BRAF, NTRK, RET, MET and KRAS G12C [8][10]. Testing rates in US academic centres exceed 80% but sit closer to 50–60% in community oncology, and that gap is the single largest recoverable pool of branded prescriptions in the market. Every percentage point of testing penetration converts patients from generic platinum doublets costing a few thousand dollars per course to targeted regimens priced in the range of USD 15,000–20,000 per month.

Regulatory Acceleration Compresses Time to Revenue

Approval velocity has become a competitive variable in its own right. Project Orbis enables concurrent submission and review across the United States, Australia, Canada, the United Kingdom, Singapore, Switzerland, Brazil and Israel, shortening the gap between first and follow-on market entry from years to months [5]. Repotrectinib for ROS1-positive disease, ensartinib for ALK-positive disease and zenocutuzumab for NRG1 fusions all reached patients through accelerated mechanisms between November 2023 and December 2024 [4]. Shorter approval cycles mean more of a molecule's patent life is spent selling rather than waiting.

Screening Programmes Enlarge the Treatable Population

Stage at diagnosis determines almost everything about lifetime treatment value. US Preventive Services Task Force criteria extended annual low-dose CT screening to adults aged 50–80 with a 20 pack-year history, roughly doubling the eligible cohort against prior guidance [12]. England's Targeted Lung Health Check programme, now scaling to national coverage, has shifted a majority of detected cancers to stage I or II in participating areas [14]. Early-stage detection redirects patients toward adjuvant and perioperative regimens — a segment that barely existed commercially in 2019.


Restraints Impact Analysis

Restraint impacts are modelled as directional drags on the growth rate rather than subtractive line items. Several operate with a lag, and their severity depends heavily on regional payer posture and patent timing.

Restraint ~% Impact on CAGR Geographic Relevance Impact Timeline
Payer price pressure and value-based contracting −1.8 pp North America, Europe Medium-term (2–4 yr)
Patent expiries and biosimilar erosion −1.6 pp Global Long-term (≥4 yr)
Diagnostic and access gaps in lower-income economies −1.2 pp South America, Middle East & Africa Long-term (≥4 yr)
Acquired resistance limiting therapy duration −1.0 pp Global Medium-term (2–4 yr)
Trial recruitment and clinical site capacity limits −0.8 pp Global Short-term (≤2 yr)


Payers Are Rewriting the Pricing Contract

Reimbursement authorities no longer accept list price as the starting point. The Medicare Drug Price Negotiation Program established under the Inflation Reduction Act brought direct government price setting into US oncology for the first time, and selected-drug negotiated prices take effect on a rolling basis from 2026 [13]. Across Europe, the Health Technology Assessment Regulation began applying to new oncology medicines in January 2025, replacing duplicated national clinical dossiers with a single joint clinical assessment [7]. Manufacturers gain efficiency; they also lose the ability to sequence launches into softer markets first.

The Patent Cliff Is Now Visible

Several of the largest revenue contributors face loss of exclusivity inside the forecast window, and the checkpoint inhibitor class in particular carries concentrated exposure early in the next decade [19][20]. Biosimilar competition in oncology has historically eroded originator price by 30–50% within two years of entry. That mathematics explains the current wave of combination-platform dealmaking — buying growth assets before the cliff arrives is cheaper than defending price afterwards.

Resistance Caps Treatment Duration

Nearly every targeted agent eventually fails. Median progression-free survival on third-generation EGFR inhibitors runs in the region of 16–19 months in first-line use, after which resistance mechanisms including MET amplification and histologic transformation force a switch [10]. Duration ceilings limit per-patient revenue and push spend into later lines where pricing power is weaker, and patient fitness is lower.


Lung Cancer Market Opportunities

Perioperative and Early-Stage Treatment

Neoadjuvant and adjuvant immunotherapy opens a commercially young segment targeting populations larger than metastatic disease, which accounts for only 23% of initial diagnoses. As screening programmes mature across North America and Europe, stage I to III patients represent a growing share of the global disease burden. Companies capturing perioperative label extensions secure patient engagement years earlier in the clinical course.


Antibody-Drug Conjugates in Biomarker-Undefined Populations

Antibody-drug conjugates targeting TROP2, HER3, and MET provide a vital therapeutic route into the substantial patient population lacking actionable driver mutations—roughly 55 percent of non-small cell lung cancer cases. This biomarker-undefined cohort defaults largely to chemo-immunotherapy regimens, constituting the single largest unmet commercial opportunity within the broader global market governed by World Health Organization statistics.


Emerging-Market Access Through Tiered Pricing

China, India, Brazil, and ASEAN economies account for a massive disproportionate share of global incidence out of the estimated 2.5 million annual cases worldwide, but capture a fraction of global expenditure. India's regulatory framework under the Drugs Controller General permits local clinical trial waivers for critical categories like orphan drugs affecting under 500,000 persons, significantly shortening entry timelines.


Diagnostics-Linked Business Models

Companion diagnostics have shifted from basic regulatory obligations into high-value data assets. Sponsors funding community-site next-generation sequencing capacity gain direct access to biomarker-positive patients. With guideline-recommended broad panel testing identifying actionable mutations in roughly 45 % of non-squamous populations, structured diagnostic support programs efficiently convert regional testing infrastructure into robust clinical demand.


Lung Cancer Market Future Outlook

Machine Learning in Patient Selection

Algorithmic analysis of digital pathology and radiology is beginning to predict treatment response ahead of molecular results, and several regulators have cleared computational pathology tools for clinical decision support. Tighter selection raises response rates, which strengthens the health-economic case that payers now demand at launch [7][13]. Better selection also shrinks the treated population per indication — a genuine tension for volume forecasts.

Combination Platforms as the Competitive Unit

Single-agent differentiation is disappearing. Value increasingly accrues to companies controlling a backbone therapy plus multiple combinable partners, because the combination is what gets approved and reimbursed. Consolidation over 2023–2025, including Bristol Myers Squibb's acquisition of Mirati, followed exactly this logic [21].

Biosimilar Transition in Checkpoint Inhibition

Loss of exclusivity across the PD-1/PD-L1 class in the early 2030s will restructure pricing for the largest revenue pool in the market [19][20]. Precedent from trastuzumab and bevacizumab suggests originator price erosion of 30–50% within 24 months, with volume expanding into previously price-excluded geographies. Total treated patients rise; total class revenue does not.

Prevention Economics and Tobacco Policy

Lung cancer remains the leading cause of cancer death worldwide, with IARC recording approximately 2.5 million new cases in 2022 [1]. Sustained declines in smoking prevalence across high-income countries will slow incidence growth after 2030, while rising diagnoses among never-smokers — particularly women in East Asia — shift the biomarker mix toward targetable alterations. Demand does not fall so much as change composition.


Lung Cancer Market Segmentation

By Disease Type

Segment Metric Primary Demand Driver
Non-Small Cell Lung Cancer 71.3% share (2025) Incidence dominance and dense targeted-agent pipeline
Small Cell Lung Cancer 12.2% CAGR (2026–2035) DLL3 bispecific engagers reopening a stalled category
Others USD 1.34 Billion (2025) Mesothelioma and rare thoracic tumour regimens


Non-small cell disease carries the Lung Cancer Therapeutics Market because it carries the incidence and the biology. Roughly 85% of diagnoses are non-small cell, and the subtype hosts almost every actionable driver alteration approved to date [3][8]. Small cell disease tells the more interesting growth story. After decades in which platinum-etoposide defined the standard, checkpoint inhibitor addition and then DLL3-directed bispecific approval in 2024 created two new revenue layers in under five years [4].

By Treatment Modality

Segment Metric Primary Demand Driver
Chemotherapy 39.8% share (2025) Combination backbone role across most first-line regimens
Immunotherapy 12.1% CAGR (2026–2035) Perioperative expansion and durable response profiles
Targeted Therapy USD 8.16 Billion (2025) Biomarker testing penetration in community oncology
Others 5.4% share (2025) Radiopharmaceuticals and supportive care agents


Chemotherapy's persistent share (39.8% share (2025)) within the Lung Cancer Therapeutics Market misleads if read as stasis. Most of that volume now sits inside combination protocols alongside a checkpoint inhibitor or, following the FLAURA2 approval in February 2024, alongside a third-generation EGFR inhibitor [4]. Immunotherapy compounds fastest (12.1% CAGR (2026–2035))because its addressable population keeps expanding backward into earlier disease stages where patient numbers are larger, and treatment duration is defined by protocol rather than progression.

By Drug Class

Segment Metric Primary Demand Driver
Small-Molecule Drugs 59.5% share (2025) Oral targeted agents across EGFR, ALK, ROS1, KRAS
Biologics and Biosimilars 12.3% CAGR (2026–2035) Antibody-drug conjugates and bispecific entry


Small molecules dominate with a 59.5% share (2025) on convenience and breadth. Oral dosing removes infusion-chair dependency, which matters enormously in health systems with constrained day-unit capacity, and successive inhibitor generations have kept the class commercially fresh. Biologics & biosimilars with 12.3% CAGR grow faster from a smaller base as ADCs move toward earlier lines and bispecifics establish themselves in small cell disease [4].

By Distribution Channel

Segment Metric Primary Demand Driver
Hospital Pharmacies 64.4% share (2025) Infusion administration and REMS-controlled agents
Retail Pharmacies 12.0% CAGR (2026–2035) Oral targeted therapy shifting dispensing outward
Online / Specialty Pharmacies USD 2.61 Billion (2025) Home delivery and adherence programme integration


Hospital Pharmacies dominate the distribution channel with a 64.4% market share due to infusion administration and REMS-controlled agents. Meanwhile, Retail Pharmacies emerge as the fastest-growing segment with a projected 12.0% CAGR (2026–2035) driven by a shift toward oral targeted therapies. Online and specialty pharmacies account for USD 2.61 billion, supporting home delivery and adherence programs.

By Line of Therapy

Segment Metric Primary Demand Driver
First-Line 51.0% share (2025) Largest patient cohort and highest treatment intensity
Second-Line USD 8.95 Billion (2025) Resistance-driven switching after progression
Third-Line and Later 12.4% CAGR (2026–2035) Improved survival keeping patients treatable longer


First-line, with 51.0% share (2025) share reflects a simple funnel: every treated patient passes through it, and fewer reach each subsequent line. Later-line growth is a survival dividend — patients who once died before a third regimen now live long enough to receive one, and the Lung Cancer Therapeutics Market captures that extension as incremental revenue.


Regional Market Share Analysis

Region Metric (2025) Primary Investment Themes
North America 35.9% share Early launch access, perioperative expansion, community NGS build-out
Europe USD 8.54 Billion Joint clinical assessment readiness, screening rollout, biosimilar preparation
Asia-Pacific 12.5% CAGR (2026–2035) National reimbursement listings, domestic innovator scale-up, EGFR-enriched epidemiology
South America USD 1.37 Billion Public tender participation, tiered pricing, diagnostic capacity
Middle East & Africa 11.8% CAGR (2026–2035) National oncology network build, Gulf specialty centres
Total USD 29.84 Billion

Regional performance in the Lung Cancer Therapeutics Market tracks three variables: speed of regulatory access, depth of reimbursement, and community-level testing infrastructure.


North America

Country Metric Key Driver
US 88.4% share of region Commercial payer breadth and first-launch status
Canada 10.9% CAGR (2026–2035) pCPA joint negotiation improving listing speed
Mexico USD 0.48 Billion IMSS oncology formulary expansion


Access velocity is the region's defining advantage. US patients typically reach a new thoracic oncology agent within weeks of approval, and the Food and Drug Administration's oncology review programmes have kept that lead intact [5]. Countervailing pressure is arriving through Medicare price negotiation, which reframes long-term revenue expectations for high-volume oncology brands [13].

Europe

Country Metric Key Driver
Germany 22.6% share of region AMNOG launch-price freedom in year one
UK 10.6% CAGR (2026–2035) Targeted Lung Health Check national rollout
France USD 1.22 Billion Early access authorisation scheme
Italy 11.9% share of region AIFA innovative-medicines fund
Spain USD 0.71 Billion Regional oncology network consolidation
Nordic Countries 10.4% CAGR (2026–2035) Population-registry-driven precision oncology
Russia USD 0.39 Billion Domestic production and import substitution
Rest of Europe 9.8% share of region Central and Eastern European access catch-up


Assessment mechanics changed materially in 2025. The European Union's Health Technology Assessment Regulation now requires a single joint clinical assessment for new oncology medicines, consolidating evidence review that member states previously duplicated [7]. Pricing remains national, so the practical effect is faster clinical validation followed by unchanged payer bargaining — a modest net acceleration for well-evidenced assets and a harder road for those relying on single-arm data.

Asia-Pacific

Country Metric Key Driver
China 44.8% share of region NRDL listings and large EGFR-mutant population
India 13.6% CAGR (2026–2035) Waiver pathway for reference-approved drugs
Japan USD 2.14 Billion Universal coverage and rapid Chuikyo listing
South Korea 8.9% share of region HIRA reimbursement and domestic biotech scale
ASEAN 12.8% CAGR (2026–2035) Expanding private insurance and specialty centres
Rest of Asia-Pacific USD 0.42 Billion Australia PBS listings


Epidemiology gives the region structural advantage. EGFR mutation prevalence in East Asian non-small cell populations runs roughly 40–50%, against 10–15% in Western cohorts, concentrating demand for oral targeted agents where the region is also building domestic manufacturing depth [1][16]. China's annual reimbursement negotiation cycle trades steep price concessions for immediate national volume, a bargain that has repeatedly proven accretive for manufacturers willing to accept it [15].

South America

Country Metric Key Driver
Brazil 58.2% share of region ANVISA participation in Project Orbis
Argentina USD 0.21 Billion Private health plan oncology coverage
Rest of South America 11.4% CAGR (2026–2035) Chile and Colombia public tender growth


Brazil anchors the region and increasingly reviews oncology submissions in parallel with the United States through Orbis participation [5]. Public-sector procurement still runs on tender pricing that compresses margins, so most manufacturers operate a two-track model: negotiated supply into public systems, premium positioning in the private insurance segment.

Middle East & Africa

Country Metric Key Driver
Saudi Arabia 31.4% share of region Vision 2030 healthcare capacity investment
UAE USD 0.24 Billion Medical tourism and specialty oncology centres
South Africa 12.1% CAGR (2026–2035) NHI phased rollout and private oncology networks
Egypt USD 0.11 Billion Universal Health Insurance expansion
Rest of MEA 16.8% share of region Regional referral centre development


Gulf states are building the infrastructure first, and the demand follows. Saudi Arabia's health transformation programme has funded tertiary oncology capacity and molecular pathology laboratories at a pace that outstrips regional peers, and registration timelines have shortened accordingly. Sub-Saharan access remains constrained less by drug price than by absent diagnostic pathology and radiotherapy capacity [25].


Lung Cancer Market By Region, 2025-2035

Competitive Benchmarking

Concentration sits in the moderate band. The estimated Herfindahl-Hirschman Index falls near 1,150, with the top five companies holding roughly 58–65% of 2025 revenue. Structure is barbell-shaped: a handful of large-cap franchises anchored on checkpoint inhibitors and EGFR portfolios, alongside a long tail of specialists holding single mutation-defined niches. Competition increasingly runs through combination rights and companion diagnostics rather than head-to-head monotherapy comparison.

Company Est. Revenue Share Range Key Offerings for Lung Cancer Therapeutics Market Strategic Positioning
AstraZeneca ~17–21% Osimertinib franchise, durvalumab, ADC pipeline Deepest EGFR portfolio; perioperative and stage III label breadth [18]
Merck & Co. ~15–19% Pembrolizumab across NSCLC lines Checkpoint volume leader; heavy 2030s exclusivity exposure [19]
Roche / Genentech ~9–12% Atezolizumab, alectinib, entrectinib Integrated diagnostics-plus-therapeutics model [20]
Bristol Myers Squibb ~7–10% Nivolumab, ipilimumab, repotrectinib, adagrasib Combination immunotherapy plus KRAS/ROS1 assets post-Mirati [21]
Johnson & Johnson ~5–8% Amivantamab, lazertinib Chemotherapy-free EGFR first-line positioning [22]
Eli Lilly ~4–6% Ramucirumab, selpercatinib, ensartinib RET and ALK niche leadership
Amgen ~3–5% Sotorasib, tarlatamab First-mover in DLL3 bispecifics and KRAS G12C [23]
Novartis ~3–5% Dabrafenib-trametinib, capmatinib BRAF and MET-directed specialist
Pfizer ~3–5% Lorlatinib, crizotinib, dacomitinib Established ALK franchise with long-duration data
Takeda ~2–4% Brigatinib, mobocertinib legacy assets Focused ALK presence with Asia-Pacific strength
Daiichi Sankyo ~2–4% HER3 and TROP2 ADC programmes ADC platform depth via partnered development
Boehringer Ingelheim ~1–3% Afatinib, nintedanib, HER2 programmes Legacy EGFR base plus emerging exon 20 work


Recent News & Developments

  • Bristol Myers Squibb (November 2023): The Food and Drug Administration granted accelerated approval to repotrectinib for ROS1-positive metastatic non-small cell disease, extending options for patients progressing on earlier ROS1 inhibitors [4]
  • Bristol Myers Squibb (January 2024): Completed its acquisition of Mirati Therapeutics, adding the KRAS G12C inhibitor adagrasib and an associated discovery platform to an immuno-oncology-heavy portfolio [21]
  • AstraZeneca (February 2024): Secured US approval for osimertinib in combination with platinum-based chemotherapy in EGFR-mutated advanced disease on the strength of the FLAURA2 trial, establishing a higher-intensity first-line option [4][18]
  • Amgen (May 2024): Received accelerated approval for tarlatamab in extensive-stage small cell disease, the first DLL3-targeting bispecific T-cell engager cleared in the indication [4][23]
  • Johnson & Johnson (August 2024): Won approval for lazertinib in combination with amivantamab as a chemotherapy-free first-line regimen for EGFR exon 19 deletion and L858R mutations [4][22]
  • AstraZeneca (September 2024): Gained approval for osimertinib in unresectable stage III EGFR-mutated disease following chemoradiotherapy, based on the LAURA study, opening an earlier-stage revenue pool [4]
  • Merus / Partner Therapeutics (December 2024): Zenocutuzumab received accelerated approval for NRG1 gene fusion-positive non-small cell lung cancer, addressing a rare but previously untargetable alteration [4]
  • European Commission (January 2025): The Health Technology Assessment Regulation began applying to new oncology medicines, introducing a single joint clinical assessment across member states and reshaping European launch sequencing [7]


Lung Cancer Market Report Scope

Parameter Detail
Market Scope Global therapeutics for non-small cell, small cell and other thoracic malignancies, spanning chemotherapy, immunotherapy, targeted therapy and supportive agents across all lines of treatment
Study Period 2021–2035 (Historical 2021–2024; Base Year 2025; Forecast 2026–2035)
CAGR 11.5% (2026–2035)
Market Size Checkpoints USD 29.84 Billion (2025); USD 33.51 Billion (2026); USD 89.22 Billion (2035)
Fastest Growing Segments Small cell lung cancer (disease type); immunotherapy (modality); biologics and biosimilars (drug class); retail pharmacies (channel); third-line and later (therapy line); Asia-Pacific (geography)
Companies Profiled AstraZeneca, Merck & Co., Roche/Genentech, Bristol Myers Squibb, Johnson & Johnson, Eli Lilly, Amgen, Novartis, Pfizer, Takeda, Daiichi Sankyo, Boehringer Ingelheim
Valuation Currency USD Billion, constant 2025 prices
CAGR Driver Disclaimer Driver and restraint impact percentages are directional attributions from scenario modelling; they are not additive components of the headline CAGR.

FAQs

How should an investor evaluate a single-asset biotech operating in the Lung Cancer Therapeutics Market?
Assess whether the asset addresses a resistance mechanism created by an incumbent therapy. Those positions attract acquirers because the patient pool grows automatically. Single assets without a resistance or combination angle rarely command premium multiples [21].
What contracting terms are becoming standard in oncology drug procurement?
Outcomes-based agreements tying rebate levels to progression-free survival now appear routinely in European and US payer contracts. Hospitals should negotiate biomarker-testing support as a separate deliverable rather than accepting bundled marketing programmes [7][13].
How do bispecific engagers compare operationally with checkpoint inhibitors?
Bispecifics require step-up dosing and cytokine release syndrome monitoring, often mandating inpatient observation for initial cycles. That infrastructure burden restricts early adoption to centres with existing cellular therapy capability [4].
What regulatory nuance most affects launch timing in the Lung Cancer Therapeutics Market?
Accelerated approvals now carry stricter confirmatory trial enrolment requirements, with regulators expecting the trial underway at the time of accelerated clearance. Sponsors who delay confirmatory recruitment face withdrawal risk [4][5].
Which integration challenge slows adoption of precision regimens most?
Turnaround time on tissue-based sequencing. Community sites frequently wait two to three weeks for results, during which clinicians start chemotherapy. Liquid biopsy shortens that window but carries lower sensitivity for fusion detection [8].
Is there an emerging use case beyond metastatic treatment worth tracking?
Minimal residual disease monitoring after curative surgery. Circulating tumour DNA detection is being tested to select patients for adjuvant escalation, which would create a treatment decision point that does not currently exist commercially [9][11].
How does biosimilar entry reshape competitive dynamics in the Lung Cancer Therapeutics Market?
Originators typically defend through subcutaneous reformulation, fixed-dose combinations and device-linked presentations rather than price. Buyers should expect list-price stability alongside deeper confidential rebates during the first two years of competition [19][20].    
Author
Author
Author Profile
Nidhi Mandole LinkedIn
Senior Research Analyst
She is an extremely curious individual currently working in Healthcare and Medical Devices Domain. Nidhi is comfortably versed in data centric research backed by healthcare educational background. She leverages extensive data mining and analytics tools such as Primary and Secondary Research, Statistical Analysis, Machine Learning, Data Modelling. Her key role also involves Technical Sales Support, Client Interaction and Project management within the Healthcare team. Lastly, she showcases extensive affinity towards learning new skills and remain fascinated in implementing them.
Co-Author
Co-Author Profile
Rahul Gotadki LinkedIn
Research Manager
He holds an experience of about 9+ years in Market Research and Business Consulting, working under the spectrum of Life Sciences and Healthcare domains. Rahul conceptualizes and implements a scalable business strategy and provides strategic leadership to the clients. His expertise lies in market estimation, competitive intelligence, pipeline analysis, customer assessment, etc.
Share::
Request Free Sample

Research Approach


Secondary Research

The secondary research process involved comprehensive analysis of regulatory databases, peer-reviewed oncology journals, clinical trial registries, epidemiological databases, and authoritative cancer research organizations. Key sources included the US Food and Drug Administration (FDA) Center for Drug Evaluation and Research (CDER), European Medicines Agency (EMA) Committee for Medicinal Products for Human Use (CHMP), National Cancer Institute (NCI/NIH), Surveillance, Epidemiology, and End Results (SEER) Program, Center for Disease Control and Prevention (CDC) National Program of Cancer Registries (NPCR), World Health Organization (WHO) International Agency for Research on Cancer (IARC), American Cancer Society (ACS) Cancer Statistics Center, International Association for the Study of Lung Cancer (IASLC), European Society for Medical Oncology (ESMO), American Society of Clinical Oncology (ASCO), National Comprehensive Cancer Network (NCCN) Guidelines Database, ClinicalTrials.gov, IQVIA Institute for Human Data Science, and national cancer control programs from key markets (China National Cancer Center, NHS England Cancer Registry, Japan National Cancer Center). These sources were utilized to collect lung cancer incidence and prevalence statistics, regulatory drug approval data (including Breakthrough Therapy and Priority Review designations), clinical trial outcomes (Phase I-III), treatment protocol adoption rates, biomarker testing guidelines, reimbursement policies, and competitive landscape analysis across small cell lung cancer (SCLC) and non-small cell lung cancer (NSCLC) segments.


Primary Research

Structured questionnaires and in-depth consultations (telephonic/video conferences) were employed to interview supply-side and demand-side stakeholders during the primary research process in order to acquire qualitative and quantitative insights. The supply-side sources consisted of Chief Executive Officers, Heads of Oncology Business Units, Global Regulatory Affairs Directors, Chief Medical Officers, and Commercial Strategy Heads from leading and emerging pharmaceutical companies that are actively developing lung cancer therapeutics and diagnostic manufacturers. Medical oncologists who specialize in thoracic malignancies, pulmonologists, radiation oncologists, pathologists, clinical pharmacists from tertiary care hospitals, Comprehensive Cancer Centers (NCI-designated), and procurement leads from oncology clinics and molecular diagnostic laboratories comprised demand-side sources. Primary research has validated pipeline drug segmentation, confirmed clinical trial enrollment timelines, gathered insights on immunotherapy adoption rates (PD-1/PD-L1 inhibitors), biomarker-driven treatment patterns (EGFR, ALK, KRAS mutations), and reimbursement dynamics across public and private payer systems.

Primary Respondent Breakdown:

By Company Tier: Large Pharma (>USD 50B revenue) (38%), Mid-size Pharma (USD 5B-50B) (32%), Emerging Biotech (

By Designation: C-level Primaries (28%), Director Level (35%), Others (Senior Scientists, Principal Investigators, KOLs) (37%)

By Region: North America (32%), Europe (30%), Asia-Pacific (28%), Rest of World (Latin America, Middle East & Africa) (10%)

By Stakeholder Type: Pharmaceutical Manufacturers (45%), Healthcare Providers/Oncologists (33%), Diagnostic Labs/Payers (22%)


Market Size Estimation

Global market valuation was derived through revenue triangulation and treatment episode analysis across therapeutics and diagnostics segments. The methodology included:

Identification of 55+ key stakeholders across pharmaceutical developers, diagnostic imaging manufacturers, biomarker testing companies, and radiation therapy equipment providers spanning North America, Europe, Asia-Pacific, Latin America, and Middle East & Africa

Product mapping across Chemotherapy (platinum-based agents, taxanes), Immunotherapy (checkpoint inhibitors, monoclonal antibodies), Targeted Therapy (TKIs for EGFR/ALK/ROS1/BRAF), Radiation Therapy (SBRT, proton therapy), and Diagnostic segments (PET-CT, liquid biopsy, next-generation sequencing)

Analysis of reported and modeled annual revenues specific to lung cancer indications from 10-K filings, investor presentations, and segment disclosures

Coverage of manufacturers and service providers representing 75-80% of global market share in 2024

Extrapolation using bottom-up approach (incidence cases × treatment rate × market share × average selling price by country/region) and top-down approach (company revenue validation, epidemiology-adjusted forecasting) to derive segment-specific valuations including emerging immunotherapy combinations and personalized medicine protocols

Note: All primary research interviews were conducted following strict confidentiality protocols and ethical guidelines. Market size estimates incorporate epidemiological data from 2023-2024 cancer registries with forecast projections based on current clinical trial success probabilities and regulatory approval timelines.

Share::
Request Free Sample
Download Free Sample

Kindly complete the form below to receive a free sample of this Report

* Please use a valid business email

Share::
Request Free Sample
Download PDF ×

We do not share your information with anyone. However, we may send you emails based on your report interest from time to time. You may contact us at any time to opt-out.
















