Request Free Sample ×

Kindly complete the form below to receive a free sample of this Report

* Please use a valid business email

Leading companies partner with us for data-driven Insights

clients tt-cursor
Hero Background

Chemotherapy Market

ID: MRFR/Pharma/4335-CR
126 Pages
Vikita Thakur, Rahul Gotadki
Last Updated: June 01, 2026
Chemotherapy Market Research Report Information By Drug Class (Mitotic Inhibitors, Alkylating Agents, Antimetabolites, Topoisomerase Inhibitors and Antitumor Antibiotic), By Indication (Breast Cancer, Lung Cancer, Colorectal Cancer, Prostate Cancer, Stomach Cancer, Lymphoma, Leukemia and Ovarian Cancer), By Route of Drug Administration (Intravenous, Oral, Subcutaneous, Intra-Muscular, Intravesicular, Topical, Intraperitoneal and Intraventricular/Intrathecal) and By End-User (Specialty Centers and Hospitals & Clinics), and By Region (North America, Europe, Asia-Pacific, And Rest Of The World) – Forecast Till 2035
Download PDF ×

We do not share your information with anyone. However, we may send you emails based on your report interest from time to time. You may contact us at any time to opt-out.

Chemotherapy Market Summary

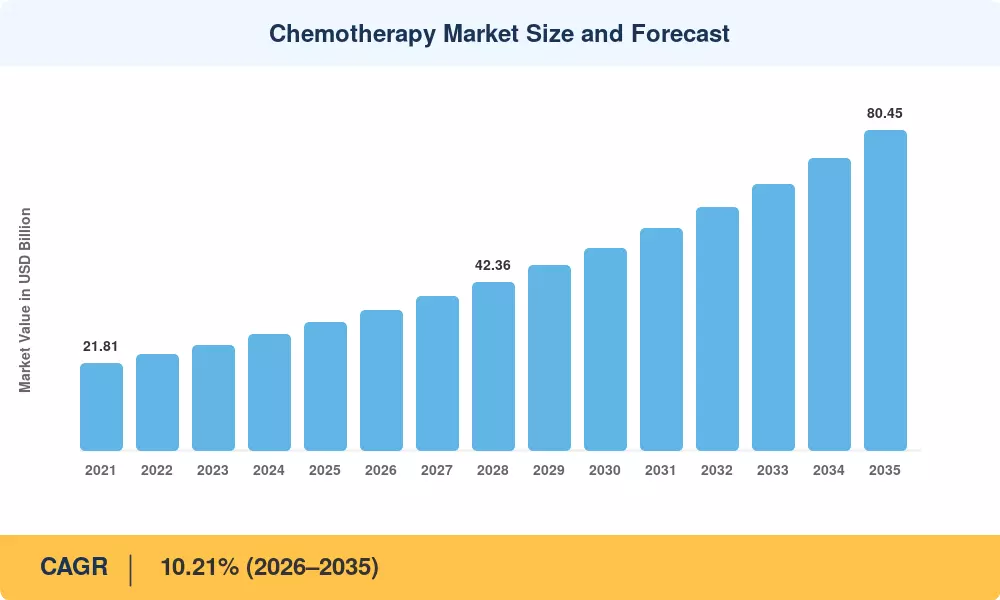
The global Chemotherapy Market reached USD 32.18 billion in 2025 and is projected to expand from USD 35.24 billion in 2026 to USD 80.45 billion by 2035, registering a CAGR of 10.21% during the forecast period (2026–2035). This trajectory is anchored by the persistent rise in global cancer incidence — the WHO estimates 20 million new cases annually by 2025 — and by national cancer-control plans that ring-fence public spending for antineoplastic treatment regimens across both high-income and developing economies [2]. Government procurement frameworks, such as India's Ayushman Bharat oncology expansion and the EU Beating Cancer Plan's EUR 4 billion commitment, continue to guarantee baseline demand for cytotoxic drug therapy.

A silent revolution is taking place in the delivery of oncology medication infusions to patients. Legacy single-agent intravenous chemotherapy regimens are being increasingly replaced by multi-agent fixed-dose combinations, oral capecitabine-based regimens, and antibody–drug conjugates including cytotoxic payloads. Between 2022 and 2024 alone, the FDA authorized 14 combination chemotherapy indications and biosimilar versions of platinum-based cancer medications in European tenders, which have reduced treatment costs by 30–45% [3]. The change is reducing the cost per cycle and expanding the pool of eligible patients.


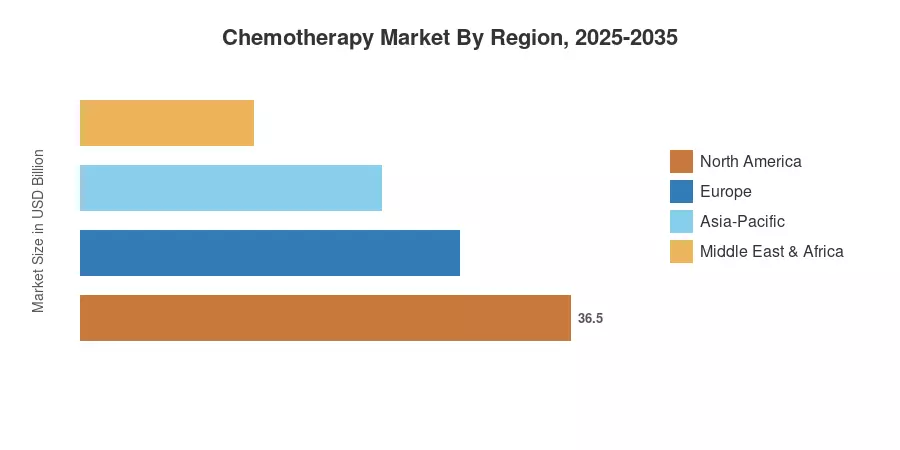
North America is anticipated to account for approximately 41.2% of the Chemotherapy Market due to high oncology spend per capita and extensive payer coverage. Asia-Pacific is expected to be the fastest-expanding region with a CAGR of 11.14% through 2035, driven by healthcare infrastructure build-outs in China and India. Europe accounts for the second-largest share at around 26.8% due to standardized EMA approval pathways and biosimilar acceptance [4]. The chemotherapy market is expected to continue its double-digit expansion well into the next decade as cancer screening programs expand in emerging economies.


Key Report Takeaways

• By Drug Class

  • Alkylating agents accounted for 40.8% of the Chemotherapy Market in 2025, driven by their foundational role in combination antineoplastic treatment regimens for solid tumors and hematologic malignancies
  • Antimetabolites are forecast to grow at a 10.75% CAGR through 2035, reflecting expanded use of capecitabine and pemetrexed in oral cytotoxic drug therapy schedules

• By Route of Administration

  • Oral therapies represented 54.3% of the Chemotherapy Market in 2025, as patient-preference data increasingly favor at-home dosing over hospital-based oncology drug infusion
  • Intravenous chemo protocols are projected to expand at 10.85% CAGR, underpinned by new platinum-based cancer drugs and antibody–drug conjugate approvals

• By Indication

  • Blood cancers captured USD 8.05 billion of the Chemotherapy Market in 2025, led by multi-agent protocols for acute leukemias
  • Breast cancer treatments are forecast to rise at 10.95% CAGR to 2035, reflecting trial-validated neoadjuvant and adjuvant chemotherapy regimens

• By Region

  • North America dominated the Chemotherapy Market with 41.2% revenue share in 2025
  • Asia-Pacific is anticipated to grow at 11.14% CAGR, the highest among all regions


Chemotherapy Market Size and Forecast (2021–2035)

Market Research Future's market sizing draws on pharmaceutical sales audits, hospital procurement databases, national cancer registries, and payer reimbursement filings across 42 countries. Historical figures (2021–2024) reflect actual reported revenues; forecast values (2026–2035) apply a calibrated CAGR validated against regulatory pipeline data and demographic cancer-incidence projections.

Chemotherapy Market Size and Forecast
Our Impact
Enabled $4.3B Revenue Impact for Fortune 500 and Leading Multinationals
Partnering with 2000+ Global Organizations Each Year
30K+ Citations by Top-Tier Firms in the Industry

Driver Impact Analysis

Driver ~% Impact on CAGR Geographic Relevance Impact Timeline
Rising global cancer incidence ~22% Global Long-term (≥4 yr)
Biosimilar cost reductions for platinum-based cancer drugs ~18% Europe, Asia-Pacific Short-term (≤2 yr)
Oral formulation approvals broaden cytotoxic drug therapy access ~16% North America, Europe Medium-term (2–4 yr)
Government oncology funding programs ~14% Asia-Pacific, South America Medium-term (2–4 yr)
Fixed-dose combination antineoplastic treatment regimens ~12% North America Short-term (≤2 yr)
Expansion of oncology drug infusion centers ~10% Asia-Pacific, MEA Long-term (≥4 yr)
Geriatric population growth ~8% Global Long-term (≥4 yr)


Rising Global Cancer Incidence

GLOBOCAN 2024 data project 35 million new cancer diagnoses yearly by 2050, up from 20 million in 2022, with the highest incidence gains in low- and middle-income countries [2]. This epidemiological fact highlights the importance of long-range demand for cytotoxic drug therapy as targeted and immuno-oncology drugs evolve. However, first-line and salvage chemotherapy continue to be important for around 60% of solid-tumor patients who are not responsive to precision therapies alone.


Biosimilar Adoption Cutting Treatment Costs

Europe’s centralized and regional tender systems for traditional platinum-based cancer therapies—including cisplatin, carboplatin, and oxaliplatin—have dramatically lowered per-cycle infusion costs due to intense generic competition. Because these platinum compounds are small-molecule agents rather than complex biologics, market expansion relies on classic generic accessibility rather than biosimilars (which are strictly reserved for complex oncology monoclonal antibodies like trastuzumab and bevacizumab). The resulting drop in pricing has structurally expanded therapeutic volumes, enabling an increasing number of public hospitals across Southern and Eastern Europe to integrate standard intravenous chemotherapy protocols into local regional formularies.


Oral Formulation Growth

Evolving regulatory pathways and joint agency frameworks, such as the active initiatives led by the FDA and the Center for Research on Complex Generics (CRCG) concerning alternative bioequivalence modeling, continue to accelerate the translation of injectable chemotherapies into robust oral options. Oral antineoplastics—predominantly driven by staples like capecitabine, temozolomide, and lenalidomide—already account for a commanding share of the oncology market by route of administration. The pipeline development of newer oral prodrug formats (such as oral taxanes) is intentionally designed to shift the balance of care away from highly resource-intensive, hospital-based oncology infusion suites to home-based management.


Government Oncology Funding Programs

Emerging economies are actively stabilizing the demand floor for cytotoxic drug therapies by committing substantial national healthcare assets to oncology infrastructure. In India, under the National Program for Prevention and Control of Non-Communicable Diseases (NP-NCD) and the Tertiary Care Cancer Facilities Scheme, the government provides dedicated grants (up to ₹120 crore for State Cancer Institutes and ₹45 crore for Tertiary Care Cancer Centers) alongside launching widespread Day Care Cancer Centers in district hospitals. Supplemented by public procurement mechanisms like the Ayushman Bharat (PM-JAY) health insurance framework and targeted expansions in Brazil (SUS) and China (Healthy China 2030), these government frameworks guarantee high-volume procurement that insulates essential chemotherapy markets from localized macroeconomic volatility.


Restraints Impact Analysis

The restraint impact percentages below are directional estimates. They do not subtract linearly from the CAGR and should be read as relative drag factors identified through MRFR's risk-scoring methodology.

Restraint ~% Negative Impact on CAGR Geographic Relevance Impact Timeline
Drug shortages for legacy cytotoxic agents ~–20% North America, Europe Short-term (≤2 yr)
Competitive budget diversion to immuno-oncology ~–25% Global Medium-term (2–4 yr)
Stricter hazardous-waste disposal regulations ~–15% Europe, North America Medium-term (2–4 yr)
Adverse-event burden limiting dose intensity ~–18% Global Long-term (≥4 yr)
API supply-chain concentration risk ~–12% Global Short-term (≤2 yr)


Drug Shortages for Legacy Cytotoxic Agents

In 2024, 15 chemotherapeutic medications, including methotrexate and cisplatin, were in urgent scarcity, as reported by the American Society of Health-System Pharmacists [11]. Low-margin generic manufacturing, single-source API suppliers and aging production facilities drive these shortages. When a facility producing platinum-based cancer medications is shut down, hospitals are forced to switch to less effective protocols, which leads to a direct decline in the volume of treatment in the Chemotherapy Market.


Competitive Budget Diversion to Immuno-Oncology

Global immuno-oncology spending exceeded USD 65 billion in 2024, and pharma R&D pipelines are increasingly tilted toward checkpoint inhibitors and CAR-T therapies [12]. While these modalities often complement cytotoxic drug therapy, research funding reallocation slows the pace of new antineoplastic treatment regimen development for traditional chemotherapy agents, constraining long-term innovation in the segment.

Hazardous-Waste Compliance Costs

Oncology infusion centers operate under tight regulatory oversight regarding the handling, containment, and disposal of hazardous pharmaceutical waste streams. In Europe, medical waste management is governed by the structural waste hierarchy of the EU Waste Framework Directive (2008/98/EC) and regional health protocols, which mandate strict separation and source segregation of toxic, pathological, and chemical residues from standard hospital trash. Because hazardous medical waste processing (requiring specialized high-temperature incineration or advanced pre-shredded autoclaving) costs vastly more than general waste disposal—averaging between USD 800 to USD 1,200 per ton—infusion facilities face rigid operating overheads. These compliance burdens disproportionately pressure smaller regional hospitals and community clinics, adding localized financial friction to the setup and running of permanent intravenous chemotherapy programs in rural locations.


Chemotherapy Market Opportunities

Antibody–Drug Conjugate (ADC) Hybrid Regimens

ADCs deliver high-potency cytotoxic payloads precisely via monoclonal antibodies, successfully bridging targeted biology with classic cellular destruction. Driven by blockbusters like Enhertu and Kadcyla, the global antibody-drug conjugate sector was valued at USD 18.60 billion in 2025 and is expected to climb steadily past USD 34.80 billion by the mid-2030s. This massive capital injection shifts oncology dynamics by substituting traditional line-one untargeted chemotherapies with hybrid formulations across solid and hematological tumors.


Emerging-Market Cancer-Center Build-Outs

A profound imbalance impacts radiation oncology availability across developing economies. According to the International Atomic Energy Agency (IAEA), more than 20 nations across Sub-Saharan Africa completely lack operational radiotherapy machinery. In total, the continent utilizes only ~400 medical linear accelerators (LINACs) to care for over 1.2 billion people (compared to approximately one LINAC per 150,000 residents in the U.S.). Because setting up radiation bunkers requires enormous capital, national cancer infrastructure plans in developing regions emphasize scalable systemic chemotherapies and oral antineoplastic drugs as viable first-line treatments.


AI-Optimized Dosing and Treatment Scheduling

Advanced machine learning models optimize and contextualize real-world clinical documentation to match patient genetic variations with targeted therapies. To operationalize this at scale, Tempus integrated its comprehensive genomic testing and AI-enabled algorithmic tools directly inside Flatiron Health's OncoEMR® platform. This structural data highway spans over 800 community-based clinical cancer locations, allowing thousands of providers to actively utilize multimodal data, track molecular profiles, and reduce the clinical friction that leads to severe adverse events.


Oral Chemotherapy Home-Delivery Platforms

The management of highly toxic oral cytotoxic regimens continues to migrate away from acute hospital spaces toward specialized home-delivery frameworks. Specialty care providers use comprehensive telehomecare monitoring protocols, combining continuous text/digital symptom tracking, direct remote toxicity checks, and dedicated pharmacist oversight. Validated clinical studies reveal that integrating continuous mobile-health checkpoints significantly limits severe toxic events, builds strict patient adherence, and prevents avoidable emergency room utilization for high-risk geriatric groups.


Biosimilar Portfolio Expansion in Asia-Pacific

India and China collectively host over 60 WHO-prequalified cytotoxic API manufacturers. As these firms move downstream into finished-dosage biosimilars, the cost base for platinum-based cancer drugs and taxane generics will decline further, widening access in Southeast Asia, Latin America, and Africa [15].


Chemotherapy Market Future Outlook

AI-Driven Precision Dosing

Pharmacogenomic data integration and predictive machine learning models are entering routine operations within modern clinical oncology care. Instead of a single federal directive forcing automated dosing caps, modern platforms focus on anticipating individual pharmacokinetic variability to avoid severe dose-limiting toxicities (DLTs). By scanning localized electronic health records alongside baseline genomic markers, algorithms alert clinical teams to toxic accumulation thresholds before physical adverse events appear, keeping high-risk patients safely on therapeutic protocols longer.


Oral Chemotherapy as the Default First-Line Modality

The shift from traditional hospital-based intravenous infusion chairs toward specialized, self-administered oral treatments represents a fundamental evolution in patient care workflows. This market transformation is a primary engine of the broader precision oncology landscape. The rising dependency on complex oral agents places a massive operational emphasis on specialized distribution pipelines, digital symptom trackers, and remote patient monitoring software designed to maintain high adherence and track side effects without relying on direct hospital visits.


Supply-Chain Regionalization and API Sovereignty

Post-pandemic supply-chain stress has prompted the U.S., EU, and Japan to pursue domestic API manufacturing for critical platinum-based cancer drugs. The CHIPS-and-Science-style incentives being drafted for pharmaceutical ingredients could redirect USD 5–8 billion in capital expenditure toward reshoring cytotoxic API production, stabilizing supply and reducing shortage risk for the Chemotherapy Market [15].

ESG Reporting and Green Chemistry in Cytotoxic Manufacturing

Global regulatory shifts, led by the European Union’s Corporate Sustainability Reporting Directive (CSRD), are requiring life science organizations to track and publish detailed data regarding their supply chain footprints. Contract development and manufacturing organizations (CDMOs) are systematically reviewing chemical synthesis routes to phase out toxic, high-impact industrial solvents. This shift toward green chemistry principles focuses heavily on maximizing atom economy, minimizing environmental waste streams, and protecting local manufacturing workers from hazardous industrial processing environments.


Chemotherapy Market Segmentation

By Drug Class

Segment Key Metric Primary Demand Driver
Alkylating Agents 40.8% share (2025) Backbone of multi-agent antineoplastic treatment regimens for lymphomas and solid tumors
Antimetabolites 10.75% CAGR Oral capecitabine adoption in breast and colorectal cytotoxic drug therapy
Plant Alkaloids USD 5.12 Billion (2025) Taxane use in neoadjuvant oncology drug infusion protocols
Antitumor Antibiotics 9.85% CAGR Doxorubicin and bleomycin demand in hematologic cancers
Others USD 2.88 Billion (2025) Platinum-based cancer drugs (cisplatin, carboplatin, oxaliplatin)


Alkylating agents anchor the Chemotherapy Market because cyclophosphamide, ifosfamide, and temozolomide remain first-line choices in treatment guidelines for glioblastoma, non-Hodgkin lymphoma, and ovarian cancer. Their patent-expired status keeps unit costs low, ensuring high procurement volumes across both developed and emerging oncology drug infusion settings. Antimetabolites represent the fastest-expanding drug class, driven by oral formulations of capecitabine and pemetrexed that allow at-home cytotoxic drug therapy and reduce hospital burden.

By Route of Administration

Segment Key Metric Primary Demand Driver
Oral 54.3% share (2025) Patient-preference data favoring home-based antineoplastic treatment regimens
Intravenous 10.85% CAGR New platinum-based cancer drugs and ADC infusion protocols
Others (Intrathecal, Intravesical) USD 1.15 Billion (2025) Specialized oncology drug infusion for CNS and bladder cancers


Oral therapies dominate the Chemotherapy Market by volume because they eliminate chair-time constraints, reduce nursing overhead, and align with post-pandemic patient preferences for at-home cytotoxic drug therapy. Intravenous chemo protocols, however, are growing faster in absolute terms — driven by ADC approvals that require hospital-based oncology drug infusion and by next-generation platinum-based cancer drugs with superior pharmacokinetic profiles.

By Indication

Segment Key Metric Primary Demand Driver
Blood Cancers USD 8.05 Billion (2025) Multi-agent intravenous chemo protocols for leukemias and lymphomas
Breast Cancer 10.95% CAGR Neoadjuvant antineoplastic treatment regimen trial data
Lung Cancer 27.8% share (2025) First-line platinum-based cancer drugs in NSCLC
Others (Colorectal, Ovarian, Gastric) USD 6.42 Billion (2025) Combination cytotoxic drug therapy with targeted agents


Lung cancer accounts for the largest single-indication share of the Chemotherapy Market, reflecting the global disease burden and the continued reliance on platinum-doublet intravenous chemo protocols as first-line therapy even in the immunotherapy era. Breast cancer is the fastest-growing indication, propelled by landmark trial data supporting dose-dense antineoplastic treatment regimens and oral cytotoxic drug therapy in HR-positive settings.

By Age Group

Segment Key Metric Primary Demand Driver
Adults (18–64) 59.8% share (2025) Broadest cytotoxic drug therapy utilization across multiple indications
Geriatric (65+) 11.05% CAGR Aging demographics and expanded antineoplastic treatment regimen tolerability
Pediatric (<18) USD 1.85 Billion (2025) Protocol-driven oncology drug infusion in childhood leukemias


The geriatric segment is poised for the strongest growth within the Chemotherapy Market as global populations age and as dose-adjusted intravenous chemo protocols improve tolerability in patients over 65. Adults remain the dominant age cohort by revenue, reflecting the peak cancer-incidence years between ages 45 and 64.


Regional Market Share Analysis

Region Key Metric Primary Investment Themes
North America 41.2% share (2025) Payer coverage expansion, ADC approvals and oncology drug infusion center upgrades
Europe 26.8% share (2025) Biosimilar tenders, EU Cancer Plan funding and intravenous chemo protocols harmonization
Asia-Pacific 11.14% CAGR (2026–2035) Government cancer plans, API manufacturing scale-up, and oral cytotoxic drug therapy adoption
South America USD 2.58 Billion (2025) Universal-health-system oncology budgets, platinum-based cancer drugs procurement
Middle East & Africa 9.85% CAGR (2026–2035) Cancer-center construction, NGO-funded antineoplastic treatment regimen access programs
Total USD 32.18 Billion (2025)

The Chemotherapy Market spans five major regions, each shaped by distinct regulatory environments, payer structures, and epidemiological profiles. North America leads on per-capita oncology spend, while Asia-Pacific drives the fastest volume growth in cytotoxic drug therapy.


North America

Country Key Metric Key Driver
US 82.5% of regional share Medicare Part B oncology drug infusion reimbursement [18]
Canada 10.85% CAGR Pan-Canadian Oncology Drug Review expansions [19]
Mexico USD 0.89 Billion (2025) Seguro Popular cancer-coverage reforms [20]


The U.S. Chemotherapy Market benefits from the 340B Drug Pricing Program, which enables safety-net hospitals to procure antineoplastic treatment regimens at discounted rates and reinvest savings into expanded intravenous chemo protocols. CMS reimbursement updates in 2024 raised the average payment for cytotoxic drug therapy administration by 3.2%, further incentivizing community oncology practices to maintain chemotherapy as a treatment backbone [18].

Europe

Country Key Metric Key Driver
Germany 23.4% of regional share Hospital-based oncology drug infusion volume leadership [3]
UK 10.48% CAGR NHS Long Term Plan cancer funding [21]
France USD 1.72 Billion (2025) INCa-guided antineoplastic treatment regimen standardization [22]
Italy 12.1% of regional share AIFA biosimilar incentive policies
Spain 9.95% CAGR Regional health-system oncology expansion
Nordic Countries USD 0.68 Billion (2025) Centralized procurement of platinum-based cancer drugs
Russia 7.2% of regional share Federal oncology program ("Борьба с онкологическими заболеваниями")
Rest of Europe 10.15% CAGR EU Beating Cancer Plan spillover funding


Germany's statutory health insurance system covers virtually all approved cytotoxic drug therapy agents, making it Europe's largest single-country contributor to the Chemotherapy Market. The UK's Cancer Drugs Fund allocated GBP 1.4 billion in 2024 for accelerated access to novel antineoplastic treatment regimens, including several oral formulations that reduce reliance on hospital-based oncology drug infusion [21].

Asia-Pacific

Country Key Metric Key Driver
China 38.6% of regional share Healthy China 2030 oncology spending [7]
India 11.65% CAGR Ayushman Bharat cancer-center expansion [8]
Japan USD 2.45 Billion (2025) NHI formulary coverage of intravenous chemo protocols
South Korea 10.92% CAGR HIRA reimbursement reforms for cytotoxic drug therapy
ASEAN 12.05% CAGR WHO-prequalified platinum-based cancer drugs adoption
Rest of Asia-Pacific USD 0.82 Billion (2025) NGO-funded oncology drug infusion programs


China's National Reimbursement Drug List added 22 antineoplastic treatment regimen entries between 2022 and 2024, making the Chemotherapy Market in China the region's largest by revenue [7]. India's bulk API manufacturing capacity — covering over 40% of global cytotoxic active ingredients — positions the country as both a consumption and supply hub for the Chemotherapy Market across Asia-Pacific [8].

South America

Country Key Metric Key Driver
Brazil 58.3% of regional share SUS oncology drug infusion procurement [10]
Argentina 10.42% CAGR Public-hospital antineoplastic treatment regimen expansion
Rest of South America USD 0.35 Billion (2025) PAHO-supported cytotoxic drug therapy access programs


Brazil's Unified Health System (SUS) is the largest single purchaser of chemotherapy agents in South America. A 2024 federal decree mandated that all SUS-accredited oncology centers stock a minimum formulary of eight platinum-based cancer drugs, driving procurement volume growth in the Chemotherapy Market across the country [10].

Middle East & Africa

Country Key Metric Key Driver
Saudi Arabia 28.5% of regional share Vision 2030 healthcare investment [23]
UAE 10.55% CAGR Medical-tourism oncology drug infusion demand
South Africa USD 0.32 Billion (2025) NHI pilot oncology coverage
Egypt 11.25% CAGR 100 Million Healthy Lives cancer screening [24]
Rest of MEA 9.42% CAGR NGO and WHO cytotoxic drug therapy donation programs


Saudi Arabia's Vision 2030 health-sector investments include USD 3.2 billion earmarked for comprehensive cancer centers, each designed to deliver full-spectrum antineoplastic treatment regimens including intravenous chemo protocols and oral cytotoxic drug therapy [23]. Egypt's national hepatitis-C screening infrastructure is being repurposed for early cancer detection, which is expected to funnel newly diagnosed patients into the Chemotherapy Market at earlier, more treatable stages [24].


Chemotherapy Market By Region, 2025-2035

Competitive Benchmarking

The Chemotherapy Market exhibits medium concentration, with an estimated HHI below 1,200 and the top five companies holding a combined 35–42% revenue share—competition centers on branded-generic portfolios, biosimilar launches, and novel fixed-dose antineoplastic treatment regimens. Large multinationals compete on pipeline depth and global distribution, while specialized generics manufacturers — particularly from India and China — compete on cost and API-supply integration.

Company Est. Revenue Share Range Key Offerings for the Chemotherapy Market Strategic Positioning
F. Hoffmann-La Roche ~8–11% Xeloda (capecitabine), Avastin biosimilar combinations Broad oncology drug infusion portfolio with ADC pipeline
Pfizer Inc. ~6–9% Doxorubicin, Sutent, biosimilar cytotoxic agents Diversified pharma with strong intravenous chemo protocols supply
Bristol-Myers Squibb ~5–8% Abraxane (nab-paclitaxel), platinum-based cancer drugs Combination antineoplastic treatment regimen integration
Novartis AG ~5–7% Gleevec generics, Kisqali, cytotoxic combinations Innovation bridge between targeted therapy and cytotoxic drug therapy
Teva Pharmaceutical ~5–7% Generic alkylating agents, oral antimetabolites Cost-leader in off-patent chemotherapy generics
Cipla Ltd. ~3–5% Gemcitabine, docetaxel, capecitabine generics Emerging-market distribution for oncology drug infusion agents
Sun Pharmaceutical ~3–5% Oral cytotoxic drug therapy portfolio, API backward integration Asia-Pacific and African market penetration
Mylan (Viatris) ~3–5% Carboplatin, oxaliplatin and methotrexate generics Platinum-based cancer drugs volume leader
Eli Lilly & Co. ~4–6% Alimta (pemetrexed), Verzenio combination protocols Antimetabolite franchise with strong U.S. market presence
Fresenius Kabi ~2–4% IV-oncology solutions, ready-to-use cytotoxic infusions Hospital-pharmacy supply-chain integration for intravenous chemo protocols


Recent News & Developments


Chemotherapy Market Report Scope

Parameter Detail
Market Scope Global Chemotherapy Market — cytotoxic drug therapy agents for oncology
Study Period 2021–2035
CAGR 10.21% (2026–2035)
Base Year Market Size USD 32.18 Billion (2025)
Forecast Endpoint USD 80.45 Billion (2035)
Fastest Growing Segment Geriatric age group (11.05% CAGR); Asia-Pacific (11.14% CAGR)
Companies Profiled 10 (Roche, Pfizer, BMS, Novartis, Teva, Cipla, Sun Pharma, Mylan/Viatris, Eli Lilly, Fresenius Kabi)
Valuation Currency USD Billion


FAQs

How do antibody–drug conjugates affect traditional chemotherapy procurement budgets?

ADCs shift spend from standalone cytotoxic agents toward premium-priced conjugate products, often raising per-patient costs 3–5× while reducing standalone platinum-based cancer drugs volumes. Hospital formulary committees must rebalance procurement between ADC and conventional infusion budgets [6].

What cold-chain requirements differentiate oral chemotherapy distribution from standard pharmaceuticals?

Most oral cytotoxic drug therapy agents require controlled-room-temperature storage (15–25 °C), not refrigeration, but light-sensitive compounds like temozolomide need opaque packaging. Specialty pharmacies invest in validated shipping lanes to maintain stability [17].

How does pharmacogenomic testing influence antineoplastic treatment regimen selection?

Pre-treatment companion diagnostics identify genetic risk factors to prevent catastrophic adverse events. Germline variations within the $DPYD$ and $UGT1A1$ genes compromise a patient’s ability to clear specific drugs, turning standard treatment doses toxic. Validated clinical guidelines recommend upfront screening to identify these phenotypes, enabling physicians to implement preemptive initial dose reductions of $25\text{–}50\%$ for fluoropyrimidines (like 5-FU and capecitabine) or irinotecan, thereby mitigating severe dose-limiting toxicities.


What role do group purchasing organizations play in Chemotherapy Market pricing?

GPOs aggregate hospital demand to negotiate volume-based discounts of 15–30% on generic cytotoxic agents, compressing manufacturer margins but guaranteeing predictable multi-year procurement commitments [18].

How are hazardous-drug handling standards evolving for oncology drug infusion nurses?

Regulatory guidelines, overseen by frameworks like United States Pharmacopeia (USP) Chapter <800>, require strict containment strategies to protect healthcare professionals from environmental exposure. Compliance necessitates substantial centralized capital improvements, including negative-pressure hazardous drug compounding cleanrooms, dedicated external ventilation exhausts, and the universal mandate for Closed-System Transfer Devices (CSTDs) during preparation and clinical administration.


What intellectual-property strategies extend exclusivity for off-patent chemotherapy agents?

Fixed-dose combinations, novel delivery systems like liposomal encapsulation, and pediatric-use patents can add 3–7 years of market exclusivity beyond base-compound expiry for antineoplastic treatment regimens [6].

How do emerging biosimilar interchangeability designations impact the Chemotherapy Market?

FDA interchangeability status allows pharmacy-level substitution without prescriber intervention, accelerating biosimilar uptake for cytotoxic drug therapy agents and potentially shifting 20–35% of branded infusion volume within two years of designation [3].


Author
Author
Author Profile
Vikita Thakur LinkedIn
Senior Research Analyst
She holds an experience of about 5+ years in market research and business consulting projects for sectors such as life sciences, medical devices, and healthcare IT. She possesses a robust background in data analysis, market estimation, competitive intelligence, pipeline analysis market trend identification, and consumer behavior insights. Her expertise lies in technical Sales support, client interaction and project management, designing and implementing market research studies, conducting competitive analysis, and synthesizing complex data into actionable recommendations that drive business growth.
Co-Author
Co-Author Profile
Rahul Gotadki LinkedIn
Research Manager
He holds an experience of about 9+ years in Market Research and Business Consulting, working under the spectrum of Life Sciences and Healthcare domains. Rahul conceptualizes and implements a scalable business strategy and provides strategic leadership to the clients. His expertise lies in market estimation, competitive intelligence, pipeline analysis, customer assessment, etc.

Research Approach


Secondary Research

The secondary research process involved comprehensive analysis of regulatory databases, peer-reviewed oncology journals, clinical trial registries, and authoritative cancer research organizations. Key sources included the US Food & Drug Administration (FDA) Oncology Center of Excellence, European Medicines Agency (EMA) Committee for Medicinal Products for Human Use (CHMP), National Cancer Institute (NCI) Surveillance, Epidemiology, and End Results Program (SEER), American Society of Clinical Oncology (ASCO), European Society for Medical Oncology (ESMO), American Cancer Society (ACS), Centers for Disease Control and Prevention (CDC) National Program of Cancer Registries, World Health Organization (WHO) International Agency for Research on Cancer (IARC) Globocan Database, National Institutes of Health (NIH) National Library of Medicine (PubMed/MEDLINE), IQVIA National Prescription Audit, EU Eurostat Healthcare Database, and national cancer control programs from key markets (NHS England Cancer Services, Cancer Council Australia, National Cancer Center Japan). These sources were utilized to collect cancer incidence and prevalence statistics, chemotherapy regimen adoption rates, regulatory approval data for cytotoxic and targeted agents, clinical safety and efficacy studies, treatment protocol guidelines, pricing and reimbursement frameworks, and competitive landscape analysis for alkylating agents, antimetabolites, mitotic inhibitors, topoisomerase inhibitors, and antitumor antibiotics.


Primary Research

To gather both qualitative and quantitative insights, supply-side and demand-side stakeholders were interviewed during the primary research phase. CEOs, Presidents of Global Oncology Divisions, Chief Scientific Officers, Heads of Regulatory Affairs for Hematology/Oncology, and Commercial Directors from biotechnology companies, contract manufacturing organizations (CMOs), and manufacturers of both generic and branded chemotherapy were among the supply-side sources. Medical oncologists, hematologists, oncology pharmacists, directors of pharmacy services, procurement leads from comprehensive cancer centers designated by the National Cancer Institute (NCI), academic medical centers, community oncology practices, and hospital infusion centers were among the demand-side sources. Primary research confirmed clinical pipeline timelines for biosimilars and novel cytotoxic agents, validated market segmentation by drug class and indication, and collected information on reimbursement dynamics across private and public payers, treatment protocol adoption, combination therapy trends, and formulary placement strategies.

Primary Respondent Breakdown:

By Designation: C-level Primaries (32%), Director Level (35%), Others (33%)

By Region: North America (38%), Europe (25%), Asia-Pacific (32%), Rest of World (5%)


Market Size Estimation

Global market valuation was derived through revenue mapping and treatment cycle volume analysis. The methodology included:

Identification of 35+ key manufacturers across North America, Europe, Asia-Pacific, and Latin America, including innovators and generic oncology specialists

Product mapping across alkylating agents (cyclophosphamide, cisplatin), antimetabolites (5-fluorouracil, gemcitabine, methotrexate), mitotic inhibitors (paclitaxel, docetaxel, vincristine), topoisomerase inhibitors (etoposide, irinotecan), and antitumor antibiotics (doxorubicin, bleomycin)

Analysis of reported and modeled annual revenues specific to chemotherapy drug portfolios, including branded, generic, and biosimilar formulations

Coverage of manufacturers representing 75-80% of global market share in 2024

Extrapolation using bottom-up (treatment cycles × average selling price by country/region across breast, lung, colorectal, and hematological malignancies) and top-down (manufacturer revenue validation and epidemiology-based patient pool analysis) approaches to derive segment-specific valuations by drug class, indication, route of administration, and end-user setting

Download Free Sample

Kindly complete the form below to receive a free sample of this Report