• Cat-intel
  • MedIntelliX
  • Resources
  • About Us
  • Hero Background
    English
    Chinese
    French
    Japanese
    Korean
    German
    Spanish

    Maritime decarbonization Market Analysis

    ID: MRFR/E&P/12375-HCR
    128 Pages
    Chitranshi Jaiswal
    October 2025

    Maritime Decarbonization Market Research Report Information by Renewable Fuel Type (Green Ammonia, Hydrogen, Biomethanol) By Application (Ships, Ports, and Others) and By Region -Global Forecast to 2035

    Share:
    Download PDF ×

    We do not share your information with anyone. However, we may send you emails based on your report interest from time to time. You may contact us at any time to opt-out.

    Maritime decarbonization Market Infographic
    $ 4,950.0
    $ 5,950.0
    $ 7,250.0

    Market Analysis

    In-depth Analysis of Maritime decarbonization Market Industry Landscape

    The market dynamics of maritime decarbonization have undergone significant shifts in recent years, driven by a global imperative to reduce greenhouse gas emissions and address climate change. The maritime industry, historically reliant on fossil fuels, is facing increasing pressure to transition towards more sustainable and eco-friendly practices. This shift is primarily influenced by regulatory measures, public awareness, and the development of innovative technologies.

    Regulatory interventions play a pivotal role in shaping the maritime decarbonization market dynamics. Various international bodies and governments have introduced stringent regulations to limit the emissions from ships. The International Maritime Organization (IMO), for instance, has implemented the International Maritime Organization Initial Strategy on the Reduction of Greenhouse Gas Emissions from Ships. This strategy outlines clear targets for reducing carbon intensity and total emissions from the global shipping industry. As a result, ship owners and operators are compelled to adopt cleaner technologies and invest in alternative fuels to comply with these regulations.

    Public awareness and societal expectations also contribute significantly to the market dynamics of maritime decarbonization. Concerns about climate change and environmental sustainability have gained prominence among consumers, investors, and stakeholders. This heightened awareness has led to increased scrutiny of the maritime industry's environmental impact, prompting companies to prioritize decarbonization efforts. In response to consumer demands for greener practices, companies are exploring and investing in technologies that reduce carbon emissions and improve overall sustainability in their operations.

    Innovation and technological advancements are driving transformative changes in the maritime decarbonization market. The development of cleaner propulsion technologies, such as hydrogen fuel cells, ammonia-based systems, and electrification, is gaining traction. These innovations aim to replace or supplement traditional fossil fuel-powered engines, providing viable alternatives for the maritime sector. Additionally, advancements in energy storage systems, energy efficiency measures, and the integration of digital technologies are contributing to the overall efficiency and sustainability of maritime operations.

    The financial landscape is also playing a crucial role in shaping the market dynamics of maritime decarbonization. Financial incentives, subsidies, and grants provided by governments and international organizations encourage companies to invest in sustainable technologies. The availability of financing options for the adoption of green technologies reduces the economic barriers associated with transitioning to cleaner practices. Furthermore, investors are increasingly prioritizing companies with robust environmental, social, and governance (ESG) practices, encouraging maritime businesses to align their strategies with sustainability goals.

    Despite these positive market dynamics, challenges persist in the maritime decarbonization landscape. The high upfront costs of adopting new technologies, uncertainty surrounding the availability and scalability of alternative fuels, and the need for substantial infrastructure developments pose hurdles to widespread implementation. Additionally, the transition to cleaner practices requires collaboration across the entire maritime ecosystem, involving shipbuilders, fuel suppliers, regulators, and other stakeholders.

    The market dynamics of maritime decarbonization are characterized by a complex interplay of regulatory, societal, technological, and financial factors. The industry is undergoing a profound transformation as it seeks to address environmental concerns and comply with stringent emission reduction targets. The success of this transition hinges on collaborative efforts, technological innovation, and strategic investments that align with both environmental sustainability and economic viability. As the maritime sector navigates these challenges, the evolution towards a more sustainable and decarbonized future remains a critical imperative for the industry and the planet as a whole.

    Market Summary

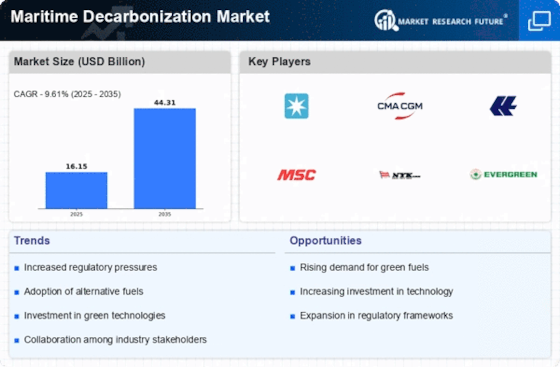
    As per Market Research Future Analysis, the Maritime Decarbonization Market was valued at 16.15 USD Billion in 2024 and is projected to grow from 17.70 USD Billion in 2025 to 44.31 USD Billion by 2035, reflecting a CAGR of approximately 9.61% during the forecast period. The market is driven by the adoption of new fuels and technologies, including green ammonia, hydrogen, and batteries, aimed at reducing greenhouse gas emissions in the maritime industry. Key collaborations, such as that between CMA CGM and Maersk, highlight the industry's commitment to achieving net-zero targets. The U.S. government is also actively involved in promoting maritime decarbonization through research and development initiatives.

    Key Market Trends & Highlights

    The maritime industry is increasingly focusing on sustainable energy solutions to reduce carbon emissions.

    • The Green Ammonia segment held a substantial market share in 2022, while hydrogen is expected to be the fastest-growing segment from 2025 to 2034. The Ships segment dominated the market in 2022 and is projected to register the highest growth rate during the forecast period. North America accounted for the largest market share in 2024, driven by a shift towards cleaner energy alternatives.

    Market Size & Forecast

    2024 Market Size USD 16.15 Billion
    2035 Market Size USD 44.31 Billion
    CAGR 9.61%
    Largest Regional Market Share in 2024 North America

    Major Players

    <p>Key players include Shell, Wärtsilä, CMA CGM Group, and Maersk.</p>

    Market Trends

    Industry seeks out more sustainable and environmentally friendly power options.

    The global shipping industry is under increasing pressure to reduce its carbon emissions, and Maritime decarbonization is seen as a promising technology to help achieve this goal. Several countries and organizations are investing in the development and deployment of technology for marine industry. For example, in 2022, In the U.S., there are approximately 40,000 commercial vessels and 360 commercial seaports handling every type of cargo, from people to phosphorus. There are an additional 10.5 million motorized recreational boats. The maritime industry is a significant contributor to global greenhouse gas emissions, accounting for approximately 2% of total emissions.

    The future of the maritime decarbonization market is bright.

    As industry continues to invest in new technologies and fuels, and as governments implement supportive policies, the maritime industry is well on its way to decarbonizing its operations. For instance, Japan has set a target of having 40,000 fuel cell vehicles and 200 fuel cell vessels in operation by 2025. Several companies are also investing in fuel cell technology for marine applications. For instance, Toyota is developing a fuel cell system for marine vessels in collaboration with several partners. In addition, several companies are offering fuel cell systems for marine applications, including Ballard Power Systems, Hydrogenic, and Plug Power.

    Overall, the trend towards the use of fuel cells for marine applications is expected to continue as industry seeks out more sustainable and environmentally friendly power options to decarbonize the marine sector. As technology improves, the adoption of Maritime decarbonization within maritime sector is likely to accelerate.

    <p>The transition towards decarbonization in the maritime sector is not merely a regulatory obligation but a pivotal opportunity for innovation and sustainable growth.</p>

    International Maritime Organization (IMO)

    Maritime decarbonization Market Market Drivers

    Market Growth Projections

    The Global Maritime Decarbonization Market Industry is poised for substantial growth, with projections indicating a market size of 16.1 USD Billion in 2024 and an anticipated increase to 44.3 USD Billion by 2035. This growth trajectory reflects the increasing urgency for sustainable practices within the maritime sector. The compound annual growth rate (CAGR) of 9.61% from 2025 to 2035 underscores the industry's commitment to reducing carbon emissions and adopting innovative technologies. These figures highlight the significant economic opportunities associated with maritime decarbonization.

    Collaborative Industry Initiatives

    Collaborative industry initiatives are emerging as a significant driver in the Global Maritime Decarbonization Market Industry. Various stakeholders, including shipping companies, fuel suppliers, and technology developers, are forming partnerships to accelerate the transition to low-carbon solutions. Initiatives such as the Getting to Zero Coalition aim to promote the development of commercially viable zero-emission vessels by 2030. These collaborations enhance knowledge sharing and resource pooling, thereby fostering innovation and reducing costs associated with decarbonization efforts. Such collective actions are essential for achieving the ambitious targets set for the maritime sector.

    Investment in Renewable Energy Sources

    Investment in renewable energy sources is a key driver in the Global Maritime Decarbonization Market Industry. Shipping companies are increasingly integrating solar and wind energy solutions into their operations to reduce reliance on fossil fuels. For example, hybrid vessels that utilize both traditional fuels and renewable energy are becoming more common. This trend is expected to accelerate market growth, with a compound annual growth rate (CAGR) of 9.61% projected from 2025 to 2035. Such investments not only contribute to sustainability but also improve the overall economic viability of maritime operations.

    Regulatory Pressure for Emission Reductions

    The Global Maritime Decarbonization Market Industry is experiencing heightened regulatory pressure aimed at reducing greenhouse gas emissions from shipping. Governments and international bodies are implementing stricter regulations, such as the International Maritime Organization's (IMO) targets to halve emissions by 2050 compared to 2008 levels. This regulatory framework compels shipping companies to invest in cleaner technologies and fuels, thus driving market growth. The anticipated market size in 2024 is projected to reach 16.1 USD Billion, reflecting the urgency of compliance and innovation in the sector.

    Technological Advancements in Alternative Fuels

    Technological advancements in alternative fuels are pivotal in the Global Maritime Decarbonization Market Industry. Innovations in hydrogen, ammonia, and biofuels are gaining traction as viable options to replace traditional marine fuels. For instance, several shipping companies are testing ammonia-powered vessels, which could significantly reduce carbon emissions. The shift towards these cleaner fuels is expected to contribute to the market's growth, with projections indicating a market size of 44.3 USD Billion by 2035. This transition not only aligns with environmental goals but also enhances operational efficiency.

    Growing Demand for Sustainable Shipping Practices

    The growing demand for sustainable shipping practices is influencing the Global Maritime Decarbonization Market Industry. Consumers and businesses are increasingly prioritizing sustainability in their supply chains, leading to greater scrutiny of shipping practices. Companies that adopt greener technologies and demonstrate a commitment to reducing their carbon footprint are likely to gain competitive advantages. This shift in consumer behavior is driving investments in decarbonization initiatives, further propelling the market forward. As sustainability becomes a core value for many organizations, the maritime sector is compelled to adapt accordingly.

    Market Segment Insights

    Maritime decarbonization by Renewable Fuel Type Insights

    <p>The Maritime decarbonization Market segmentation, based on Fuel type has been segmented into Green Ammonia, Hydrogen, Bio-methanol. In 2022, the Green Ammonia segment drove the Maritime decarbonization Market by holding a substantial market share. Whereas the hydrogen segment is expected to grow at a fastest growing segment during the forecast period of 2025-2034. As almost all this hydrogen is produced using fossil fuels, clean hydrogen offers a substantial opportunity to reduce emissions.</p>

    <p>Hydrogen is the first thing that springs to mind as a remedy in this situation because it is a clean, alternative energy source that can stop the global warming brought on by fossil fuels. because hydrogen is a fuel that may either be used catalytically or transformed into electrical energy using a fuel cell.</p>

    <p>The rising global warming issues coupled with deteriorating climatic and environmental conditions due to the excess pollution have taken the development and adoption of clean and green energy. As a result, hydrogen is a source of clean and environmentally friendly energy and is anticipated to expand significantly throughout the course of the projection period. Increasing government measures to lessen carbon emissions are promoting the production and consumption of hydrogen, which is driving up the market for hydrogen generating globally.</p>

    Maritime decarbonization By Application Insights

    <p>Based on Application, the Maritime decarbonization Market is segmented into ports, ships, and others. In 2022, the Ships segment drove the Maritime decarbonization Market by holding a substantial market share during the assessment period. It is projected to register the highest growth rate during the projected timeframe. This high share of the ships segment is owing to its strong foothold in the maritime sector. The bulk &amp; general <a href="https://www.marketresearchfuture.com/reports/cargo-shipping-market-3165">cargo ships</a>, container ships, Ferries and other types of ships are fueling the growth of the ship segment.</p>

    <p>This is brought owing to a rise in trade-related agreements as well as an increase in the transportation of products and solutions via the maritime sector. Maritime decarbonization technologies can improve the efficiency of existing ships and reduce their fuel consumption using several technologies such as slow steaming, hull optimization, and waste heat recovery which in turn is anticipated to promote the growth of the Maritime decarbonization market.</p>

    Get more detailed insights about Maritime Decarbonization Market Research Report—Global Forecast till 2034

    Regional Insights

    Based on Region, the Maritime decarbonization market is segmented into North America, Europe, Asia-Pacific, Middle East & Africa, and Latin America. The North America Maritime decarbonization market held the maximum market share and is also expected to account for the significant revenue share during the forecast period. In North America, several compelling factors have contributed to the significant rise of the Maritime decarbonization. The marine sector is moving towards cleaner energy alternatives due to the growing emphasis on environmental sustainability and the requirement to cut greenhouse gas emissions.

    As they generate power through a chemical reaction and do away with the toxic emissions produced by conventional combustion engines, hydrogen, bio methanol, and green ammonia are sustainable alternatives. Additionally, hydrogen, bio methanol, and green ammonia offer improved efficiency and dependability, assuring a constant source of power for marine operations.   

    Maritime decarbonization technology will lead the marine sector in Europe, providing a cleaner and more effective substitute for decarbonization to industry. The market for Maritime decarbonization in Europe is primed for growth and innovation as the need for environmentally friendly maritime transportation technology increases.

    Key Players and Competitive Insights

    The Maritime decarbonization Market is a dynamic and competitive industry encompassing various players offering a wide range of advanced and efficient Maritime decarbonization technology to meet the growing demand across numerous applications. This market is segmented by Maritime decarbonization fuel type, application, and region. Key drivers of market growth include The increasing adoption of energy efficiency measures, such as slow steaming and waste heat recovery, driven by their crucial role in enabling various technological advancements. Furthermore, the Maritime decarbonization Market is dominated by major players such as Shell, Wartsilla, CMA CGM Group, Maersk, and others.

    These companies’ leaders have a strong global presence and offer an extensive array of Maritime decarbonization Industry. They compete on factors such as technological advancement, R&D, and innovation. These key players are actively involved in research and development activities to introduce new Maritime decarbonization technologies and expand their product portfolios through strategic initiatives like mergers, acquisitions, partnerships, and collaborations with other industry participants. The Maritime decarbonization Market has also felt the impact of the COVID-19 pandemic, leading to fluctuations in demand and supply chain disruptions.

    However, as the global economy gradually recovers, the market is expected to rebound, driven by the growing reliance on Maritime decarbonizations in essential technologies. The market's future prospects are promising, with Maritime decarbonizations set to play a pivotal role in the ongoing technological transformations and innovations, making them an integral technology of the evolving global industrial landscape.

    Shell: Shell plc (Shell), formerly Royal Dutch Shell Plc, is an integrated oil & gas company. The company explores and produces oil & gas from conventional fields and sources such as tight rock, shale & coal formations. It operates refining & petrochemical complexes across the world. Shell’s product offerings include lubricants, bitumen, and liquefied petroleum gas; and petrochemical products such as raw materials for plastics, coatings, and detergents. The company’s reporting segments are integrated gas, upstream, oil products, chemicals, and corporate. The company is a major producer of biofuel in Brazil.

    It also has interests in various liquefied natural gas (LNG) and gas-to-liquids (GTL) projects. Moreover, the company has its operations in over 70 countries. The company markets its products directly and indirectly through distributors in Europe, Asia, Oceania, Africa, North America, and South America.

    CMA CGM Group: CMA CGM Group is a French multinational transportation and logistics company headquartered in Marseille, France. It is the world's third-largest container shipping company by TEUs (twenty-foot equivalent units). CMA CGM Group operates a fleet of over 500 vessels and has a presence in over 160 countries. The company provides a wide range of shipping and logistics services, including container shipping, terminal operations, inland transportation, and logistics solutions.

    In September 2023, CMA CGM and Maersk collaborated to accelerate the decarbonization of the shipping industry. This collaboration marks a significant turning point in the industry's decarbonization. The company will speed the development of innovative solutions and technology, helping our industry to meet its CO2 reduction targets, by merging the know-how and expertise of two leading figures in the maritime industry. The company is excited about new members joining them. Maersk seeks to expedite the green transition in logistics and shipping, and in order to do so, the company needs robust support from industry partners.

    The company is happy to have CMA CGM as an ally, and this shows that when we work together via committed relationships and efforts, a real and promising route towards a sustainable future can be seen.

    Key Companies in the Maritime decarbonization Market market include

    Industry Developments

    Future Outlook

    Maritime decarbonization Market Future Outlook

    <p>The Maritime Decarbonization Market is projected to grow at a 9.61% CAGR from 2025 to 2035, driven by regulatory pressures, technological advancements, and increasing investment in sustainable shipping solutions.</p>

    New opportunities lie in:

    • <p>Develop advanced biofuels tailored for maritime applications to reduce emissions. Invest in carbon capture technologies for ships to enhance sustainability. Create digital platforms for monitoring and optimizing vessel energy efficiency.</p>

    <p>By 2035, the Maritime Decarbonization Market is poised for substantial growth, reflecting a robust commitment to sustainable practices.</p>

    Market Segmentation

    Maritime decarbonization Regional Outlook

    • {""=>["US"
    • "Canada"]}
    • {""=>["Germany"
    • "UK"
    • "France"
    • "Spain"
    • "Italy"
    • "Russia"
    • "Rest of Europe"]}
    • {""=>["China"
    • "Japan"
    • "India"
    • "South Korea"
    • "Rest of Asia-Pacific"]}
    • {""=>["Brazil"
    • "Mexico"
    • "Argentina"
    • "Rest of Latin America"]}
    • {""=>["GCC Countries"
    • "South Africa"
    • "Rest of Middle East & Africa"]}

    Maritime decarbonization Fuel Type Outlook

    • Green Ammonia
    • Hydrogen
    • bio methanol

    Maritime decarbonization Application Outlook

    • Ship
    • Ports
    • Others

    Report Scope

    Report Attribute/Metric Details
    Market Size 2024   16.15 (USD Billion)
    Market Size 2025   17.70 (USD Billion)
    Market Size 2035 44.31 (USD Billion)
    Compound Annual Growth Rate (CAGR) 9.61% (2025 - 2035)
    Report Coverage Revenue Forecast, Competitive Landscape, Growth Factors, and Trends
    Base Year 2024
    Market Forecast Period 2025 - 2035
    Historical Data 2019 - 2023
    Report Coverage Revenue Forecast, Competitive Landscape, Growth Factors, and Trends
    Segments Covered Renewable Fuel Type, Application, and Region
    Geographies Covered North America, Europe, Asia Pacific, Rest of World
    Countries Covered US, Canada, Germany, UK, France, Spain, Italy, Russia, China, Japan, India, South Korea, Brazil, Mexico, Argentina, South Africa, GCC countries
    Key Companies Profiled Shell, Wartsilla, CMA CGM Group, Maersk, and others
    Key Market Opportunities Advancement in Technology
    Key Market Dynamics Growing shipping industry will lead to increase in carbon emission, in turn driving the market growth

    Market Highlights

    Author

    Chitranshi Jaiswal
    Research Analyst Level I

    She holds an experience of about 6+ years in market research and business consulting, working under the spectrum of information communication technology, telecommunications and semiconductor domains. aarti conceptualizes and implements a scalable business strategy and provides strategic leadership to the clients. her expertise lies in market estimation, competitive intelligence, pipeline analysis, customer assessment, etc.

    Leave a Comment

    Latest Comments

    John Doe
    john@example.com

    This is a great article! Really helped me understand the topic better.

    Posted on July 23, 2025, 10:15 AM
    Jane Smith
    jane@domain.com

    Thanks for sharing this. I’ve bookmarked it for later reference.

    Posted on July 22, 2025, 7:45 PM

    FAQs

    How much is the Maritime decarbonization Market?

    Maritime decarbonization Market size USD 16.15 Billion in 2024

    What is the growth rate of the Maritime decarbonization Market?

    Growth rate of the Maritime decarbonization Market is 9.61% by 2034

    Which region held the largest market share in the Maritime decarbonization Market?

    North America held the largest market share in the Maritime decarbonization Market

    Who are the key players in the Maritime decarbonization Market?

    Key players in the Maritime decarbonization Market are: Shell, Wartsilla, CMA CGM Group, Maersk, and others

    Which Product had the largest market share in the Maritime decarbonization Market?

    Green Ammonia Product had the largest market share in the Maritime decarbonization Market

    Which Application had the largest market share in the Maritime decarbonization Market?

    Ships had the largest market share in the Maritime decarbonization Market

    1. --- 'Table of Contents
    2. Executive Summary
      1. MARKET ATTRACTIVENESS ANALYSIS
        1. GLOBAL MARITIME DECARBONIZATION MARKET, BY RENEWABLE FUEL TYPE
        2. GLOBAL MARITIME DECARBONIZATION MARKET, BY APPLICATION
        3. GLOBAL MARITIME DECARBONIZATION MARKET, BY REGION
    3. Market Introduction
      1. DEFINITION
      2. Scope of the Study
      3. MARKET STRUCTURE
      4. KEY IMPLEMENTATION CRITERIA
    4. Research Methodology
    5. MARKET DYNAMICS
      1. INTRODUCTION
      2. DRIVERS
        1. RISING DEMAND FROM MARITIME SECTOR
        2. GROWING SHIPPING INDUSTRY WILL LEAD TO INCREASE IN CARBON EMISSION, IN TURN DRIVING THE MARKET GROWTH
      3. RESTRAINTS
        1. HIGH PRODUCTION COST 
      4. OPPORTUNITIES
        1. ADVANCEMENT IN TECHNOLOGY
    6. MARKET FACTOR ANALYSIS
      1. SUPPLY/VALUE CHAIN ANALYSIS
      2. PORTER FIVE FORCES
        1. THREAT OF NEW ENTRANTS
        2. BARGAINING POWER OF SUPPLIERS
        3. BARGAINING POWER OF BUYERS
        4. THREAT OF SUBSTITUTES:
        5. COMPETITIVE RIVALRY
      3. IMPACT OF CORONAVIRUS OUTBREAK ON THE GLOBAL MARITIME DECARBONIZATION MARKET
        1. OVERVIEW OF SUPPLY AND DEMAND SCENARIO
        2. IMPACT OF COVID-19 ON SUPPLY CHAIN ANALYSIS
    7. GLOBAL MARITIME DECARBONIZATION MARKET, BY RENEWABLE FUEL TYPE
      1. INTRODUCTION
      2. GREEN AMMONIA
      3. HYDROGEN
      4. BIO METHANOL
    8. GLOBAL MARITIME DECARBONIZATION MARKET, BY APPLICATION
      1. INTRODUCTION
      2. SHIPS
      3. PORTS
      4. OTHER
    9. GLOBAL MARITIME DECARBONIZATION MARKET, BY REGION
      1. OVERVIEW
      2. NORTH AMERICA
        1. U.S.
        2. CANADA
      3. EUROPE
        1. GERMANY
        2. U.K.
        3. FRANCE
        4. ITALY
        5. SPAIN
        6. RUSSIA
        7. REST OF EUROPE
      1. ASIA-PACIFIC
        1. CHINA
        2. INDIA
        3. JAPAN
        4. SOUTH KOREA
        5. REST OF APAC
      2. MEA (MIDDLE EAST AND AFRICA)
        1. GCC
        2. SOUTH AFRICA
        3. ROMEA
      3. LATIN AMERICA
        1. BRAZIL
        2. MEXICO
        3. ARGENTINA
        4. ROLA (REST OF LATIN AMERICA)
    10. Competitive Landscape
      1. MARKET SHARE ANALYSIS
      2. COMPETITIVE BENCHMARKING
    11. COMPANY PROFILES
      1. WARTSILLA
        1. COMPANY OVERVIEW
        2. FINANCIAL OVERVIEW
        3. PRODUCT AND SOLUTIONS OFFERED
        4. SWOT ANALYSIS
        5. KEY STRATEGIES
      2. SHELL
        1. COMPANY OVERVIEW
        2. FINANCIAL OVERVIEW
        3. PRODUCT AND SOLUTIONS OFFERED
        4. SWOT ANALYSIS
        5. KEY STRATEGIES
      3. CMA CGM GROUP
        1. COMPANY OVERVIEW
        2. FINANCIAL OVERVIEW
        3. PRODUCT AND SOLUTIONS OFFERED
        4. NEELKANTH FINECHEM LLP: SWOT ANALYSIS
        5. KEY STRATEGIES
      4. MAERSK
        1. COMPANY OVERVIEW
        2. FINANCIAL OVERVIEW
        3. PRODUCT AND SOLUTIONS OFFERED
        4. SWOT ANALYSIS
        5. KEY STRATEGIES
      5. COMPANY 5
        1. COMPANY OVERVIEW
        2. FINANCIAL OVERVIEW
        3. PRODUCT AND SOLUTIONS OFFERED
        4. SWOT ANALYSIS
        5. KEY STRATEGIES
      6. COMPANY 6
        1. COMPANY OVERVIEW
        2. FINANCIAL OVERVIEW
        3. PRODUCT AND SOLUTIONS OFFERED
        4. SWOT ANALYSIS
        5. KEY STRATEGIES
      7. COMPANY 7
        1. COMPANY OVERVIEW
        2. FINANCIAL OVERVIEW
        3. PRODUCT AND SOLUTIONS OFFERED
        4. SWOT ANALYSIS
        5. KEY STRATEGIES
      8. COMPANY 8
        1. COMPANY OVERVIEW
        2. FINANCIAL OVERVIEW
        3. PRODUCT AND SOLUTIONS OFFERED
        4. SWOT ANALYSIS
        5. KEY STRATEGIES
      9. COMPANY 9
        1. COMPANY OVERVIEW
        2. FINANCIAL OVERVIEW
        3. PRODUCT AND SOLUTIONS OFFERED
        4. SWOT ANALYSIS
        5. KEY STRATEGIES
      10. COMPANY 10
    12. List of Tables and Figures
      1. LIST OF TABLES
      2. TABLE 1 GLOBAL MARITIME DECARBONIZATION MARKET, BY RENEWABLE FUEL TYPE, 2019–2030 (USD MILLION)
      3. TABLE 5 GLOBAL MARITIME DECARBONIZATION MARKET, GREEN AMMONIA, BY REGION, 2019–2030 (USD MILLION)
      4. TABLE 6 GLOBAL MARITIME DECARBONIZATION MARKET, HYDROGEN, BY REGION, 2019–2030 (USD MILLION)
      5. TABLE 7 GLOBAL MARITIME DECARBONIZATION MARKET, BIO METHANOL, BY REGION, 2019–2030 (USD MILLION)
      6. TABLE 9 GLOBAL MARITIME DECARBONIZATION MARKET, BY APPLICATION, 2019–2030 (USD MILLION)
      7. TABLE 10 GLOBAL MARITIME DECARBONIZATION MARKET, FOR SHIPS, BY REGION, 2019–2030 (USD MILLION)
      8. TABLE 11 GLOBAL MARITIME DECARBONIZATION MARKET, FOR PORTS, BY REGION, 2019–2030 (USD MILLION)
      9. TABLE 12 GLOBAL MARITIME DECARBONIZATION MARKET, FOR OTHERS, BY REGION, 2019–2030 (USD MILLION)
      10. TABLE 16 GLOBAL MARITIME DECARBONIZATION MARKET, BY REGION, 2019–2030 (USD MILLION)
      11. TABLE 17 NORTH AMERICA: MARITIME DECARBONIZATION MARKET, BY COUNTRY, 2019-2030 (USD MILLION)
      12. TABLE 18 NORTH AMERICA: MARITIME DECARBONIZATION MARKET, BY RENEWABLE FUEL TYPE, 2019–2030 (USD MILLION)
      13. TABLE 20 NORTH AMERICA: MARITIME DECARBONIZATION MARKET, BY APPLICATION, 2019–2030 (USD MILLION)
      14. TABLE 21 U.S.: MARITIME DECARBONIZATION MARKET, BY RENEWABLE FUEL TYPE, 2019–2030 (USD MILLION)
      15. TABLE 23 U.S.: MARITIME DECARBONIZATION MARKET, BY APPLICATION, 2019–2030 (USD MILLION)
      16. TABLE 24 CANADA: MARITIME DECARBONIZATION MARKET, BY RENEWABLE FUEL TYPE, 2019–2030 (USD MILLION)
      17. TABLE 26 CANADA: MARITIME DECARBONIZATION MARKET, BY APPLICATION, 2019–2030 (USD MILLION)
      18. TABLE 27 EUROPE: MARITIME DECARBONIZATION MARKET, BY COUNTRY, 2019-2030 (USD MILLION)
      19. TABLE 28 EUROPE: MARITIME DECARBONIZATION MARKET, BY RENEWABLE FUEL TYPE, 2019–2030 (USD MILLION)
      20. TABLE 30 EUROPE: MARITIME DECARBONIZATION MARKET, BY APPLICATION, 2019–2030 (USD MILLION)
      21. TABLE 31 GERMANY: MARITIME DECARBONIZATION MARKET, BY RENEWABLE FUEL TYPE, 2019–2030 (USD MILLION)
      22. TABLE 33 GERMANY: MARITIME DECARBONIZATION MARKET, BY APPLICATION, 2019–2030 (USD MILLION)
      23. TABLE 34 U.K.: MARITIME DECARBONIZATION MARKET, BY RENEWABLE FUEL TYPE, 2019–2030 (USD MILLION)
      24. TABLE 36 U.K.: MARITIME DECARBONIZATION MARKET, BY APPLICATION, 2019–2030 (USD MILLION)
      25. TABLE 37 FRANCE: MARITIME DECARBONIZATION MARKET, BY RENEWABLE FUEL TYPE, 2019–2030 (USD MILLION)
      26. TABLE 39 FRANCE: MARITIME DECARBONIZATION MARKET, BY APPLICATION, 2019–2030 (USD MILLION)
      27. TABLE 40 ITALY: MARITIME DECARBONIZATION MARKET, BY RENEWABLE FUEL TYPE, 2019–2030 (USD MILLION)
      28. TABLE 42 ITALY: MARITIME DECARBONIZATION MARKET, BY APPLICATION, 2019–2030 (USD MILLION)
      29. TABLE 43 SPAIN: MARITIME DECARBONIZATION MARKET, BY RENEWABLE FUEL TYPE, 2019–2030 (USD MILLION)
      30. TABLE 45 SPAIN: MARITIME DECARBONIZATION MARKET, BY APPLICATION, 2019–2030 (USD MILLION)
      31. TABLE 46 RUSSIA: MARITIME DECARBONIZATION MARKET, BY RENEWABLE FUEL TYPE, 2019–2030 (USD MILLION)
      32. TABLE 48 RUSSIA: MARITIME DECARBONIZATION MARKET, BY APPLICATION, 2019–2030 (USD MILLION
      33. TABLE 49 ROE: MARITIME DECARBONIZATION MARKET, BY RENEWABLE FUEL TYPE, 2019–2030 (USD MILLION)
      34. TABLE 51 ROE: MARITIME DECARBONIZATION MARKET, BY APPLICATION, 2019–2030 (USD MILLION)
      35. TABLE 52 ASIA PACIFIC: MARITIME DECARBONIZATION MARKET, BY COUNTRY, 2019-2030 (USD MILLION)
      36. TABLE 53 ASIA PACIFIC: MARITIME DECARBONIZATION MARKET, BY RENEWABLE FUEL TYPE, 2019–2030 (USD MILLION)
      37. TABLE 55 ASIA PACIFIC: MARITIME DECARBONIZATION MARKET, BY APPLICATION, 2019–2030 (USD MILLION)
      38. TABLE 56 CHINA: MARITIME DECARBONIZATION MARKET, BY RENEWABLE FUEL TYPE, 2019–2030 (USD MILLION)
      39. TABLE 58 CHINA: MARITIME DECARBONIZATION MARKET, BY APPLICATION, 2019–2030 (USD MILLION)
      40. TABLE 59 INDIA: MARITIME DECARBONIZATION MARKET, BY RENEWABLE FUEL TYPE, 2019–2030 (USD MILLION)
      41. TABLE 61 INDIA: MARITIME DECARBONIZATION MARKET, BY APPLICATION, 2019–2030 (USD MILLION)
      42. TABLE 62 JAPAN: MARITIME DECARBONIZATION MARKET, BY RENEWABLE FUEL TYPE, 2019–2030 (USD MILLION)
      43. TABLE 64 JAPAN: MARITIME DECARBONIZATION MARKET, BY APPLICATION, 2019–2030 (USD MILLION)
      44. TABLE 65 SOUTH KOREA: MARITIME DECARBONIZATION MARKET, BY RENEWABLE FUEL TYPE, 2019–2030 (USD MILLION)
      45. TABLE 67 SOUTH KOREA: MARITIME DECARBONIZATION MARKET, BY APPLICATION, 2019–2030 (USD MILLION)
      46. TABLE 68 REST OF APAC: MARITIME DECARBONIZATION MARKET, BY RENEWABLE FUEL TYPE, 2019–2030 (USD MILLION)
      47. TABLE 70 REST OF APAC: MARITIME DECARBONIZATION MARKET, BY APPLICATION, 2019–2030 (USD MILLION)
      48. TABLE 71 MEA: MARITIME DECARBONIZATION MARKET, BY COUNTRY, 2019-2030 (USD MILLION)
      49. TABLE 72 MEA: MARITIME DECARBONIZATION MARKET, BY RENEWABLE FUEL TYPE, 2019–2030 (USD MILLION)
      50. TABLE 74 MEA: MARITIME DECARBONIZATION MARKET, BY APPLICATION, 2019–2030 (USD MILLION)
      51. TABLE 75 GCC: MARITIME DECARBONIZATION MARKET, BY RENEWABLE FUEL TYPE, 2019–2030 (USD MILLION)
      52. TABLE 77 GCC: MARITIME DECARBONIZATION MARKET, BY APPLICATION, 2019–2030 (USD MILLION)
      53. TABLE 78 SOUTH AFRICA: MARITIME DECARBONIZATION MARKET, BY RENEWABLE FUEL TYPE, 2019–2030 (USD MILLION)
      54. TABLE 80 SOUTH AFRICA: MARITIME DECARBONIZATION MARKET, BY APPLICATION, 2019–2030 (USD MILLION)
      55. TABLE 81 ROMEA: MARITIME DECARBONIZATION MARKET, BY RENEWABLE FUEL TYPE, 2019–2030 (USD MILLION)
      56. TABLE 83 ROMEA: MARITIME DECARBONIZATION MARKET, BY APPLICATION, 2019–2030 (USD MILLION)
      57. TABLE 84 LATIN AMERICA: MARITIME DECARBONIZATION MARKET, BY COUNTRY, 2019-2030 (USD MILLION)
      58. TABLE 85 LATIN AMERICA: MARITIME DECARBONIZATION MARKET, BY RENEWABLE FUEL TYPE, 2019–2030 (USD MILLION)
      59. TABLE 87 LATIN AMERICA: MARITIME DECARBONIZATION MARKET, BY APPLICATION, 2019–2030 (USD MILLION)
      60. TABLE 88 BRAZIL: MARITIME DECARBONIZATION MARKET, BY RENEWABLE FUEL TYPE, 2019–2030 (USD MILLION)
      61. TABLE 90 BRAZIL: MARITIME DECARBONIZATION MARKET, BY APPLICATION, 2019–2030 (USD MILLION)
      62. TABLE 91 MEXICO: MARITIME DECARBONIZATION MARKET, BY RENEWABLE FUEL TYPE, 2019–2030 (USD MILLION)
      63. TABLE 93 MEXICO: MARITIME DECARBONIZATION MARKET, BY APPLICATION, 2019–2030 (USD MILLION)
      64. TABLE 94 ARGENTINA: MARITIME DECARBONIZATION MARKET, BY RENEWABLE FUEL TYPE, 2019–2030 (USD MILLION)
      65. TABLE 96 ARGENTINA: MARITIME DECARBONIZATION MARKET, BY APPLICATION, 2019–2030 (USD MILLION)
      66. TABLE 97 ROLA: MARITIME DECARBONIZATION MARKET, BY RENEWABLE FUEL TYPE, 2019–2030 (USD MILLION)
      67. TABLE 99 ROLA: MARITIME DECARBONIZATION MARKET, BY APPLICATION, 2019–2030 (USD MILLION)   LIST OF FIGURES
      68. FIGURE 1 MARKET SYNOPSIS
      69. FIGURE 2 MARKET ATTRACTIVENESS ANALYSIS: GLOBAL MARITIME DECARBONIZATION
      70. FIGURE 3 GLOBAL MARITIME DECARBONIZATION ANALYSIS BY RENEWABLE FUEL TYPE, % SHARE, 2022, MARKET SIZE, 2019-2030
      71. FIGURE 5 GLOBAL MARITIME DECARBONIZATION ANALYSIS BY APPLICATION, % SHARE, 2022, MARKET SIZE, 2019-2030
      72. FIGURE 6 GLOBAL MARITIME DECARBONIZATION ANALYSIS BY REGION, 2022
      73. FIGURE 7 GLOBAL MARITIME DECARBONIZATION MARKET: MARKET STRUCTURE
      74. FIGURE 8 KEY BUYING CRITERIA OF MARITIME DECARBONIZATION REPORT
      75. FIGURE 9 BOTTOM-UP AND TOP-DOWN APPROACHES
      76. FIGURE 10 MARKET DYNAMIC ANALYSIS OF THE GLOBAL MARITIME DECARBONIZATION MARKET
      77. FIGURE 11 SUPPLY / VALUE CHAIN: GLOBAL MARITIME DECARBONIZATION MARKET
      78. FIGURE 12 GLOBAL MARITIME DECARBONIZATION MARKET, BY RENEWABLE FUEL TYPE, 2022 (% SHARE), 2022 VS 2030 (USD MILLION)
      79. FIGURE 14 GLOBAL MARITIME DECARBONIZATION MARKET, BY TECHNOLOGY, 2022 (% SHARE), 2022 VS 2030 (USD MILLION)
      80. FIGURE 15 GLOBAL MARITIME DECARBONIZATION MARKET, BY REGION, 2021 (% SHARE) 2021 VS 2030 (USD MILLION)
      81. FIGURE 16 NORTH AMERICA: MARITIME DECARBONIZATION MARKET, BY COUNTRY, 2022 (USD BILLION)
      82. FIGURE 17 EUROPE: MARITIME DECARBONIZATION MARKET, BY COUNTRY, 2022 (REVENUE % SHARE)
      83. FIGURE 18 ASIA PACIFIC: MARITIME DECARBONIZATION MARKET, BY COUNTRY, 2022 (REVENUE % SHARE)
      84. FIGURE 19 MEA: MARITIME DECARBONIZATION MARKET, BY COUNTRY, 2022 (REVENUE % SHARE)
      85. FIGURE 20 LATIN AMERICA: MARITIME DECARBONIZATION MARKET, BY COUNTRY, 2022 (REVENUE % SHARE)
      86. FIGURE 21 MARKET SHARE ANALYSIS (2022, %) *
      87. FIGURE 22 GLOBAL MARITIME DECARBONIZATION MARKET: COMPETITIVE BENCHMARKING'

    Maritime Decarbonization Market Segmentation

    Maritime decarbonization Renewable fuel type Outlook (USD Million, 2019-2030)

    • Green ammonia
    • bio-methanol
    • hydrogen

    Maritime decarbonization Application Outlook (USD Million, 2019-2030)

    • Ship
    • Ports
    • Others

    Maritime decarbonization   Regional Outlook (USD Million, 2019-2030)

    • North America Outlook (USD Million, 2019-2030)
      • North America Maritime decarbonization  Renewable fuel type Outlook (USD Million, 2019-2030)
        • Green ammonia
        • bio-methanol
        • hydrogen
      • North America Maritime decarbonization  Application Outlook (USD Million, 2019-2030)
        • Ship
        • Ports
        • Others


    • US Outlook (USD Million, 2019-2030)
      • US Maritime decarbonization  Renewable fuel type Outlook (USD Million, 2019-2030)
        • Green ammonia
        • bio-methanol
        • hydrogen
      • US Maritime decarbonization  Application Outlook (USD Million, 2019-2030)
        • Ship
        • Ports
        • Others
      • Canada Outlook (USD Million, 2019-2030)
        • Canada Maritime decarbonization  Renewable fuel type Outlook (USD Million, 2019-2030)
          • Green ammonia
          • bio-methanol
          • hydrogen
        • Canada Maritime decarbonization  Application Outlook (USD Million, 2019-2030)
          • Ship
          • Ports
          • Others
        • Europe Outlook (USD Million, 2019-2030)
          • Europe Maritime decarbonization  Renewable fuel type Outlook (USD Million, 2019-2030)
            • Green ammonia
            • bio-methanol
            • hydrogen
          • Europe Maritime decarbonization  Application Outlook (USD Million, 2019-2030)
            • Ship
            • Ports
            • Others


    • GERMANY Outlook (USD Million, 2019-2030)
      • GERMANY Maritime decarbonization  Renewable fuel type Outlook (USD Million, 2019-2030)
        • Green ammonia
        • bio-methanol
        • hydrogen
      • GERMANY Maritime decarbonization  Application Outlook (USD Million, 2019-2030)
        • Ship
        • Ports
        • Others
      • Spain Outlook (USD Million, 2019-2030)
        • Spain Maritime decarbonization  Renewable fuel type Outlook (USD Million, 2019-2030)
          • Green ammonia
          • bio-methanol
          • hydrogen
        • Spain Maritime decarbonization  Application Outlook (USD Million, 2019-2030)
          • Ship
          • Ports
          • Others
        • REST OF EUROPE Outlook (USD Million, 2019-2030)
          • REST OF EUROPE Maritime decarbonization  Renewable fuel type Outlook (USD Million, 2019-2030)
            • Green ammonia
            • bio-methanol
            • hydrogen
          • REST OF EUROPE Maritime decarbonization  Application Outlook (USD Million, 2019-2030)
            • Ship
            • Ports
            • Others
          • Asia-Pacific Maritime decarbonization  Application Outlook (USD Million, 2019-2030)
            • Ship
            • Ports
            • Others


    • CHINA Outlook (USD Million, 2019-2030)
      • CHINA Maritime decarbonization  Renewable fuel type Outlook (USD Million, 2019-2030)
        • Green ammonia
        • bio-methanol
        • hydrogen
      • CHINA Maritime decarbonization  Application Outlook (USD Million, 2019-2030)
        • Ship
        • Ports
        • Others
      • India Outlook (USD Million, 2019-2030)
        • India Maritime decarbonization  Renewable fuel type Outlook (USD Million, 2019-2030)
          • Green ammonia
          • bio-methanol
          • hydrogen
        • India Maritime decarbonization  Application Outlook (USD Million, 2019-2030)
          • Ship
          • Ports
          • Others
        • JAPAN Outlook (USD Million, 2019-2030)
          • JAPAN Maritime decarbonization  Renewable fuel type Outlook (USD Million, 2019-2030)
            • Green ammonia
            • bio-methanol
            • hydrogen
            •  
          • JAPAN Maritime decarbonization  Application Outlook (USD Million, 2019-2030)
            • Ship
            • Ports
            • Others
          • South Korea Outlook (USD Million, 2019-2030)
            • South Korea Maritime decarbonization  Renewable fuel type Outlook (USD Million, 2019-2030)
              • Green ammonia
              • bio-methanol
              • hydrogen
            • South Korea Maritime decarbonization  Application Outlook (USD Million, 2019-2030)
              • Ship
              • Ports
              • Others


    • REST OF ASIA-PACIFIC Outlook (USD Million, 2019-2030)
      • REST OF ASIA-PACIFIC Maritime decarbonization  Renewable fuel type Outlook (USD Million, 2019-2030)
        • Green ammonia
        • bio-methanol
        • hydrogen
        •  
      • REST OF ASIA-PACIFIC Maritime decarbonization  Application Outlook (USD Million, 2019-2030)
        • Ship
        • Ports
        • Others


    • Rest of World Outlook (USD Million, 2019-2030)
      • Rest of World Maritime decarbonization  Renewable fuel type Outlook (USD Million, 2019-2030)
        • Green ammonia
        • bio-methanol
        • hydrogen
        •  
      • Rest of World Maritime decarbonization  Application Outlook (USD Million, 2019-2030)
        • Ship
        • Ports
        • Others


    • LATIN AMERICA Outlook (USD Million, 2019-2030)
      • LATIN AMERICA Maritime decarbonization  Renewable fuel type Outlook (USD Million, 2019-2030)
        • Green ammonia
        • bio-methanol
        • hydrogen
        •  
      • LATIN AMERICA Maritime decarbonization  Application Outlook (USD Million, 2019-2030)
        • Ship
        • Ports
        • Others
      • Middle East & Africa Outlook (USD Million, 2019-2030)
        • Middle East & Africa Maritime decarbonization  Renewable fuel type Outlook (USD Million, 2019-2030)
          • Green ammonia
          • bio-methanol
          • hydrogen
          •  
        • Middle East & Africa Maritime decarbonization  Application Outlook (USD Million, 2019-2030)
          • Ship
          • Ports
          • Others
    Infographic

    Free Sample Request

    Kindly complete the form below to receive a free sample of this Report

    Get Free Sample

    Customer Strories

    “I am very pleased with how market segments have been defined in a relevant way for my purposes (such as "Portable Freezers & refrigerators" and "last-mile"). In general the report is well structured. Thanks very much for your efforts.”

    Victoria Milne

    Founder
    Case Study
    Chemicals and Materials