• Cat-intel
  • MedIntelliX
  • Resources
  • About Us
  • Hero Background
    English
    Chinese
    French
    Japanese
    Korean
    German
    Spanish

    Metallic Stearates Market Share

    ID: MRFR/CnM/3471-CR
    138 Pages
    Priya Nagrale
    April 2019

    Metallic Stearates Market Research Report Information by Product (Zinc Stearate, Aluminum Stearate, Magnesium Stearate, Calcium Stearate), Application (Polymer and Paper, Rubber, Pharmaceuticals and Cosmetics, Building and Construction), and Region & Forecast till 2035

    Share:
    Download PDF ×

    We do not share your information with anyone. However, we may send you emails based on your report interest from time to time. You may contact us at any time to opt-out.

    Metallic Stearates Market Infographic
    $ 4,950.0
    $ 5,950.0
    $ 7,250.0

    Market Share

    Metallic Stearates Market Share Analysis

    Polyvinyl chloride (PVC) is a versatile material widely employed in various industries, including food and pharmaceutical packaging, toys, flooring, footwear, bottles, and pipes. The surge in research and development activities focused on PVC composites is driving the demand for metallic stearates. A notable example is the initiative taken by Braskem, a leading Brazilian petrochemical company, in 2017. Braskem successfully developed a PVC composite endowed with unique properties, including high durability, 100% recyclability, and lightweight characteristics. This innovative PVC composite has found applications in diverse sectors such as construction, furniture, and agriculture. The incorporation of metallic stearates in the development of PVC stabilizers is anticipated to unlock lucrative growth opportunities for participants in the global metallic stearate market throughout the forecast period. In a significant development in January 2019, Teknor Apex, a U.S.-based company, introduced a new range of medical-grade PVC compounds. These compounds are pre-compliant with global regulations, making them particularly valuable in the manufacturing of medical devices. This advancement opens avenues for applications in the production of critical medical tools such as catheters, blood transport systems, and enteral feeding devices. Looking ahead, the industry is poised to witness similar innovative breakthroughs, creating growth prospects for metallic stearate producers in the foreseeable future. The continuous evolution of PVC applications, driven by ongoing research and development endeavors, underscores the dynamic nature of the market. The adaptability of PVC in diverse industries, from construction to healthcare, is a testament to its significance in modern manufacturing. The development of advanced PVC composites with enhanced properties not only meets the evolving needs of various sectors but also aligns with the growing emphasis on sustainability, recyclability, and compliance with global regulations. As industries seek materials with improved performance, durability, and environmental credentials, metallic stearates play a pivotal role in enhancing the properties of PVC. The formulation of PVC stabilizers using metallic stearates reflects a commitment to addressing the challenges posed by traditional stabilizing agents, offering a pathway to more sustainable and efficient solutions. This trend is expected to propel the demand for metallic stearates as a key ingredient in the continued innovation and development of PVC applications across industries. the intersection of PVC and metallic stearates in ongoing research and development initiatives signifies a promising trajectory for the global metallic stearate market. The versatile applications of PVC, coupled with the unique properties imparted by metallic stearates, position these compounds as integral components in the ever-evolving landscape of material science. The development of PVC stabilizers and medical-grade PVC compounds highlights the collaborative efforts of industry players to meet the diverse and dynamic needs of modern manufacturing, creating opportunities for growth and innovation in the metallic stearate market in the years to come.

    Market Summary

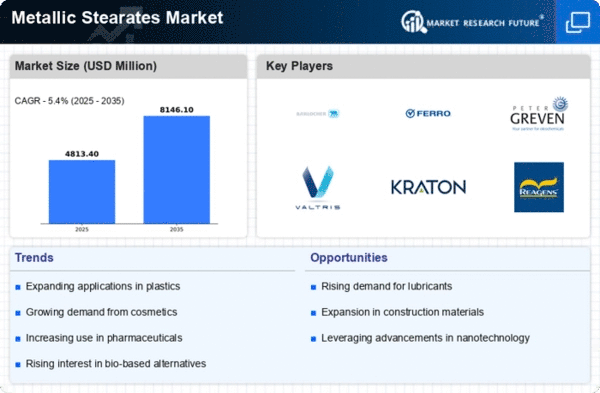
    The Global Metallic Stearates Market is projected to grow from 4.57 USD Million in 2024 to 8.15 USD Million by 2035.

    Key Market Trends & Highlights

    Global Metallic Stearates Key Trends and Highlights

    • The market is expected to experience a compound annual growth rate (CAGR) of 4.75 percent from 2025 to 2035.
    • By 2035, the market valuation is anticipated to reach 2500 USD Million, indicating robust growth potential.
    • in 2024, the market is valued at 4.57 USD Million, reflecting a solid foundation for future expansion.
    • Growing adoption of metallic stearates in various applications due to increasing demand for lubricants is a major market driver.

    Market Size & Forecast

    2024 Market Size 4.57 (USD Million)
    2035 Market Size 8.15 (USD Million)
    CAGR (2025 - 2035) 5.40%
    Largest Regional Market Share in 2024 -)

    Major Players

    Apple Inc (US), Microsoft Corp (US), Amazon.com Inc (US), Alphabet Inc (US), Berkshire Hathaway Inc (US), Tesla Inc (US), Meta Platforms Inc (US), Johnson & Johnson (US), Visa Inc (US), Procter & Gamble Co (US)

    Market Trends

    The demand for metallic stearates is anticipated to rise as industries increasingly seek versatile additives that enhance product performance and stability.

    U.S. Department of Commerce

    Metallic Stearates Market Market Drivers

    Market Growth Projections

    The Global Metallic Stearates Market Industry is projected to experience substantial growth over the next decade. With a market size expected to reach 1500 USD Million in 2024 and potentially expanding to 2500 USD Million by 2035, the industry is poised for a robust trajectory. This growth is underpinned by various factors, including rising demand in diverse applications, technological advancements, and sustainability trends. The anticipated compound annual growth rate of 4.75% from 2025 to 2035 further indicates a positive outlook for the market, suggesting that stakeholders should remain vigilant to capitalize on emerging opportunities.

    Growth in Personal Care and Cosmetics

    The Global Metallic Stearates Market Industry is significantly influenced by the expanding personal care and cosmetics sector. Metallic stearates are utilized as emulsifiers, thickeners, and stabilizers in a variety of cosmetic formulations. With the global cosmetics market anticipated to grow substantially, the demand for metallic stearates is likely to increase. This growth is particularly pronounced in emerging markets, where rising disposable incomes and changing consumer preferences drive the consumption of premium personal care products. As a result, the industry is poised to benefit from this upward trend, further solidifying its market position.

    Rising Demand in Plastics and Polymers

    The Global Metallic Stearates Market Industry experiences a notable surge in demand driven by the plastics and polymers sector. Metallic stearates, such as calcium stearate and zinc stearate, serve as effective lubricants and release agents in the production of various plastic products. As the global plastics market is projected to reach approximately 1500 USD Million in 2024, the need for metallic stearates is expected to grow correspondingly. This trend is particularly evident in regions with robust manufacturing capabilities, where the integration of metallic stearates enhances product quality and processing efficiency.

    Sustainability Trends in Manufacturing

    The Global Metallic Stearates Market Industry is increasingly influenced by sustainability trends within manufacturing processes. As industries strive to reduce their environmental footprint, the demand for biodegradable and eco-friendly additives is on the rise. Metallic stearates, derived from natural sources, align with these sustainability goals, making them attractive to manufacturers seeking greener alternatives. This shift is likely to enhance the market's appeal, particularly among environmentally conscious consumers and businesses. Consequently, the industry may experience growth as it adapts to these evolving preferences, potentially reaching a market size of 2500 USD Million by 2035.

    Technological Innovations in Production

    The Global Metallic Stearates Market Industry benefits from ongoing technological innovations in production techniques. Advances in manufacturing processes, such as improved synthesis methods and enhanced quality control measures, lead to higher purity and performance of metallic stearates. These innovations not only optimize production efficiency but also reduce costs, making metallic stearates more accessible to various industries. As a result, the market is likely to experience a compound annual growth rate of 4.75% from 2025 to 2035, reflecting the positive impact of these technological advancements on overall market dynamics.

    Advancements in Pharmaceutical Applications

    The Global Metallic Stearates Market Industry is witnessing a shift towards pharmaceutical applications, where metallic stearates play a crucial role as excipients in drug formulations. Their properties as lubricants and flow agents enhance the manufacturability of tablets and capsules. As the pharmaceutical industry continues to expand, driven by innovations in drug development and an increasing global population, the demand for metallic stearates is expected to rise. This trend is particularly relevant in regions with advanced healthcare systems, where the need for efficient drug delivery systems is paramount, thereby creating new opportunities for market growth.

    Market Segment Insights

    Regional Insights

    Key Companies in the Metallic Stearates Market market include

    Industry Developments

    In the year 2020, one of the leading market players, Ravago Chemicals North America has partnered with another leading market player, Valtris Speciality chemicals which are known for its metallic stearates production and the varied portfolio for the varied end-user industries such as Food, nutraceutical, and pharmaceutical, personal care and significant others.In the year 2017, one of the leading market players, Baerlocher USA has announced the expansion of their metal soap production facility, where the expansion is expected to be over 50% because of the growing market demand and the rapid innovation.

    In the year 2017, Germany-based oleochemicals company Peter Greven Group increased its presence in the North American plastics additives industry by acquiring Norac Additives. Peter Greven Group acquired Norac Additives on September 30 for unknown terms and renamed it Norac Additives LLC. Norac's headquarters and development laboratory are in Pomona, California, and the company operates a production factory in Helena, Arkansas.

    Future Outlook

    Metallic Stearates Market Future Outlook

    The Global Metallic Stearates Market is projected to grow at a 5.40% CAGR from 2025 to 2035, driven by increasing demand in pharmaceuticals, plastics, and cosmetics.

    New opportunities lie in:

    • Expand product lines to include bio-based metallic stearates for sustainable applications.
    • Invest in R&D for innovative formulations catering to the automotive sector.
    • Leverage digital marketing strategies to enhance customer engagement and brand loyalty.

    By 2035, the market is expected to exhibit robust growth, reflecting evolving consumer preferences and technological advancements.

    Market Segmentation

    Report Scope

    Attribute/Metric Details
    Market Size 2024 USD 4.57 Billion
    Market Size 2025 USD 4.81 Billion
    Market Size 2035 8.15 (Value (USD Billion))
    Compound Annual Growth Rate (CAGR) 5.40% (2025 - 2035)
    Base Year 2024
    Market Forecast Period 2025 - 2035
    Historical Data 2020 & 2024
    Market Forecast Units Value (USD Billion)
    Report Coverage Revenue Forecast, Market Competitive Landscape, Growth Factors, and Trends
    Segments Covered Type, Application and End-Use
    Geographies Covered North America, Europe, AsiaPacific, and Rest of the World
    Countries Covered The U.S, Canada, Germany, France, UK, Italy, Spain, China, Japan, India, Australia, South Korea, and Brazil
    Key Companies Profiled Baerlocher GmbH (Germany), Peter Greven GmbH & Co. K.G. (Germany), Valtris Specialty Chemicals (U.S.), Dover Chemical Corporation (U.S.), Lumega Industries (India), Sun Ace Kakoh (Pte.) Ltd. (Malaysia), IRRH Specialty Chemicals Co. Ltd. (South Korea), James M. Brown Ltd. (U.K.), Marathwada Chemical Industries Pvt. Ltd. (India), FACI S.P.A. (Italy), Nimbasia Stabilizers (India), P.M.C. Biogenix Inc. (U.S.), Seoul Fine Chemical Ind. Co. Ltd. (South Korea), Norac Additives (U.S.), PROMAX Industries ApS, Marathwada Chemicals
    Key Market Opportunities The rising demand for polymers like Polyvinyl Chloride (P.V.C.) and others in different industrial applications using metallic stearates as a major component.
    Key Market Dynamics Engagement of metallic stearates products in rubber, plastic, and polymer industry. ·  Increasing demand in the industries like building, construction, rubber industry, polymer industry, paints and coating industry, pharmaceuticals, and others.

    Market Highlights

    Author

    Priya Nagrale
    Senior Research Analyst

    She holds an experience of about 6+ years in market research and business consulting, working under the spectrum of information communication technology, telecommunications and semiconductor domains. aarti conceptualizes and implements a scalable business strategy and provides strategic leadership to the clients. her expertise lies in market estimation, competitive intelligence, pipeline analysis, customer assessment, etc.

    Leave a Comment

    Latest Comments

    John Doe
    john@example.com

    This is a great article! Really helped me understand the topic better.

    Posted on July 23, 2025, 10:15 AM
    Jane Smith
    jane@domain.com

    Thanks for sharing this. I’ve bookmarked it for later reference.

    Posted on July 22, 2025, 7:45 PM

    FAQs

    At what CAGR is the Metallic Stearates Market predicted to grow during the forecast period?

    Metallic Stearates Market is predicted to grow at 5.40% through forecast period of 2025-2034.

    What is the forecast period of Metallic Stearates Market research report?

    The forecast period for Metallic Stearates Market research report is 2025-2034.

    Which region will lead the global Metallic Stearates Market?

    Global Metallic Stearates Market is dominated by APAC region.

    Who are the key players in the Metallic Stearates Market?

    The prominent players in the metallic stearates industry are Baerlocher GmbH (Germany), Peter Greven GmbH & Co. K.G. (Germany), Valtris Specialty Chemicals (U.S.), Dover Chemical Corporation (U.S.), Lumega Industries (India), Sun Ace Kakoh (Pte.) Ltd. (Malaysia), IRRH Specialty Chemicals Co. Ltd. (South Korea), James M. Brown Ltd. (U.K.), Marathwada Chemical Industries Pvt. Ltd. (India), FACI S.P.A. (Italy), Nimbasia Stabilizers (India), P.M.C. Biogenix Inc. (U.S.), Seoul Fine Chemical Ind. Co. Ltd. (South Korea), Norac Additives (U.S.), PROMAX Industries ApS, Marathwada Chemicals, and many more.

    What are the key factors driving the Metallic Stearates Market?

    The metallic stearates market is driven by factors is Engagement of metallic stearates products in rubber, plastic, and polymer industry

    1. List of Tables and Figures
      1.  
      2. TABLE 1 MARKET SYNOPSIS 17
      3.  
      4. TABLE
      5. 2 LIST OF ASSUMPTIONS 20
      6.  
      7. TABLE 3 GLOBAL METALLIC
      8. STEARATES, BY PRODUCT, 2025−2034 (USD MILLION) 42
      9.  
      10. TABLE
      11. 4 GLOBAL METALLIC STEARATES MARKET, BY PRODUCT, 2025−2034 (KILO TONS) 43
      12.  
      13. TABLE
      14. 5 ZINC STEARATE: GLOBAL METALLIC STEARATES MARKET, BY REGION, 2025−2034 (USD
      15. MILLION) 44
      16.  
      17. TABLE 6 ZINC STEARATE: GLOBAL METALLIC
      18. STEARATES MARKET, BY REGION, 2025−2034 (KILO TONS) 44
      19.  
      20. TABLE
      21. 7 ALUMINIUM STEARATE: GLOBAL METALLIC STEARATES MARKET, BY REGION, 2025−2034
      22. (USD MILLION) 45
      23.  
      24. TABLE 8 ALUMINIUM STEARATE:
      25. GLOBAL METALLIC STEARATES MARKET, BY REGION, 2025−2034 (KILO TONS) 45
      26.  
      27. TABLE
      28. 9 MAGNESIUM STEARATE: GLOBAL METALLIC STEARATES MARKET, BY REGION, 2025−2034
      29. (USD MILLION) 46
      30.  
      31. TABLE 10 MAGNESIUM STEARATE:
      32. GLOBAL METALLIC STEARATES MARKET, BY REGION, 2025−2034 (KILO TONS) 46
      33.  
      34. TABLE
      35. 11 CALCIUM STEARATE: GLOBAL METALLIC STEARATES MARKET, BY REGION, 2025−2034
      36. (USD MILLION) 47
      37.  
      38. TABLE 12 CALCIUM STEARATE: GLOBAL
      39. METALLIC STEARATES MARKET, BY REGION, 2025−2034 (KILO TONS) 47
      40.  
      41. TABLE
      42. 13 OTHERS: GLOBAL METALLIC STEARATES MARKET, BY REGION, 2025−2034 (USD MILLION)
      43. 48
      44.  
      45. TABLE 14 OTHERS: GLOBAL METALLIC STEARATES
      46. MARKET, BY REGION, 2025−2034 (KILO TONS) 48
      47.  
      48. TABLE
      49. 15 GLOBAL METALLIC STEARATES, BY APPLICATION, 2025−2034 (USD MILLION) 50
      50.  
      51. TABLE
      52. 16 GLOBAL METALLIC STEARATES MARKET, BY APPLICATION, 2025−2034 (KILO TONS)
      53. 51
      54.  
      55. TABLE 17 POLYMER AND PAPER: GLOBAL METALLIC
      56. STEARATES MARKET, BY REGION, 2025−2034 (USD MILLION) 52
      57.  
      58. TABLE
      59. 18 POLYMER AND PAPER: GLOBAL METALLIC STEARATES MARKET, BY REGION, 2025−2034
      60. (KILO TONS) 52
      61.  
      62. TABLE 19 RUBBER: GLOBAL METALLIC
      63. STEARATESMARKET, BY REGION, 2025−2034 (USD MILLION) 53
      64.  
      65. TABLE
      66. 20 RUBBER: GLOBAL METALLIC STEARATES MARKET, BY REGION, 2025−2034 (KILO TONS)
      67. 53
      68.  
      69. TABLE 21 PHARMACEUTICALS AND COSMETICS: GLOBAL
      70. METALLIC STEARATES MARKET, BY REGION, 2025−2034 (USD MILLION) 54
      71.  
      72. TABLE
      73. 22 PHARMACEUTICALS AND COSMETICS: GLOBAL METALLIC STEARATESMARKET, BY REGION, 2025−2034
      74. (KILO TONS) 54
      75.  
      76. TABLE 23 BUILDING & CONSTRUCTION:
      77. GLOBAL METALLIC STEARATES MARKET, BY REGION, 2025−2034 (USD MILLION) 55
      78.  
      79. TABLE
      80. 24 BUILDING & CONSTRUCTION: GLOBAL METALLIC STEARATES MARKET, BY REGION, 2025−2034
      81. (KILO TONS) 55
      82.  
      83. TABLE 25 PAINTS & COATINGS:
      84. GLOBAL METALLIC STEARATES MARKET, BY REGION, 2025−2034 (USD MILLION) 56
      85.  
      86. TABLE
      87. 26 PAINTS & COATINGS: GLOBAL METALLIC STEARATESMARKET, BY REGION, 2025−2034
      88. (KILO TONS) 56
      89.  
      90. TABLE 27 OTHERS: GLOBAL METALLIC
      91. STEARATES MARKET, BY REGION, 2025−2034 (USD MILLION) 57
      92.  
      93. TABLE
      94. 28 OTHERS: GLOBAL METALLIC STEARATESMARKET, BY REGION, 2025−2034 (KILO TONS)
      95. 57
      96.  
      97. TABLE 29 GLOBAL METALLIC STEARATES MARKET,
      98. BY REGION, 2025−2034 (USD MILLION) 59
      99.  
      100. TABLE
      101. 30 GLOBAL METALLIC STEARATES MARKET, BY REGION, 2025−2034 (KILO TONS) 60
      102.  
      103. TABLE
      104. 31 NORTH AMERICA: METALLIC STEARATES MARKET, BY COUNTRY, 2025−2034 (USD MILLION)
      105. 61
      106.  
      107. TABLE 32 NORTH AMERICA: METALLIC STEARATES
      108. MARKET, BY COUNTRY, 2025−2034 (KILO TONS) 61
      109.  
      110. TABLE
      111. 33 NORTH AMERICA: METALLIC STEARATES MARKET, BY PRODUCT, 2025−2034 (USD MILLION)
      112. 62
      113.  
      114. TABLE 34 NORTH AMERICA: METALLIC STEARATES
      115. MARKET, BY PRODUCT, 2025−2034 (KILO TONS) 62
      116.  
      117. TABLE
      118. 35 NORTH AMERICA: METALLIC STEARATES MARKET, BY APPLICATION, 2025−2034 (USD
      119. MILLION) 63
      120.  
      121. TABLE 36 NORTH AMERICA: METALLIC
      122. STEARATES MARKET, BY APPLICATION, 2025−2034 (KILO TONS) 63
      123.  
      124. TABLE
      125. 37 US: METALLIC STEARATES MARKET, BY PRODUCT, 2025−2034 (USD MILLION) 64
      126.  
      127. TABLE
      128. 38 US: METALLIC STEARATES MARKET, BY PRODUCT, 2025−2034 (KILO TONS) 64
      129.  
      130. TABLE
      131. 39 US: METALLIC STEARATES MARKET, BY APPLICATION, 2025−2034 (USD MILLION)
      132. 65
      133.  
      134. TABLE 40 US: METALLIC STEARATESMARKET, BY
      135. APPLICATION, 2025−2034 (KILO TONS) 65
      136.  
      137. TABLE
      138. 41 CANADA: METALLIC STEARATES MARKET, BY PRODUCT, 2025−2034 (USD MILLION)
      139. 66
      140.  
      141. TABLE 42 CANADA: METALLIC STEARATES MARKET,
      142. BY PRODUCT, 2025−2034 (KILO TONS) 66
      143.  
      144. TABLE
      145. 43 CANADA: METALLIC STEARATES MARKET, BY APPLICATION, 2025−2034 (USD MILLION)
      146. 67
      147.  
      148. TABLE 44 CANADA: METALLIC STEARATES MARKET,
      149. BY APPLICATION, 2025−2034 (KILO TONS) 67
      150.  
      151. TABLE
      152. 45 EUROPE: METALLIC STEARATES MARKET, BY COUNTRY, 2025−2034 (USD MILLION)
      153. 68
      154.  
      155. TABLE 46 EUROPE: METALLIC STEARATES MARKET,
      156. BY COUNTRY, 2025−2034 (KILO TONS) 69
      157.  
      158. TABLE
      159. 47 EUROPE: METALLIC STEARATES MARKET, BY PRODUCT, 2025−2034 (USD MILLION)
      160. 69
      161.  
      162. TABLE 48 EUROPE: METALLIC STEARATES MARKET,
      163. BY PRODUCT, 2025−2034 (KILO TONS) 70
      164.  
      165. TABLE
      166. 49 EUROPE: METALLIC STEARATES MARKET, BY APPLICATION, 2025−2034 (USD MILLION)
      167. 70
      168.  
      169. TABLE 50 EUROPE: METALLIC STEARATES MARKET,
      170. BY APPLICATION, 2025−2034 (KILO TONS) 71
      171.  
      172. TABLE
      173. 51 GERMANY: METALLIC STEARATES MARKET, BY PRODUCT, 2025−2034 (USD MILLION)
      174. 71
      175.  
      176. TABLE 52 GERMANY: METALLIC STEARATES MARKET,
      177. BY PRODUCT, 2025−2034 (KILO TONS) 72
      178.  
      179. TABLE
      180. 53 GERMANY: METALLIC STEARATES MARKET, BY APPLICATION, 2025−2034 (USD MILLION)
      181. 72
      182.  
      183. TABLE 54 GERMANY: METALLIC STEARATES MARKET,
      184. BY APPLICATION, 2025−2034 (KILO TONS) 73
      185.  
      186. TABLE
      187. 55 UK: METALLIC STEARATES MARKET, BY PRODUCT, 2025−2034 (USD MILLION) 73
      188.  
      189. TABLE
      190. 56 UK: METALLIC STEARATES MARKET, BY PRODUCT, 2025−2034 (KILO TONS) 74
      191.  
      192. TABLE
      193. 57 UK: METALLIC STEARATESMARKET, BY APPLICATION, 2025−2034 (USD MILLION) 74
      194.  
      195. TABLE
      196. 58 UK: METALLIC STEARATESMARKET, BY APPLICATION, 2025−2034 (KILO TONS) 75
      197.  
      198. TABLE
      199. 59 RUSSIA: METALLIC STEARATES MARKET, BY PRODUCT, 2025−2034 (USD MILLION)
      200. 75
      201.  
      202. TABLE 60 RUSSIA: METALLIC STEARATES MARKET,
      203. BY PRODUCT, 2025−2034 (KILO TONS) 76
      204.  
      205. TABLE
      206. 61 RUSSIA: METALLIC STEARATESMARKET, BY APPLICATION, 2025−2034 (USD MILLION)
      207. 76
      208.  
      209. TABLE 62 RUSSIA: METALLIC STEARATESMARKET,
      210. BY APPLICATION, 2025−2034 (KILO TONS) 77
      211.  
      212. TABLE
      213. 63 FRANCE: METALLIC STEARATES MARKET, BY PRODUCT, 2025−2034 (USD MILLION)
      214. 77
      215.  
      216. TABLE 64 FRANCE: METALLIC STEARATES MARKET,
      217. BY PRODUCT, 2025−2034 (KILO TONS) 78
      218.  
      219. TABLE
      220. 65 FRANCE: METALLIC STEARATES MARKET, BY APPLICATION, 2025−2034 (USD MILLION)
      221. 78
      222.  
      223. TABLE 66 FRANCE: METALLIC STEARATES MARKET,
      224. BY APPLICATION, 2025−2034 (KILO TONS) 79
      225.  
      226. TABLE
      227. 67 SPAIN: METALLIC STEARATES MARKET, BY PRODUCT, 2025−2034 (USD MILLION) 79
      228.  
      229. TABLE
      230. 68 SPAIN: METALLIC STEARATES MARKET, BY PRODUCT, 2025−2034 (KILO TONS) 80
      231.  
      232. TABLE
      233. 69 SPAIN: METALLIC STEARATES MARKET, BY APPLICATION, 2025−2034 (USD MILLION)
      234. 80
      235.  
      236. TABLE 70 SPAIN: METALLIC STEARATES MARKET,
      237. BY APPLICATION, 2025−2034 (KILO TONS) 81
      238.  
      239. TABLE
      240. 71 ITALY: METALLIC STEARATES MARKET, BY PRODUCT, 2025−2034 (USD MILLION) 81
      241.  
      242. TABLE
      243. 72 ITALY: METALLIC STEARATES MARKET, BY PRODUCT, 2025−2034 (KILO TONS) 82
      244.  
      245. TABLE
      246. 73 ITALY: METALLIC STEARATES MARKET, BY APPLICATION, 2025−2034 (USD MILLION)
      247. 82
      248.  
      249. TABLE 74 ITALY: METALLIC STEARATES MARKET,
      250. BY APPLICATION, 2025−2034 (KILO TONS) 83
      251.  
      252. TABLE
      253. 75 POLAND: METALLIC STEARATES MARKET, BY PRODUCT, 2025−2034 (USD MILLION)
      254. 83
      255.  
      256. TABLE 76 POLAND: METALLIC STEARATES MARKET,
      257. BY PRODUCT, 2025−2034 (KILO TONS) 84
      258.  
      259. TABLE
      260. 77 POLAND: METALLIC STEARATES MARKET, BY APPLICATION, 2025−2034 (USD MILLION)
      261. 84
      262.  
      263. TABLE 78 POLAND: METALLIC STEARATES MARKET,
      264. BY APPLICATION, 2025−2034 (KILO TONS) 85
      265.  
      266. TABLE
      267. 79 REST OF EUROPE: METALLIC STEARATES MARKET, BY PRODUCT, 2025−2034 (USD MILLION)
      268. 85
      269.  
      270. TABLE 80 REST OF EUROPE: METALLIC STEARATES
      271. MARKET, BY PRODUCT, 2025−2034 (KILO TONS) 86
      272.  
      273. TABLE
      274. 81 REST OF EUROPE: METALLIC STEARATES MARKET, BY APPLICATION, 2025−2034 (USD
      275. MILLION) 86
      276.  
      277. TABLE 82 REST OF EUROPE: METALLIC
      278. STEARATES MARKET, BY APPLICATION, 2025−2034 (KILO TONS) 87
      279.  
      280. TABLE
      281. 83 ASIA-PACIFIC: METALLIC STEARATES MARKET, BY COUNTRY, 2025−2034 (USD MILLION)
      282. 88
      283.  
      284. TABLE 84 ASIA-PACIFIC: METALLIC STEARATES
      285. MARKET, BY COUNTRY, 2025−2034 (KILO TONS) 88
      286.  
      287. TABLE
      288. 85 ASIA-PACIFIC: METALLIC STEARATES MARKET, BY PRODUCT, 2025−2034 (USD MILLION)
      289. 89
      290.  
      291. TABLE 86 ASIA-PACIFIC: METALLIC STEARATES
      292. MARKET, BY PRODUCT, 2025−2034 (KILO TONS) 89
      293.  
      294. TABLE
      295. 87 ASIA-PACIFIC: METALLIC STEARATES MARKET, BY APPLICATION, 2025−2034 (USD
      296. MILLION) 90
      297.  
      298. TABLE 88 ASIA-PACIFIC: METALLIC STEARATES
      299. MARKET, BY APPLICATION, 2025−2034 (KILO TONS) 90
      300.  
      301. TABLE
      302. 89 CHINA: METALLIC STEARATES MARKET, BY PRODUCT, 2025−2034 (USD MILLION) 91
      303.  
      304. TABLE
      305. 90 CHINA: METALLIC STEARATES MARKET, BY PRODUCT, 2025−2034 (KILO TONS) 91
      306.  
      307. TABLE
      308. 91 CHINA: METALLIC STEARATES MARKET, BY APPLICATION, 2025−2034 (USD MILLION)
      309. 92
      310.  
      311. TABLE 92 CHINA: METALLIC STEARATES MARKET,
      312. BY APPLICATION, 2025−2034 (KILO TONS) 92
      313.  
      314. TABLE
      315. 93 JAPAN: METALLIC STEARATES MARKET, BY PRODUCT, 2025−2034 (USD MILLION) 93
      316.  
      317. TABLE
      318. 94 JAPAN: METALLIC STEARATES MARKET, BY PRODUCT, 2025−2034 (KILO TONS) 93
      319.  
      320. TABLE
      321. 95 JAPAN: METALLIC STEARATES MARKET, BY APPLICATION, 2025−2034 (USD MILLION)
      322. 94
      323.  
      324. TABLE 96 JAPAN: METALLIC STEARATES MARKET,
      325. BY APPLICATION, 2025−2034 (KILO TONS) 94
      326.  
      327. TABLE
      328. 97 INDIA: METALLIC STEARATES MARKET, BY PRODUCT, 2025−2034 (USD MILLION) 95
      329.  
      330. TABLE
      331. 98 INDIA: METALLIC STEARATES MARKET, BY PRODUCT, 2025−2034 (KILO TONS) 95
      332.  
      333. TABLE
      334. 99 INDIA: METALLIC STEARATES MARKET, BY APPLICATION, 2025−2034 (USD MILLION)
      335. 96
      336.  
      337. TABLE 100 INDIA: METALLIC STEARATES MARKET,
      338. BY APPLICATION, 2025−2034 (KILO TONS) 96
      339.  
      340. TABLE
      341. 101 AUSTRALIA AND NEW ZEALAND: METALLIC STEARATES MARKET, BY PRODUCT, 2025−2034
      342. (USD MILLION) 97
      343.  
      344. TABLE 102 AUSTRALIA AND NEW
      345. ZEALAND: METALLIC STEARATES MARKET, BY PRODUCT, 2025−2034 (KILO TONS) 97
      346.  
      347. TABLE
      348. 103 AUSTRALIA AND NEW ZEALAND: METALLIC STEARATES MARKET, BY APPLICATION, 2025−2034
      349. (USD MILLION) 98
      350.  
      351. TABLE 104 AUSTRALIA AND NEW
      352. ZEALAND: METALLIC STEARATES MARKET, BY APPLICATION, 2025−2034 (KILO TONS)
      353. 98
      354.  
      355. TABLE 105 ASEAN: METALLIC STEARATES MARKET,
      356. BY PRODUCT, 2025−2034 (USD MILLION) 99
      357.  
      358. TABLE
      359. 106 ASEAN: METALLIC STEARATES MARKET, BY PRODUCT, 2025−2034 (KILO TONS) 99
      360.  
      361. TABLE
      362. 107 ASEAN: METALLIC STEARATES MARKET, BY APPLICATION, 2025−2034 (USD MILLION)
      363. 100
      364.  
      365. TABLE 108 ASEAN: METALLIC STEARATES MARKET,
      366. BY APPLICATION, 2025−2034 (KILO TONS) 100
      367.  
      368. TABLE
      369. 109 SOUTH KOREA: METALLIC STEARATES MARKET, BY PRODUCT, 2025−2034 (USD MILLION)
      370. 101
      371.  
      372. TABLE 110 SOUTH KOREA: METALLIC STEARATES
      373. MARKET, BY PRODUCT, 2025−2034 (KILO TONS) 101
      374.  
      375. TABLE
      376. 111 SOUTH KOREA: METALLIC STEARATES MARKET, BY APPLICATION, 2025−2034 (USD
      377. MILLION) 102
      378.  
      379. TABLE 112 SOUTH KOREA: METALLIC
      380. STEARATES MARKET, BY APPLICATION, 2025−2034 (KILO TONS) 102
      381.  
      382. TABLE
      383. 113 REST OF ASIA PACIFIC: METALLIC STEARATES MARKET, BY PRODUCT, 2025−2034
      384. (USD MILLION) 103
      385.  
      386. TABLE 114 REST OF ASIA PACIFIC:
      387. METALLIC STEARATES MARKET, BY PRODUCT, 2025−2034 (KILO TONS) 103
      388.  
      389. TABLE
      390. 115 REST OF ASIA PACIFIC: METALLIC STEARATES MARKET, BY APPLICATION, 2025−2034
      391. (USD MILLION) 104
      392.  
      393. TABLE 116 REST OF ASIA PACIFIC:
      394. METALLIC STEARATES MARKET, BY APPLICATION, 2025−2034 (KILO TONS) 104
      395.  
      396. TABLE
      397. 117 LATIN AMERICA: METALLIC STEARATES MARKET, BY COUNTRY, 2025−2034 (USD MILLION)
      398. 105
      399.  
      400. TABLE 118 LATIN AMERICA: METALLIC STEARATES
      401. MARKET, BY COUNTRY, 2025−2034 (KILO TONS) 105
      402.  
      403. TABLE
      404. 119 LATIN AMERICA: METALLIC STEARATES MARKET, BY PRODUCT, 2025−2034 (USD MILLION)
      405. 106
      406.  
      407. TABLE 120 LATIN AMERICA: METALLIC STEARATES
      408. MARKET, BY PRODUCT, 2025−2034 (KILO TONS) 106
      409.  
      410. TABLE
      411. 121 LATIN AMERICA: METALLIC STEARATES MARKET, BY APPLICATION, 2025−2034 (USD
      412. MILLION) 107
      413.  
      414. TABLE 122 LATIN AMERICA: METALLIC
      415. STEARATES MARKET, BY APPLICATION, 2025−2034 (KILO TONS) 107
      416.  
      417. TABLE
      418. 123 MEXICO: METALLIC STEARATES MARKET, BY PRODUCT, 2025−2034 (USD MILLION)
      419. 108
      420.  
      421. TABLE 124 MEXICO: METALLIC STEARATES MARKET,
      422. BY PRODUCT, 2025−2034 (KILO TONS) 108
      423.  
      424. TABLE
      425. 125 MEXICO: METALLIC STEARATES MARKET, BY APPLICATION, 2025−2034 (USD MILLION)
      426. 109
      427.  
      428. TABLE 126 MEXICO: METALLIC STEARATES MARKET,
      429. BY APPLICATION, 2025−2034 (KILO TONS) 109
      430.  
      431. TABLE
      432. 127 ARGENTINA: METALLIC STEARATES MARKET, BY PRODUCT, 2025−2034 (USD MILLION)
      433. 110
      434.  
      435. TABLE 128 ARGENTINA: METALLIC STEARATES MARKET,
      436. BY PRODUCT, 2025−2034 (KILO TONS) 110
      437.  
      438. TABLE
      439. 129 ARGENTINA: METALLIC STEARATES MARKET, BY APPLICATION, 2025−2034 (USD MILLION)
      440. 111
      441.  
      442. TABLE 130 ARGENTINA: METALLIC STEARATES MARKET,
      443. BY APPLICATION, 2025−2034 (KILO TONS) 111
      444.  
      445. TABLE
      446. 131 BRAZIL: METALLIC STEARATES MARKET, BY PRODUCT, 2025−2034 (USD MILLION)
      447. 112
      448.  
      449. TABLE 132 BRAZIL: METALLIC STEARATES MARKET,
      450. BY PRODUCT, 2025−2034 (KILO TONS) 112
      451.  
      452. TABLE
      453. 133 BRAZIL: METALLIC STEARATES MARKET, BY APPLICATION, 2025−2034 (USD MILLION)
      454. 113
      455.  
      456. TABLE 134 BRAZIL: METALLIC STEARATES MARKET,
      457. BY APPLICATION, 2025−2034 (KILO TONS) 113
      458.  
      459. TABLE
      460. 135 REST OF LATIN AMERICA: METALLIC STEARATES MARKET, BY PRODUCT, 2025−2034
      461. (USD MILLION) 114
      462.  
      463. TABLE 136 REST OF LATIN AMERICA:
      464. METALLIC STEARATES MARKET, BY PRODUCT, 2025−2034 (KILO TONS) 114
      465.  
      466. TABLE
      467. 137 REST OF LATIN AMERICA: METALLIC STEARATES MARKET, BY APPLICATION, 2025−2034
      468. (USD MILLION) 115
      469.  
      470. TABLE 138 REST OF LATIN AMERICA:
      471. METALLIC STEARATES MARKET, BY APPLICATION, 2025−2034 (KILO TONS) 115
      472.  
      473. TABLE
      474. 139 MIDDLE EAST AND AFRICA: METALLIC STEARATES MARKET, BY COUNTRY, 2025−2034
      475. (USD MILLION) 116
      476.  
      477. TABLE 140 MIDDLE EAST AND AFRICA:
      478. METALLIC STEARATES MARKET, BY COUNTRY, 2025−2034 (KILO TONS) 117
      479.  
      480. TABLE
      481. 141 MIDDLE EAST AND AFRICA: METALLIC STEARATES MARKET, BY PRODUCT, 2025−2034
      482. (USD MILLION) 117
      483.  
      484. TABLE 142 MIDDLE EAST AND AFRICA:
      485. METALLIC STEARATES MARKET, BY PRODUCT, 2025−2034 (KILO TONS) 118
      486.  
      487. TABLE
      488. 143 MIDDLE EAST AND AFRICA: METALLIC STEARATES MARKET, BY APPLICATION, 2025−2034
      489. (USD MILLION) 118
      490.  
      491. TABLE 144 MIDDLE EAST AND AFRICA:
      492. METALLIC STEARATESMARKET, BY APPLICATION, 2025−2034 (KILO TONS) 119
      493.  
      494. TABLE
      495. 145 TURKEY: METALLIC STEARATES MARKET, BY PRODUCT, 2025−2034 (USD MILLION)
      496. 119
      497.  
      498. TABLE 146 TURKEY: METALLIC STEARATES MARKET,
      499. BY PRODUCT, 2025−2034 (KILO TONS) 120
      500.  
      501. TABLE
      502. 147 TURKEY: METALLIC STEARATES MARKET, BY APPLICATION, 2025−2034 (USD MILLION)
      503. 120
      504.  
      505. TABLE 148 TURKEY: METALLIC STEARATES MARKET,
      506. BY APPLICATION, 2025−2034 (KILO TONS) 121
      507.  
      508. TABLE
      509. 149 UAE: METALLIC STEARATES MARKET, BY PRODUCT, 2025−2034 (USD MILLION) 121
      510.  
      511. TABLE
      512. 150 UAE: METALLIC STEARATES MARKET, BY PRODUCT, 2025−2034 (KILO TONS) 122
      513.  
      514. TABLE
      515. 151 UAE: METALLIC STEARATES MARKET, BY APPLICATION, 2025−2034 (USD MILLION)
      516. 122
      517.  
      518. TABLE 152 UAE: METALLIC STEARATES MARKET,
      519. BY APPLICATION, 2025−2034 (KILO TONS) 123
      520.  
      521. TABLE
      522. 153 SAUDI ARABIA: METALLIC STEARATES MARKET, BY PRODUCT, 2025−2034 (USD MILLION)
      523. 123
      524.  
      525. TABLE 154 SAUDI ARABIA: METALLIC STEARATES
      526. MARKET, BY PRODUCT, 2025−2034 (KILO TONS) 124
      527.  
      528. TABLE
      529. 155 SAUDI ARABIA: METALLIC STEARATES MARKET, BY APPLICATION, 2025−2034 (USD
      530. MILLION) 124
      531.  
      532. TABLE 156 SAUDI ARABIA: METALLIC
      533. STEARATES MARKET, BY APPLICATION, 2025−2034 (KILO TONS) 125
      534.  
      535. TABLE
      536. 157 EGYPT: METALLIC STEARATES MARKET, BY PRODUCT, 2025−2034 (USD MILLION)
      537. 125
      538.  
      539. TABLE 158 EGYPT: METALLIC STEARATES MARKET,
      540. BY PRODUCT, 2025−2034 (KILO TONS) 126
      541.  
      542. TABLE
      543. 159 EGYPT: METALLIC STEARATESMARKET, BY APPLICATION, 2025−2034 (USD MILLION)
      544. 126
      545.  
      546. TABLE 160 EGYPT: METALLIC STEARATESMARKET,
      547. BY APPLICATION, 2025−2034 (KILO TONS) 127
      548.  
      549. TABLE
      550. 161 SOUTH AFRICA: METALLIC STEARATES MARKET, BY PRODUCT, 2025−2034 (USD MILLION)
      551. 127
      552.  
      553. TABLE 162 SOUTH AFRICA: METALLIC STEARATES
      554. MARKET, BY PRODUCT, 2025−2034 (KILO TONS) 128
      555.  
      556. TABLE
      557. 163 SOUTH AFRICA: METALLIC STEARATESMARKET, BY APPLICATION, 2025−2034 (USD
      558. MILLION) 128
      559.  
      560. TABLE 164 SOUTH AFRICA: METALLIC
      561. STEARATESMARKET, BY APPLICATION, 2025−2034 (KILO TONS) 129
      562.  
      563. TABLE
      564. 165 REST OF MIDDLE EAST & AFRICA: METALLIC STEARATES MARKET, BY PRODUCT, 2025−2034
      565. (USD MILLION) 129
      566.  
      567. TABLE 166 REST OF MIDDLE EAST
      568. & AFRICA: METALLIC STEARATES MARKET, BY PRODUCT, 2025−2034 (KILO TONS)
      569. 130
      570.  
      571. TABLE 167 REST OF MIDDLE EAST & AFRICA:
      572. METALLIC STEARATES MARKET, BY APPLICATION, 2025−2034 (USD MILLION) 130
      573.  
      574. TABLE
      575. 168 REST OF MIDDLE EAST & AFRICA: METALLIC STEARATES MARKET, BY APPLICATION,
      576. 2025−2034 (KILO TONS) 131
      577.  
      578. TABLE 169 KEY
      579. DEVELOPMENTS OVERVIEW 133
      580.  
      581.  
      582.  
      583.  
      584. 14
    2. List of Tables and Figures
      1.  
      2. FIGURE 1 GLOBAL METALLIC STEARATES
      3. MARKET: MARKET STRUCTURE 20
      4.  
      5. FIGURE 1 NORTH AMERICA
      6. MARKET SIZE & MARKET SHARE BY COUNTRY (2020) 22
      7.  
      8. FIGURE
      9. 2 EUROPE MARKET SIZE & MARKET SHARE BY COUNTRY (2020) 22
      10.  
      11. FIGURE
      12. 3 ASIA PACIFIC & MARKET SHARE BY COUNTRY (2020) 23
      13.  
      14. FIGURE
      15. 4 LATIN AMERICA MARKET SIZE & MARKET SHARE BY COUNTRY (2020) 23
      16.  
      17. FIGURE
      18. 5 MIDDLE EAST & AFRICA MARKET SIZE & MARKET SHARE BY COUNTRY (2020) 24
      19.  
      20. FIGURE
      21. 6 RESEARCH PROCESS OF MRFR 26
      22.  
      23. FIGURE 7 TOP-DOWN
      24. AND BOTTOM-UP APPROACHES 29
      25.  
      26. FIGURE 8 MARKET DYNAMICS
      27. OVERVIEW 31
      28.  
      29. FIGURE 9 PLASTIC PRODUCTION IN MILLION
      30. TONS (2015–2017) 32
      31.  
      32. FIGURE 10 PHARMA R&D
      33. EXPENDITURES (2015) 33
      34.  
      35. FIGURE 11 TEXTILE EXPORTS
      36. IN BILLION USD (2017) 34
      37.  
      38. FIGURE 12 DRIVERS IMPACT
      39. ANALYSIS 35
      40.  
      41. FIGURE 13 RESTRAINTS IMPACT ANALYSIS
      42. 36
      43.  
      44. FIGURE 14 SUPPLY CHAIN ANALYSIS FOR GLOBAL
      45. METALLIC STEARATES MARKET 38
      46.  
      47. FIGURE 15 STEARIC
      48. ACID PRICE INDEX 39
      49.  
      50. FIGURE 16 PORTER’S
      51. FIVE FORCES ANALYSIS FOR THE GLOBAL METALLIC STEARATE MARKET 40
      52.  
      53. FIGURE
      54. 17 GLOBAL METALLIC STEARATES MARKET, BY PRODUCT, 2025−2034 (USD MILLION) 42
      55.  
      56. FIGURE
      57. 18 GLOBAL METALLIC STEARATES MARKET, BY PRODUCT, 2025−2034 (KILO TONS) 43
      58.  
      59. FIGURE
      60. 19 GLOBAL METALLIC STEARATES MARKET, BY APPLICATION, 2025−2034 (USD MILLION)
      61. 50
      62.  
      63. FIGURE 20 GLOBAL METALLIC STEARATES MARKET,
      64. BY APPLICATION, 2025−2034 (KILO TONS) 51
      65.  
      66. FIGURE
      67. 21 GLOBAL METALLIC STEARATES MARKET BY REGION, 2025−2034 (USD MILLION) 59
      68.  
      69. FIGURE
      70. 22 GLOBAL METALLIC STEARATES MARKET BY REGION, 2025−2034 (KILO TONS) 60

    Metallic Stearates Market Segmentation

    Market Segmentation Overview

    • Detailed segmentation data will be available in the full report
    • Comprehensive analysis by multiple parameters
    • Regional and country-level breakdowns
    • Market size forecasts by segment
    Infographic

    Free Sample Request

    Kindly complete the form below to receive a free sample of this Report

    Get Free Sample

    Customer Strories

    “I am very pleased with how market segments have been defined in a relevant way for my purposes (such as "Portable Freezers & refrigerators" and "last-mile"). In general the report is well structured. Thanks very much for your efforts.”

    Victoria Milne

    Founder
    Case Study
    Chemicals and Materials