Mobile Wallet Market (2025 - 2035)

Mobile Wallet Market Size, Share and Research Report: By Payment Method (Bank Transfer, Credit Card, Debit Card, Mobile Carrier Billing), By Technology (Near Field Communication, QR Code, Cloud-Based), By End-user (Retail, E-commerce, Utilities, Travel), By Platform (Android, iOS, Web-Based), and By Regional (North America, Europe, South America, Asia Pacific, Middle East and Africa) - Industry Forecast to 2035
ID: MRFR/ICT/1527-HCR
200 Pages
Aarti Dhapte
Last Updated: July 13, 2026
Mobile Wallet Market
Market Size
Forecast Period2025-2035
CAGR (2025-2035)15.1%
2025 Market SizeUSD 248.40 Billion
2035 Market SizeUSD 994.60 Billion
Key Players
Alipay
WeChat Pay
PayPal
Apple Pay
Google Pay
PhonePe
Opportunities
  • Emerging-Market Wallet Leapfrogging
  • Data Monetization and Embedded Finance
  • Cross-Border Remittance Corridors

Mobile Wallet Market Summary

The Mobile Wallet Market reached USD 248.40 billion in 2025 and is positioned to climb from a 2026 starting base of USD 294.70 billion toward USD 994.60 billion by 2035, advancing at a 15.1% CAGR across the forecast decade. Two catalysts anchor this trajectory: national instant-payment rails such as India's Unified Payments Interface, which now clears billions of transactions monthly within seconds, and Brazil's Pix system, which onboarded more than 140 million users in under three years. The Mobile Wallet Market sits at the intersection of public payment infrastructure and private platform ambition, and that overlap is what gives it durability.

Replacing physical cards and cash, contactless mobile payments have become the default tender across grocery counters, transit gates, and street vendors. Legacy magstripe terminals and proprietary loyalty cards are giving way to NFC wallet technology embedded directly in handsets. The European Central Bank's digital euro investigation, backed by a multi-year budget exceeding EUR 1.2 billion, signals how seriously central banks treat this shift toward digital payment apps.

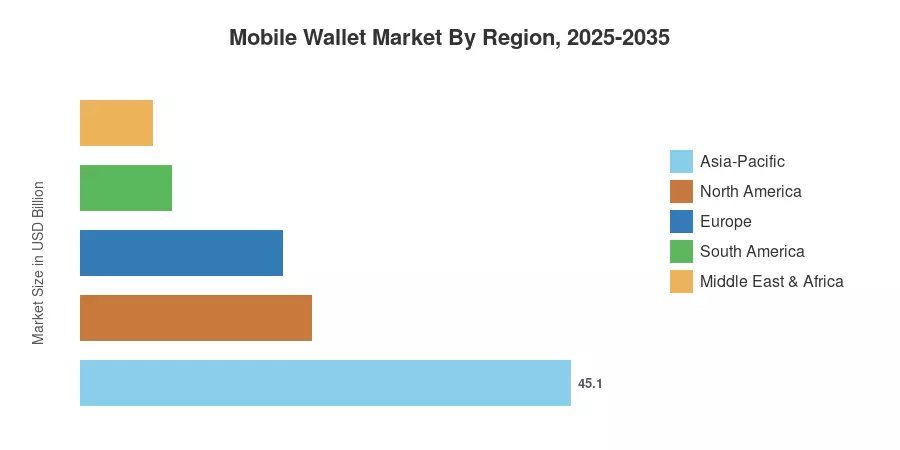
Asia-Pacific commands roughly 45.1% of 2025 revenue, led by China's duopoly and India's UPI volumes. Africa, though smaller in absolute terms, is the quickest-growing region at a 16.9% CAGR as mobile-money balances migrate into interoperable e-wallet financial services. North America remains the second-largest contributor, propelled by tap-to-pay adoption. The coming decade favors operators who convert payment frequency into broader financial relationships.

Key Report Takeaways

• By Technology / Mode

  • Proximity transactions led the Mobile Wallet Market with a 58.9% revenue share in 2025, reflecting entrenched in-store tap-to-pay behavior
  • Remote payments are advancing at a 17.6% CAGR through 2035 as e-commerce checkout shifts to smartphone payment solutions

• By Sector / Application

  • Retail and in-store payments generated USD 84.20 billion in 2025 within the Mobile Wallet Market, the single largest application pool
  • Bill payments and recharge form the fastest-growing application at an 18.4% CAGR, driven by utility digitization

• By Region

Market Size and Forecast (2021–2035)

MRFR sizes the Mobile Wallet Market using a bottom-up transaction-value model, triangulating central-bank payment statistics, operator disclosures, and merchant-acquirer data, then reconciling against top-down macro indicators. Figures are benchmarked against published estimates and calibrated to MRFR's proprietary forecast framework.
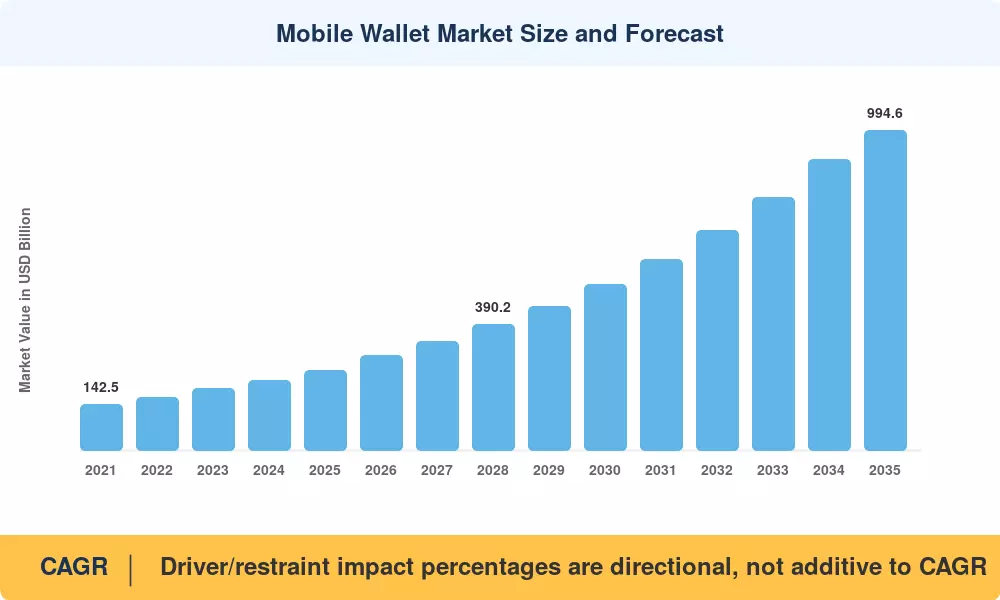
Mobile Wallet Market Size and Forecast
Our Impact
Enabled $4.3B Revenue Impact for Fortune 500 and Leading Multinationals
Partnering with 2000+ Global Organizations Each Year
30K+ Citations by Top-Tier Firms in the Industry

Driver Impact Analysis

Driver ~% Impact on CAGR Geographic Relevance Impact Timeline
Instant-payment infrastructure 24% APAC, South America Short-term (≤2 yr)
QR-code merchant acceptance 19% APAC, Africa Short-term (≤2 yr)
Super-app ecosystem expansion 17% APAC Medium-term (2–4 yr)
Contactless mobile payments adoption 15% North America, Europe Medium-term (2–4 yr)
Biometric authentication uptake 11% Global Long-term (≥4 yr)
Cross-border interoperability 9% Europe, Asia Long-term (≥4 yr)
Financial-inclusion mandates 5% Africa, South Asia Long-term (≥4 yr)


Instant-Payment Infrastructure

National real-time rails are the single strongest demand engine. India's UPI processed over 18 billion monthly transactions by late 2025, while Brazil's Pix surpassed BRL 17 trillion in annual volume. These public utilities lower the cost of digital payment apps to near zero, pulling merchants and consumers into wallet ecosystems faster than any private incentive could.

QR-Code Merchant Acceptance

In markets where card terminals have never been widely used, contactless mobile payments have become more accessible thanks to inexpensive, printable QR acceptance. By 2025, more than 350 million QR codes will be deployed, according to the Reserve Bank of India. This would allow micro-merchants to accept smartphone payment options without having to invest in hardware.

Super-App Ecosystem Expansion

Lending, insurance, and commerce are being bundled around the payment core by wallet operators. WeChat Pay and Alipay in China provide examples of how e-wallet financial services compound engagement; operator filings show that ancillary revenue currently surpasses 30% of platform income [10].

Contactless Mobile Payments Adoption

Tap-to-pay penetration in developed markets continues to displace cash. Visa reported that contactless mobile payments accounted for more than two-thirds of in-person transactions across several European corridors by 2025, reinforcing NFC wallet technology as the default checkout layer.

Restraints Impact Analysis

The restraint impacts shown are directional estimates of downward pressure on growth, not subtractive CAGR inputs.

Restraint ~% Drag on CAGR Geographic Relevance Impact Timeline
Interchange-fee caps 22% Europe, North America Medium-term (2–4 yr)
Fragmented KYC rules 19% Global Short-term (≤2 yr)
Rising biometric fraud 17% Global Medium-term (2–4 yr)
Interoperability gaps 14% Africa, South America Long-term (≥4 yr)
Data-localization regulation 11% Asia, EU Long-term (≥4 yr)


Interchange-Fee Caps

Regulatory ceilings on interchange compress the economics that fund wallet rewards. The EU Interchange Fee Regulation holds consumer-card fees at 0.3%, squeezing the rebate pools that historically drove digital payment apps adoption and forcing operators toward subscription and value-added revenue.

Fragmented KYC Rules

Cross-border onboarding friction is increased by disparate know-your-customer policies. Inconsistent identity standards were identified by the Financial Action Task Force as a hindrance to the expansion of e-wallet financial services. In multi-jurisdiction deployments, compliance costs are anticipated to increase per-user acquisition expenses by 8–12%.

Rising Biometric Fraud

The attack surface of biometric authentication grows as it does. Operators are layering behavioral analytics on top of NFC wallet technology at material expense due to a dramatic increase in deepfake and synthetic-identity spoofing attempts, according to industry incident data.

Mobile Wallet Market Opportunities

Emerging-Market Wallet Leapfrogging

Sub-Saharan Africa offers the clearest greenfield. As mobile-money balances convert into interoperable wallets, operators can capture first-time digital consumers entirely bypassing card rails Pan-African settlement initiatives create room for cross-border smartphone payment solutions at scale.

Data Monetization and Embedded Finance

Transaction data is an underexploited asset. Wallets that layer credit scoring, merchant analytics, and targeted offers atop the payment stream open high-margin revenue beyond interchange , turning e-wallet financial services into lending and insurance distribution platforms.

Cross-Border Remittance Corridors

Remittance flows exceeding USD 650 billion annually remain costly and slow. Wallet-to-wallet interoperability can undercut legacy money-transfer operators, and contactless mobile payments rails linking diaspora corridors represent a sizeable untapped pool

Transit and Toll Integration

Account-based ticketing converts daily commutes into recurring wallet engagement. Cities deploying open-loop NFC wallet technology at fare gates lock in high-frequency usage, a proven on-ramp for broader digital payment apps adoption.

Merchant Value-Added Services

Beyond acceptance, wallets can sell loyalty, working-capital advances, and inventory tools to small merchants, deepening stickiness while diversifying away from transaction fees

Mobile Wallet Market Future Outlook

AI-Native Fraud and Personalization

Machine learning will move from back-office scoring to real-time wallet intelligence. Operators are deploying behavioral models that authenticate transactions in milliseconds and surface contextual offers, transforming digital payment apps into predictive financial companions while countering increasingly sophisticated synthetic fraud.

Platform Economics and Embedded Finance

The next decade rewards ecosystems over standalone payment tools. Wallets that embed lending, insurance, and investment products will capture lifetime value far beyond transaction margins, mirroring how super-apps monetize e-wallet financial services across adjacent verticals.

Central-Bank Digital Currency Integration

CBDC pilots across more than 130 jurisdictions, per Bank for International Settlements tracking, will increasingly route through wallet front-ends. Interoperability between retail CBDCs and private NFC wallet technology becomes a defining competitive battleground after 2028.

Cross-Border Interoperability Supercycle

Linked instant-payment systems—UPI-PayNow, ASEAN QR, Pan-African rails—point toward frictionless international contactless mobile payments. The World Bank's target to cut remittance costs below 3% accelerates wallet-to-wallet corridors as the cheapest cross-border channel.

Mobile Wallet Market Segmentation

By Mode of Payment

Segment Metric Primary Demand Driver
Proximity 58.9% share (2025) In-store tap-to-pay
Remote 17.6% CAGR E-commerce checkout


Proximity payments dominate the Mobile Wallet Market because physical retail still anchors most daily spend, and NFC wallet technology has made tap-to-pay frictionless. Remote payments, however, grow faster as mobile commerce and in-app checkout normalize smartphone payment solutions for digital goods and services.

By Wallet Type

Segment Metric Primary Demand Driver
Closed 42.1% share (2025) Retailer loyalty programs
Semi-Closed USD 96.40 B (2025) Merchant networks
Open 16.3% CAGR Bank-linked interoperability


Closed wallets retain the largest share within the Mobile Wallet Market, sustained by retailer-branded balances and loyalty lock-in. Open wallets grow fastest, as bank-linked interoperability lets consumers spend anywhere, turning e-wallet financial services into universal payment instruments.

By Application

Segment Metric Primary Demand Driver
Retail & In-Store 31.2% share (2025) Daily merchant spend
Mobile Commerce USD 52.30 B (2025) App-based checkout
Money Transfer & Remittance 16.8% CAGR Cross-border flows
Bill Payments & Recharge 18.4% CAGR Utility digitization
Transport & Toll 15.2% CAGR Account-based ticketing
More 14.1% CAGR Niche verticals


Retail and in-store payments lead application revenue, reflecting the centrality of everyday merchant spend to digital payment apps. Bill payments and recharge expand quickest, as utilities, telecoms, and governments push recurring obligations onto contactless mobile payments rails.

By End-User

Segment Metric Primary Demand Driver
Personal 75.4% share (2025) Consumer ubiquity
Business 16.9% CAGR Expense and payroll digitization


Personal wallets dominate transaction volume across the Mobile Wallet Market, driven by mass consumer adoption of smartphone payment solutions. Business wallets grow faster as SMEs adopt e-wallet financial services for supplier payments, payroll, and expense management.

Regional Market Share Analysis

Region Metric Primary Investment Themes
North America 21.3% share (2025) Tap-to-pay, embedded finance
Europe 18.6% share (2025) Digital euro, open banking
Asia-Pacific 45.1% share (2025) Super-apps, UPI rails
South America 8.4% share (2025) Pix expansion, remittances
Middle East & Africa 6.6% share (2025) Mobile-money interoperability
Total 100.0%


North America

Country Metric Key Driver
US USD 41.20 B (2025) Tap-to-pay ubiquity
Canada 14.8% CAGR Contactless transit
Mexico 16.1% CAGR Financial inclusion push


North America's growth in the Mobile Wallet Market is propelled by issuer-led tap-to-pay defaults and the integration of digital payment apps into device ecosystems. The US Consumer Financial Protection Bureau's open-banking rulemaking is expanding data portability, accelerating embedded e-wallet financial services across retail and gig-economy platforms.

Europe

Country Metric Key Driver
Germany 13.9% CAGR Open-banking adoption
UK USD 12.40 B (2025) Contactless saturation
France 14.2% CAGR Mobile commerce
Italy 15.6% CAGR Cashless incentives
Spain 15.1% CAGR Tourism payments
Nordic Countries 11.8% CAGR Cash displacement
Russia 12.3% CAGR Domestic rails
Rest of Europe 14.7% CAGR Cross-border travel


Europe's regulatory environment shapes its trajectory. The revised Payment Services Directive and the digital euro investigation push standardized NFC wallet technology, while interchange caps steer operators toward subscription and account-based models rather than fee-driven growth.

Asia-Pacific

Country Metric Key Driver
China USD 78.60 B (2025) WeChat Pay / Alipay duopoly
India 17.9% CAGR UPI volume surge
Japan 13.4% CAGR Cashless 2025 policy
South Korea 12.9% CAGR QR standardization
ASEAN 18.1% CAGR Cross-border QR linkage
Rest of Asia-Pacific 16.2% CAGR Mobile-first onboarding


Asia-Pacific anchors the global Mobile Wallet Market. China's duopoly and India's UPI, between them, clear tens of billions of monthly transactions, while ASEAN's cross-border QR linkage—connecting Thailand, Singapore, Malaysia, and Indonesia—turns regional travel into a contactless mobile payments corridor.

South America

Country Metric Key Driver
Brazil USD 13.70 B (2025) Pix instant payments
Argentina 18.3% CAGR Inflation-driven digitization
Rest of South America 16.4% CAGR Remittance flows


South America's expansion rides Brazil's Pix, which made instant transfers a national habit and seeded wallet adoption across income tiers. Central-bank backing for interoperable smartphone payment solutions has compressed the role of cash faster than analysts projected.

Middle East & Africa

Country Metric Key Driver
Saudi Arabia 15.8% CAGR Vision 2030 cashless goal
UAE USD 4.10 B (2025) Fintech licensing
South Africa 16.7% CAGR Mobile-money migration
Egypt 18.9% CAGR Financial inclusion
Rest of MEA 17.4% CAGR Interoperable wallets


The region's standout story is Africa's conversion of mobile-money balances into interoperable e-wallet financial services. Pan-African settlement frameworks and central-bank instant-payment projects are knitting fragmented systems into addressable wallet ecosystems.

Mobile Wallet Market By Region, 2025-2035

Competitive Benchmarking

The Mobile Wallet Market is moderately concentrated, with an estimated HHI in the 1,100–1,400 range and a top-five revenue share near 52%. Asia-Pacific incumbents hold scale advantages, while global handset platforms and challenger fintechs keep the broader field fragmented and contestable.

Company Est. Revenue Share Range Key Offerings for the Mobile Wallet Market Strategic Positioning
Alipay (Ant Group) ~14–18% Super-app payments, lending, insurance APAC ecosystem leader
WeChat Pay (Tencent) ~12–16% Social-commerce payments, mini-programs Engagement-driven scale
PayPal ~8–11% Online wallet, P2P, BNPL Cross-border e-commerce strength
Apple Pay ~7–10% NFC wallet technology, device integration Premium hardware lock-in
Google Pay ~6–9% UPI rails, tap-to-pay, bill pay Multi-market platform reach
PhonePe ~5–8% UPI payments, insurance, and lending India volume leader
Paytm ~4–7% QR acceptance, merchant services Merchant-side breadth
Samsung Wallet ~3–6% NFC and MST contactless Android device base
Grab Financial ~2–5% ASEAN super-app payments Southeast Asia footprint
M-Pesa (Safaricom) ~2–5% Mobile-money, remittance African market pioneer
Venmo (PayPal) ~1–4% Social P2P payments US consumer niche


Revenue share ranges are Market Research Future (MRFR) estimates and do not sum precisely. Source: Market Research Future (MRFR) Analysis, 2026.

Recent News & Developments

  • NPCI (Mar 2024): Expanded UPI international acceptance to additional corridors, broadening cross-border contactless mobile payments for Indian travelers [4].
  • Apple (Sep 2024): Opened NFC access on iOS to third-party developers in the EU, loosening NFC wallet technology lock-in and inviting new digital payment apps [11].
  • PayPal (Jan 2025): Launched a stablecoin-linked checkout feature, extending e-wallet financial services into tokenized settlement [5].
  • Ant Group (Jun 2024): Rolled out cross-border QR interoperability across multiple ASEAN markets, deepening regional smartphone payment solutions [10].
  • European Central Bank (Oct 2024): Advanced the digital euro to its preparation phase, shaping future wallet integration standards [13].
  • Safaricom (Apr 2025): Extended M-Pesa interoperability with regional banks, accelerating African wallet convergence [14].
  • Google (Feb 2025): Integrated account-based transit ticketing into Google Pay across several metros, reinforcing transport use cases [9].
  • Visa (Nov 2024): Reported contactless surpassing two-thirds of face-to-face transactions in key European markets, validating tap-to-pay momentum [11].

Mobile Wallet Market Report Scope

Parameter Detail
Market Scope Global Mobile Wallet Market, all wallet types and applications
Study Period 2021–2035
CAGR (2026–2035) 15.1%
Market Size Checkpoints USD 248.40 B (2025); USD 294.70 B (2026); USD 994.60 B (2035)
Fastest Growing Segments Remote payments; Bill payments & recharge; Africa
Companies Profiled 11 leading wallet operators and platforms
Valuation Currency USD Billion
CAGR Driver Disclaimer Driver/restraint impact percentages are directional, not additive to CAGR


FAQs

What integration challenges should enterprises expect when embedding Mobile Wallet Market capabilities into existing checkout systems?
Legacy point-of-sale hardware often lacks NFC certification, requiring terminal upgrades and tokenization middleware. Cross-border deployments add multi-acquirer routing complexity. Phased rollouts with sandbox testing reduce settlement-reconciliation risk [11].
How do procurement teams evaluate wallet providers beyond transaction fees?
Assess settlement speed, chargeback handling, API uptime guarantees, and fraud-liability terms. Vendor financial stability and regulatory licensing across target markets matter more than headline pricing for long-term contracts [16].
What regulatory nuance most affects cross-border Mobile Wallet Market deployments?
Data-localization laws can force in-country processing infrastructure, raising cost. Diverging KYC tiers and sanctions-screening obligations require jurisdiction-specific compliance layers rather than a single global onboarding flow [15].
How does NFC wallet technology compare with QR-based payment approaches for merchants?
NFC offers faster tap speeds and stronger encryption, but needs certified terminals. QR is near-zero cost and hardware-light, favoring micro-merchants. Many operators now support both to maximize acceptance reach [9].
What competitive risk do handset platforms pose to independent wallet operators?
Device makers controlling secure-element access can advantage their own wallets. EU NFC-opening rules ease this, but default-app placement and biometric integration still confer structural advantages to platform owners [22].
Which emerging use cases will shape the next wave of the Mobile Wallet Market?
Account-based transit ticketing, embedded micro-lending, and CBDC front-end integration are gaining traction. These extend wallets from payment tools into daily financial infrastructure, lifting engagement frequency materially [19].
How should buyers think about fraud-liability allocation in wallet contracts?
Clarify whether the provider or merchant absorbs synthetic-identity and account-takeover losses. As biometric spoofing rises, contracts increasingly tie liability to authentication-method choices and SLA-backed fraud thresholds [12].
Author
Author
Author Profile
Aarti Dhapte LinkedIn
AVP - Research
A consulting professional focused on helping businesses navigate complex markets through structured research and strategic insights. I partner with clients to solve high-impact business problems across market entry strategy, competitive intelligence, and opportunity assessment. Over the course of my experience, I have led and contributed to 100+ market research and consulting engagements, delivering insights across multiple industries and geographies, and supporting strategic decisions linked to $500M+ market opportunities. My core expertise lies in building robust market sizing, forecasting, and commercial models (top-down and bottom-up), alongside deep-dive competitive and industry analysis. I have played a key role in shaping go-to-market strategies, investment cases, and growth roadmaps, enabling clients to make confident, data-backed decisions in dynamic markets.

Research Approach


Secondary Research

The secondary research process involved comprehensive analysis of fintech databases, payment industry reports, regulatory filings, and authoritative financial technology publications. Key sources included the Bank for International Settlements (BIS), Federal Reserve Payment Systems Reports, European Central Bank (ECB) Statistical Data Warehouse, Consumer Financial Protection Bureau (CFPB), Financial Conduct Authority (FCA) UK, Payment Cards Industry (PCI) Security Standards Council, International Telecommunication Union (ITU), Global System for Mobile Communications Association (GSMA) Intelligence, World Bank Global Findex Database, IMF Financial Access Survey, Bank of England Payment Statistics, Reserve Bank of India (RBI) Digital Payment Indicators, People's Bank of China (PBOC) Financial Statistics, Singapore Monetary Authority (MAS) Fintech Reports, US Bureau of Economic Analysis (BEA) Digital Economy Data, Statista Digital Payments Outlook, McKinsey Global Payments Report, Capgemini World Payments Report, and national central bank reports from key markets.

Transaction volume statistics, regulatory compliance frameworks, mobile payment adoption trends, interoperability standards, security protocol advancements, and competitive landscape analysis across NFC, QR code, cloud-based technologies, and different payment methods like credit cards, debit cards, bank transfers, and mobile carrier billing were gathered from these sources.


Primary Research

In order to gather both qualitative and quantitative insights, supply-side and demand-side stakeholders were interviewed during the primary research process. CEOs, CTOs, VPs of Product Innovation, heads of regulatory compliance, and partnership directors from mobile wallet providers, payment network operators, banks, and fintech firms were examples of supply-side suppliers. Chief financial officers, heads of digital payments, procurement managers from retail chains and e-commerce platforms, treasury managers from utility companies, fleet managers from the travel and hospitality industries, and merchant acquiring specialists from both large and small businesses were examples of demand-side sources. In addition to gathering information on consumer onboarding tactics, transaction fee structures, merchant discount rates, regulatory compliance costs, and cross-border payment dynamics, primary research verified partnership ecosystem timescales and validated technology adoption patterns.

Primary Respondent Breakdown:

By Designation: C-level Primaries (42%), Director Level (25%), Others (33%)

By Region: North America (32%), Europe (30%), Asia-Pacific (28%), Rest of World (10%)


Market Size Estimation

Active user base analysis and transaction value mapping were used to determine the global market valuation. The approach comprised:

Finding more than fifty-five major mobile wallet companies and payment processors in North America, Europe, Asia-Pacific, Latin America, the Middle East, and Africa

Technology mapping of QR codes, cloud-based wallets, Near Field Communication (NFC), and new blockchain-enabled wallet technologies

Segmentation analysis of payment methods that includes bank transfers, credit cards, debit cards, and mobile carrier billing integrations

End-user vertical evaluation covering travel and hospitality, retail, e-commerce, utilities, and other developing industries

Platform analysis for web-based deployment models, iOS, and Android

Examination of gross transaction volumes (GTV) and net revenues related to mobile wallet activities, both reported and modeled

Coverage of providers that account for 75–80% of all mobile wallet transactions worldwide in 2024

Segment-specific valuations are derived through extrapolation using top-down (provider revenue validation against reported processing volumes) and bottom-up (active users × average transaction frequency × average transaction value by country) methods, taking into account regional regulatory impacts and currency fluctuation adjustments.

Download Free Sample

Kindly complete the form below to receive a free sample of this Report

Download PDF ×

We do not share your information with anyone. However, we may send you emails based on your report interest from time to time. You may contact us at any time to opt-out.

















