Next Generation Firewall Market (2021 - 2024)

Next Generation Firewall Market Size, Share and Research Report By Solution Type (Hardware Appliance, Virtual / Cloud-Based), By Enterprise Size (Large Enterprises, SMEs), By Deployment Mode (On-Premises, Public Cloud, Private Cloud, Hybrid Cloud), By End-User Industry (IT & Telecom, Banking, Financial Services and Insurance (BFSI), Government & Defense, Healthcare, Retail & E-Commerce, Others) and By Regional (North America, Europe, South America, Asia Pacific, Middle East and Africa) - Industry Forecast to 2035.
ID: MRFR/ICT/2364-HCR
200 Pages
Aarti Dhapte
Last Updated: June 30, 2026
Next Generation Firewall Market
Market Size
Forecast Period2021-2024
CAGR (2021-2024)15.2%
2021 Market Size6.5 USD Billion
2024 Market Size26.75 USD Billion
Key Players
Fortinet
Palo Alto Networks
Cisco Systems
Check Point Software
Juniper Networks
SonicWall
Opportunities
  • Managed NGFW-as-a-Service for SMEs
  • OT/IoT Security in Critical Infrastructure
  • Sovereign-Cloud Firewall Mandates in Emerging Markets

Next Generation Firewall Market Summary

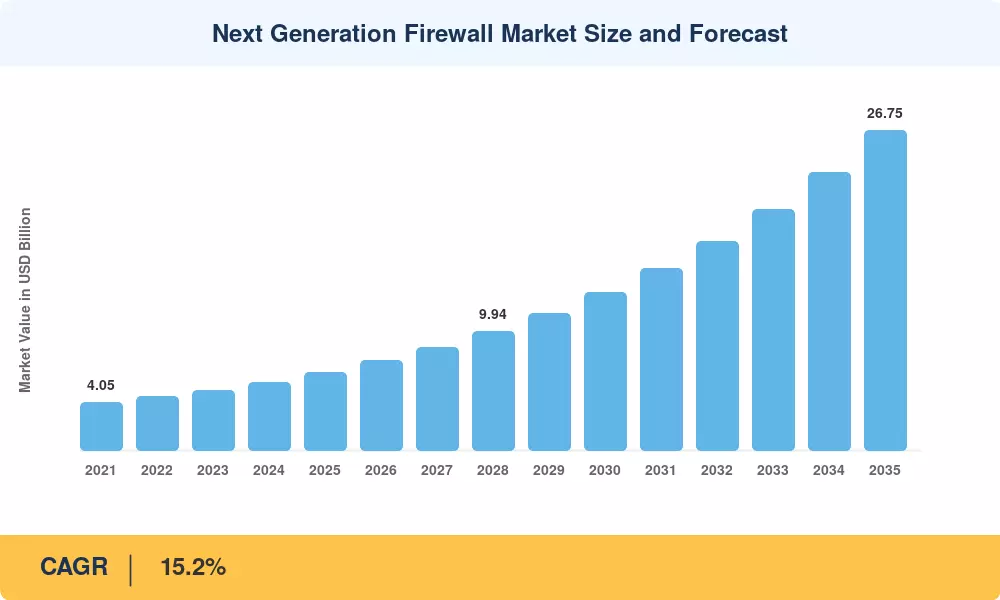
The Next-Generation Firewall Market stood at USD 6.50 billion in 2025 and is forecast to climb to USD 26.75 billion by 2035, registering a 15.2% CAGR across the 2026–2035 forecast period. Two forces are converging to accelerate spending: executive-level mandates tied to U.S. Executive Order 14028 on zero-trust adoption, and the European Union's NIS2 Directive—both compelling organizations to replace perimeter-only defenses with identity- and application-aware enforcement planes [1][2]. The result is a procurement wave that reaches well beyond traditional IT shops into operational-technology environments, healthcare networks, and sovereign-cloud programs.

Legacy stateful-inspection firewalls are giving way to platforms that unify application-aware traffic analysis, encrypted-session inspection, and real-time threat intelligence feeds on a single chassis or virtual instance. Fortinet's 2024 launch of custom ASIC-powered appliances capable of 400 Gbps threat throughput illustrates the performance benchmarks that enterprise buyers now demand [3]. Cloud-native form factors are gaining ground rapidly, with hyperscaler marketplaces hosting virtual firewall images that spin up alongside workloads in seconds rather than weeks.

North America commands roughly 38% of global revenue in the Next-Generation Firewall Market, driven by dense cloud adoption and strict federal cybersecurity frameworks. Asia-Pacific is the fastest-growing region at a 17.1% CAGR, propelled by sovereign-cloud mandates in India, Japan, and ASEAN nations. Europe holds the second-largest share, anchored by NIS2 compliance spending and cross-border data-residency requirements. The decade ahead will reward vendors that combine hardware-level throughput, AI-driven detection, and unified multi-cloud policy orchestration.


Key Report Takeaways

• By Solution Type

  • Hardware appliances accounted for roughly 58% of Next-Generation Firewall Market revenue in 2025, reflecting continued demand for dedicated throughput in data-center perimeters.
  • Virtual and cloud-based firewall deployments are on track to grow at a 16.2% CAGR through 2035 as enterprises shift workloads to hybrid environments.

• By Enterprise Size

  • Large enterprises represented approximately 74% of total spending in 2025, driven by complex multi-site architectures.
  • SMEs are projected to expand at a 17.2% CAGR, fueled by managed-security-service offerings that lower the entry barrier.

• By End-User Industry

  • IT and Telecom captured about 48% of the Next-Generation Firewall Market in 2025, reflecting dense traffic volumes and carrier-grade inspection needs.
  • BFSI is the fastest-growing vertical, registering a 16.8% CAGR as real-time fraud prevention and regulatory audits intensify.

• By Region

  • North America led with 38% of global revenue in 2025, with U.S. federal procurement cycles setting the pace.
  • Asia-Pacific is anticipated to post the highest regional CAGR of 17.1% through 2035, underpinned by data-localization mandates.


Market Size and Forecast (2021–2035)

Market Research Future's sizing methodology integrates bottom-up vendor-revenue aggregation with top-down demand-side modeling. Historical figures (2021–2024) are anchored to audited financial disclosures and channel-shipment data; forecast figures (2026–2035) layer macroeconomic indicators, enterprise IT-spending benchmarks from, and regulatory-impact assessments.
Next Generation Firewall Market Size and Forecast
Our Impact
Enabled $4.3B Revenue Impact for Fortune 500 and Leading Multinationals
Partnering with 2000+ Global Organizations Each Year
30K+ Citations by Top-Tier Firms in the Industry

Driver Impact Analysis

Driver ~% Impact on CAGR Geographic Relevance Impact Timeline
Zero-Trust Architecture Mandates ~20% Global Short-term (≤2 yr)
Cloud Workload Proliferation ~18% Global Medium-term (2–4 yr)
AI/ML-Integrated Threat Detection ~16% North America, Europe Medium-term (2–4 yr)
5G and IoT Network Expansion ~14% Asia-Pacific, Global Long-term (≥4 yr)
Regulatory Compliance Tightening ~12% Europe, North America Short-term (≤2 yr)
Ransomware and APT Escalation ~11% Global Short-term (≤2 yr)
SD-WAN and SASE Convergence ~9% North America, Europe Medium-term (2–4 yr)


Zero-Trust Architecture Mandates

The White House's OMB Memorandum M-22-09 required all federal civilian agencies to meet specific zero-trust maturity goals by the end of fiscal year 2024, triggering a multi-billion-dollar modernization pipeline [1]. Agencies replaced legacy perimeter firewalls with platforms that enforce micro-segmented, identity-verified access at every network boundary. The ripple effect is substantial: defense-industrial-base contractors and federally regulated healthcare networks now mirror these requirements in their own procurement criteria, effectively expanding the addressable buyer pool for the Next-Generation Firewall Market well beyond government IT departments.

Cloud Workload Proliferation

estimates that more than 75% of enterprise workloads will reside in public or hybrid cloud environments by 2027, up from roughly 45% in 2023 [7]. Every workload that migrates carries its own security perimeter, and organizations increasingly insist on cloud-managed firewall instances that integrate natively with infrastructure-as-code deployment pipelines. This shift converts what was a one-time appliance purchase into a recurring subscription line item, deepening the revenue base of the Next-Generation Firewall Market over the forecast horizon.

AI/ML-Integrated Threat Detection

Embedded AI engines now reduce mean-time-to-detect from hours to single-digit seconds across production NGFW platforms, while cutting false-positive rates by as much as 65–70% according to vendor-published benchmarks [8]. Palo Alto Networks' Cortex integration and Fortinet's FortiGuard AI illustrate the competitive pressure to ship inline machine-learning models that adapt to encrypted-traffic anomalies without manual signature updates. Enterprises willing to pay premium SKU pricing for these capabilities are driving average selling prices upward, contributing positively to value-based growth in the Next-Generation Firewall Market.

Ransomware and APT Escalation

Cybersecurity Ventures projects that global ransomware damages will exceed USD 265 billion annually by 2031, up from an estimated USD 42 billion in 2024 [16]. This cost trajectory makes real-time traffic inspection and automated lateral-movement blocking critical budget priorities for CISOs. Deep packet inspection firewall functionality that identifies command-and-control callbacks within encrypted sessions has moved from a premium feature to a baseline requirement, pulling mid-market organizations into higher-tier NGFW deployments.


Restraints Impact Analysis

The restraint weightings below reflect the estimated drag each factor exerts on market adoption rates. These percentages are directional and derived from buyer-sentiment surveys and total-cost-of-ownership analyses.

Restraint ~% Negative Impact on CAGR Geographic Relevance Impact Timeline
High Total Cost of Ownership ~25% Global Short-term (≤2 yr)
Encrypted Traffic Inspection Complexity ~22% Global Medium-term (2–4 yr)
Skilled Cybersecurity Talent Shortage ~20% Global Long-term (≥4 yr)
Legacy Infrastructure Lock-In ~18% Europe, Asia-Pacific Medium-term (2–4 yr)
Vendor Consolidation Fatigue ~15% North America Short-term (≤2 yr)


High Total Cost of Ownership

A Ponemon Institute study found that the five-year TCO for an enterprise-grade NGFW deployment—including licensing, maintenance, staffing, and integration—can run three to five times the initial hardware acquisition cost [17]. For mid-market firms operating on constrained security budgets, this creates a significant adoption hurdle. Managed-service bundles are emerging as a partial remedy, but price sensitivity continues to delay refresh cycles, particularly in price-conscious markets across South America and parts of Southeast Asia.

Encrypted Traffic Inspection Complexity

With more than 95% of web traffic now encrypted via TLS 1.3, organizations face a trade-off between inspection depth and session latency [18]. Decrypting, inspecting, and re-encrypting traffic at line rate demands purpose-built silicon, and many legacy NGFW appliances lose 60–80% of advertised throughput when full SSL inspection is enabled. Privacy regulations such as GDPR also restrict inspection of employee traffic in certain jurisdictions, creating policy-configuration headaches that slow enterprise rollouts of the Next-Generation Firewall Market.

Skilled Cybersecurity Talent Shortage

ISC2's 2024 Workforce Study estimates a global shortfall of 4.8 million cybersecurity professionals, with firewall-administration and security-operations roles among the hardest to fill [19]. This talent gap extends deployment timelines by an average of four to six months for complex multi-site NGFW projects, particularly in emerging economies where training infrastructure lags behind technology adoption curves.


Next Generation Firewall Market Opportunities

Managed NGFW-as-a-Service for SMEs

The Next-Generation Firewall Market is being rapidly adopted by small and mid-sized organizations, yet many lack the in-house skills to build and tune complex firewall technologies. Managed-security-service providers that integrate NGFW capabilities into tiers of subscription services that include 24/7 SOC monitoring can tap into a highly underpenetrated segment that is expected to grow at a 17.2% CAGR through 2035.


OT/IoT Security in Critical Infrastructure

Industrial environments using SCADA and ICS protocols represent a greenfield potential since government mandates require network segregation between IT and OT zones [11]. The U.S. CISA's Cross-Sector Cybersecurity Performance Goals specifically mention perimeter firewalling for operational-technology environments, providing a regulatory tailwind for NGFW companies that build OT-specific protocol parsers and ruggedized form factors.


Sovereign-Cloud Firewall Mandates in Emerging Markets

India’s MeitY cloud-security standards, Indonesia’s GR 71 data-localization law, and Saudi Arabia’s NCA Essential Cybersecurity Controls all mandate local deployment of firewall inspection for government and financial workloads [14]. Vendors that develop in-country data-center alliances and obtain sovereign certifications will gain share in areas where cloud-managed firewall adoption remains fledgling.


SASE-Integrated Firewall Platforms

The merging of SD-WAN, cloud-access security brokers, and zero-trust network access into unified SASE platforms is changing the way organizations purchase firewall capability [7]. Vendors who can offer a single-license, single-console experience across branch, campus and cloud enforcement points will achieve premium pricing and longer contract periods, moving the revenue model from CapEx to high-margin recurring subscriptions.


Threat-Intelligence Data Monetization

Firewall telemetry represents one of the richest sources of network-behavior data in any enterprise. Vendors that anonymize and aggregate this telemetry to power industry-specific threat-intelligence feeds create an ancillary revenue stream while deepening customer lock-in. Early movers such as Palo Alto Networks' Unit 42 and Fortinet's FortiGuard Labs have demonstrated that threat-research monetization can improve gross margins by two to four percentage points [6][3].


Next Generation Firewall Market Future Outlook

AI-Driven Autonomous Threat Response

By 2030, leading NGFW platforms will operate in closed-loop mode, where AI engines autonomously detect threats, adjust firewall policies, and remediate compromised sessions without human intervention [8]. projects that 60% of large enterprises will rely on AI-augmented security operations by 2028, with the firewall serving as the primary automated enforcement point. This shift will compress staffing requirements for firewall administration while expanding the Next-Generation Firewall Market toward higher-value, outcome-based pricing models.

SASE and Platform Convergence

The boundary between discrete NGFW products and unified SASE platforms will blur significantly by 2028–2030 [7]. Vendors that package firewall, SD-WAN, CASB, and ZTNA into a single subscription stand to increase per-customer lifetime value by 40–60% compared with standalone appliance sales. This architectural convergence will concentrate market share among platform-scale vendors and accelerate the decline of single-function firewall specialists.

Quantum-Resilient Encryption Readiness

NIST's post-quantum cryptography standards—finalized in 2024—set a migration timeline that begins affecting the Next-Generation Firewall Market in earnest by 2029 [10]. Firewalls will need to inspect traffic encrypted with lattice-based algorithms such as CRYSTALS-Kyber and CRYSTALS-Dilithium, requiring new ASIC designs and firmware update architectures. Vendors that ship crypto-agile platforms ahead of compliance deadlines will capture upgrade-cycle revenue before the broader market reaches mandatory-transition milestones.

Zero-Trust Maturation and Micro-Segmentation

As zero-trust frameworks mature from perimeter-centric to workload-centric models, NGFWs will evolve into distributed micro-segmentation engines embedded at the hypervisor and container level [1]. The U.S. DOD's Thunderdome program already enforces this architecture across classified networks, and civilian adoption will follow as commercial implementations prove operationally viable. This evolution expands the unit economics of the Next-Generation Firewall Market from a per-site to a per-workload billing model, dramatically increasing the addressable device count.


Next Generation Firewall Market Segmentation

By Solution Type

Segment Key Metric (2025) Primary Demand Driver
Hardware Appliance 58% revenue share Data-center perimeter throughput requirements
Virtual / Cloud-Based 16.2% CAGR (2026–2035) Hybrid-cloud workload migration


Hardware appliances remain the revenue backbone of the Next-Generation Firewall Market because carrier-grade and data-center environments demand deterministic latency that only purpose-built ASIC platforms can deliver. Fortinet's FortiGate 7000 series and Palo Alto Networks' PA-7500 chassis exemplify the performance tier that hyperscale operators require [3][6]. Virtual and cloud-based firewalls, however, are closing the gap as cloud-service providers embed firewall-as-a-service into their native networking stacks, removing deployment friction for DevOps teams.

By Enterprise Size

Segment Key Metric (2025) Primary Demand Driver
Large Enterprises 74% revenue share Multi-site, multi-cloud policy complexity
SMEs 17.2% CAGR (2026–2035) Managed-security-service subscription adoption


Large enterprises dominate the Next-Generation Firewall Market in absolute terms, driven by sprawling network architectures that span dozens of branch offices, co-location facilities, and public-cloud regions. SMEs, by contrast, are the faster-growing segment because managed-service providers have packaged enterprise-grade firewall capabilities into monthly subscriptions that eliminate the capital outlay and staffing burden that previously kept these organizations on legacy stateful-inspection platforms.

By Deployment Mode

Segment Key Metric (2025) Primary Demand Driver
On-Premises 47% revenue share Regulatory data-residency requirements
Public Cloud 15.8% CAGR (2026–2035) Cloud-native workload security
Private Cloud USD 1.12 Billion Enterprise-controlled infrastructure
Hybrid Cloud 17.4% CAGR (2026–2035) Multi-environment policy consistency


On-premises deployments still lead in the Next-Generation Firewall Market, particularly in regulated industries where data-sovereignty rules prohibit routing traffic through external inspection points. Hybrid-cloud deployment is the fastest-growing mode because it mirrors how enterprises actually operate—splitting workloads between private data centers and public-cloud regions while demanding a single, unified firewall policy that travels with the application.

By End-User Industry

Segment Key Metric (2025) Primary Demand Driver
IT & Telecom 48% revenue share Carrier-grade traffic inspection at scale
BFSI 16.8% CAGR (2026–2035) Real-time fraud prevention and regulatory audits
Government & Defense USD 0.72 Billion National cybersecurity mandates
Healthcare 15.3% CAGR (2026–2035) HIPAA and patient-data protection
Retail & E-Commerce USD 0.31 Billion PCI-DSS compliance and DDoS mitigation


IT and Telecom is the largest vertical in the Next-Generation Firewall Market, a position reinforced by the sheer volume of traffic that service providers inspect across backbone and edge networks. BFSI is accelerating fastest because financial regulators worldwide—from the U.S. OCC to the European Banking Authority—are mandating real-time network-threat monitoring as a condition of operational-resilience certification.


Regional Market Share Analysis

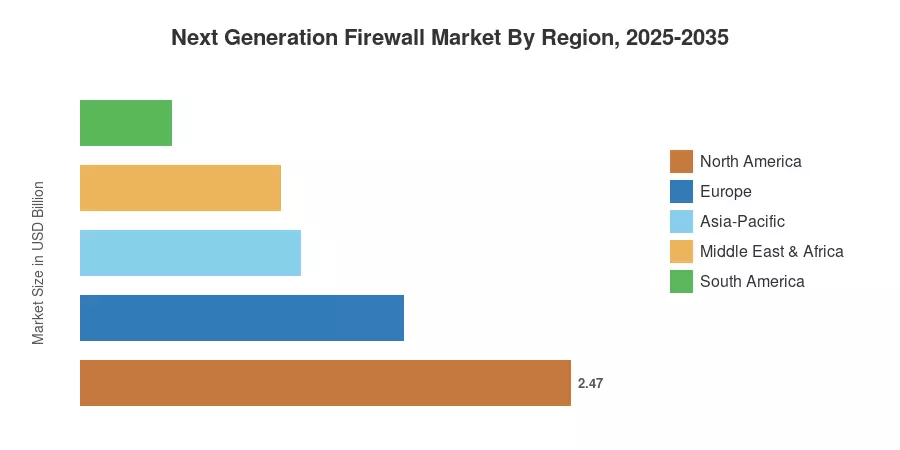
Region Key Metric (2025) Primary Investment Themes
North America 38% revenue share Federal zero-trust mandates; cloud-first IT modernization
Europe USD 1.63 Billion NIS2 compliance; cross-border data-residency enforcement
Asia-Pacific 17.1% CAGR (2026–2035) Sovereign-cloud buildouts; 5G security requirements
South America USD 0.46 Billion Financial-sector digitization; telecom infrastructure expansion
Middle East & Africa 15.5% CAGR (2026–2035) National cybersecurity strategies; smart-city programs
Total USD 6.50 Billion

The Next-Generation Firewall Market exhibits a clear geographic hierarchy, with mature markets leading in absolute spending and emerging regions driving the highest growth rates. Regional investment themes range from federal compliance mandates in North America to data-sovereignty legislation in Asia-Pacific and the Middle East.


North America

Country Key Metric Key Driver
United States ~68% of regional revenue Federal procurement (FedRAMP, CMMC)
Canada 14.8% CAGR Critical-infrastructure protection act
Mexico USD 0.27 Billion Banking-sector digital transformation


The United States remains the single largest national market for the Next-Generation Firewall Market, anchored by Department of Defense modernization contracts and FedRAMP-authorized cloud-firewall deployments. Canada's Critical Cyber Systems Protection Act is catalyzing spending in energy and transportation sectors, while Mexico's expanding fintech ecosystem is pulling financial institutions toward enterprise-grade perimeter security for the first time.

Europe

Country / Group Key Metric Key Driver
Germany ~24% of regional revenue Industry 4.0 OT security
United Kingdom 15.0% CAGR Post-Brexit national cyber strategy
France USD 0.23 Billion Defense and critical-infrastructure programs
Italy ~10% of regional revenue Digital-government transformation
Spain 14.5% CAGR Telecom modernization
Nordic Countries USD 0.15 Billion Data-center corridor expansion
Russia ~6% of regional revenue Import-substitution security programs
Rest of Europe USD 0.18 Billion EU Digital Decade compliance


Europe's growth in the Next-Generation Firewall Market is heavily shaped by NIS2, which extended mandatory cybersecurity obligations to over 160,000 entities across the bloc starting January 2025 [2]. Germany's BSI is enforcing granular logging and inspection requirements for critical-infrastructure operators, while the UK's National Cyber Strategy 2.0 allocates GBP 2.6 billion over five years for cyber resilience—much of it flowing into network-perimeter upgrades.

Asia-Pacific

Country / Group Key Metric Key Driver
China ~32% of regional revenue Cybersecurity Law enforcement and domestic vendor preference
India 18.2% CAGR Digital India and MeitY cloud mandates
Japan USD 0.28 Billion Critical-infrastructure protection (NISC guidelines)
South Korea ~12% of regional revenue 5G security certification requirements
ASEAN 17.5% CAGR Data-localization laws (Indonesia GR 71, Vietnam Decree 13)
Rest of Asia-Pacific USD 0.11 Billion Broadband expansion programs


Asia-Pacific is the engine of growth for the Next-Generation Firewall Market, with India and ASEAN nations posting the highest country-level CAGRs. India's Digital Personal Data Protection Act requires organizations handling significant personal data volumes to deploy network-inspection capabilities that meet government-prescribed standards, directly benefiting NGFW adoption. Japan's revised National Center of Incident Readiness guidelines now mandate next-generation firewalling for all designated critical-infrastructure operators across 14 sectors.

South America

Country Key Metric Key Driver
Brazil ~52% of regional revenue Central Bank Resolution 4,893 (financial cybersecurity)
Argentina 15.8% CAGR Cloud migration in banking sector
Rest of South America USD 0.10 Billion Government digitization programs


Brazil dominates the South American Next-Generation Firewall Market, driven by stringent Central Bank cybersecurity resolutions that mandate real-time traffic inspection for all regulated financial institutions. Argentina's growing fintech ecosystem is adopting NGFW platforms to secure open-banking API gateways, while Chile and Colombia are investing in public-sector network modernization funded by multilateral development-bank loans.

Middle East & Africa

Country Key Metric Key Driver
Saudi Arabia ~28% of regional revenue NCA Essential Cybersecurity Controls
UAE 16.5% CAGR Smart-city and EXPO legacy infrastructure
South Africa USD 0.055 Billion POPIA data-protection compliance
Egypt ~8% of regional revenue National telecom modernization
Rest of MEA USD 0.10 Billion Oil-and-gas OT security requirements


Saudi Arabia's Vision 2030 program channels substantial cybersecurity investment through the National Cybersecurity Authority, which requires all government and critical-sector entities to deploy next-generation firewalling with integrated threat intelligence [14]. The UAE's position as a regional digital hub—reinforced by smart-city programs in Abu Dhabi and Dubai—sustains a high adoption rate. South Africa's POPIA enforcement is pushing financial-services firms toward NGFW platforms that provide data-flow auditing.


Next Generation Firewall Market By Region, 2025-2035

Competitive Benchmarking

Market concentration in the Next-Generation Firewall Market sits at a medium level, with the top four vendors collectively controlling an estimated 65–75% of worldwide shipments as of 2024. The Herfindahl-Hirschman Index (HHI) for the sector falls in the 1,500–2,000 range, indicating moderate concentration with competitive fringe activity from specialist and regional players. Strategic differentiation centers on three axes: custom-silicon performance, AI-driven detection fidelity, and breadth of cloud-platform integrations.

Company Est. Revenue Share Range Key Offerings Strategic Positioning
Fortinet ~18–22% FortiGate appliance series; FortiOS; FortiGuard AI ASIC-first performance leader; broad SME-to-enterprise portfolio
Palo Alto Networks ~16–20% PA-Series hardware; Prisma SASE; Cortex XSIAM Platform-play pioneer; premium AI-SOC integration
Cisco Systems ~12–16% Cisco Secure Firewall (Firepower); SecureX Networking incumbency; embedded firewall in campus/WAN fabric
Check Point Software ~8–12% Quantum series; Infinity architecture; ThreatCloud AI Consolidated security management; strong European presence
Juniper Networks ~4–6% SRX Series; Juniper Security Director Cloud AI-driven networking convergence (Mist AI)
SonicWall ~3–5% TZ, NSa, NSsp series; Capture ATP Cost-effective SME-focused appliance portfolio
Huawei Technologies ~3–5% USG series; HiSecEngine; cloud-native firewall Dominant Asia-Pacific / MEA channel footprint
Barracuda Networks ~2–4% CloudGen Firewall; SecureEdge MSP-centric delivery model; born-in-cloud architecture
Sophos ~2–3% XGS Series; Sophos Central Synchronized-security ecosystem with endpoint correlation
WatchGuard Technologies ~1–3% Firebox appliances; WatchGuard Cloud Channel-driven mid-market specialist


Recent News & Developments

  • Palo Alto Networks (November 2023): Introduced Strata Cloud Manager, a unified AI-operations console that automates policy recommendations across more than 50,000 firewall instances simultaneously [6].
  • Cisco Systems (March 2024): Completed the USD 28 billion acquisition of Splunk, integrating SIEM telemetry with Cisco Secure Firewall to create a closed-loop detection-and-response pipeline [22].

Next Generation Firewall Market Report Scope

Parameter Detail
Market Scope Global Next-Generation Firewall Market covering hardware, virtual, and cloud-native deployments
Study Period 2021–2035
CAGR (2026–2035) 15.2%
Base Year 2025 (USD 6.50 Billion)
Forecast Endpoint 2035 (USD 26.75 Billion)
Fastest Growing Segment SMEs by enterprise size (17.2% CAGR); Hybrid Cloud by deployment mode (17.4% CAGR)
Companies Profiled 10 (Fortinet, Palo Alto Networks, Cisco, Check Point, Juniper, SonicWall, Huawei, Barracuda, Sophos, WatchGuard)
Valuation Currency USD Billion


FAQs

How does an NGFW differ from a traditional stateful-inspection firewall?
Traditional firewalls filter traffic by port and protocol only. NGFWs add application-layer visibility, user-identity correlation, and integrated threat prevention—enabling policy enforcement based on application behavior rather than port numbers [18].
What is the typical payback period for an enterprise NGFW deployment?
Most organizations recover their NGFW investment within 14–20 months through reduced incident-response costs and consolidated point-product licenses. Enterprises with over 5,000 endpoints tend to reach breakeven faster [17].
How are procurement teams evaluating NGFW vendors in 2025?
Buyers prioritize SSL/TLS inspection throughput at production scale, single-console management across hybrid clouds, and native SIEM/SOAR integration. Independent lab certifications such as ICSA Labs validation carry significant weight in shortlist decisions [18].
What role does the Next-Generation Firewall Market play in SASE adoption?
NGFWs serve as the foundational enforcement engine within most SASE frameworks, providing application-aware policy controls that cloud-access brokers alone cannot replicate [7].
How will post-quantum cryptography affect the Next-Generation Firewall Market?
NIST's post-quantum standards require vendors to support lattice-based algorithms for encrypted-traffic inspection by 2028–2030. Early movers offering crypto-agile firmware updates will capture upgrade-cycle revenue ahead of compliance deadlines [10].
What integration challenge is most common during NGFW migration?
Policy-rule migration from legacy firewalls—often involving tens of thousands of rules requiring deduplication and revalidation—is the primary obstacle. Pre-migration rule audits reduce deployment timelines by roughly 40% [20].
How does the Next-Generation Firewall Market address encrypted-traffic blind spots?
Modern NGFWs decrypt and inspect TLS 1.3 traffic inline using custom ASIC offload engines without degrading throughput below acceptable thresholds. Selective decryption policies balance privacy compliance with threat visibility [18].    
Author
Author
Author Profile
Aarti Dhapte LinkedIn
AVP - Research
A consulting professional focused on helping businesses navigate complex markets through structured research and strategic insights. I partner with clients to solve high-impact business problems across market entry strategy, competitive intelligence, and opportunity assessment. Over the course of my experience, I have led and contributed to 100+ market research and consulting engagements, delivering insights across multiple industries and geographies, and supporting strategic decisions linked to $500M+ market opportunities. My core expertise lies in building robust market sizing, forecasting, and commercial models (top-down and bottom-up), alongside deep-dive competitive and industry analysis. I have played a key role in shaping go-to-market strategies, investment cases, and growth roadmaps, enabling clients to make confident, data-backed decisions in dynamic markets.

Research Approach


Secondary Research

The secondary research process involved comprehensive analysis of cybersecurity frameworks, threat intelligence databases, regulatory compliance mandates, and authoritative IT security standards. Key sources included the National Institute of Standards and Technology (NIST) Cybersecurity Framework, U.S. Cybersecurity and Infrastructure Security Agency (CISA) Advisories & Alerts, European Union Agency for Cybersecurity (ENISA) Threat Landscape Reports, International Organization for Standardization (ISO/IEC 27001/27017/27018), International Telecommunication Union (ITU) Global Cybersecurity Index, U.K. National Cyber Security Centre (NCSC) Guidelines, FedRAMP (Federal Risk and Authorization Management Program) Authorized Product List, Cloud Security Alliance (CSA) Security Guidance, Ponemon Institute Cost of Data Breach Studies, and Verizon Data Breach Investigations Report (DBIR). Regional regulatory sources included the EU Cybersecurity Act (CSA), GDPR Network and Information Security (NIS2) Directive, Singapore Cybersecurity Agency (CSA) National Cybersecurity Masterplan, China Cybersecurity Law & Multi-Level Protection Scheme (MLPS 2.0), and India CERT-In Advisory Reports. These sources were utilized to collect cyber threat incidence statistics, regulatory compliance requirements across BFSI and critical infrastructure, cloud security adoption benchmarks, zero-trust architecture implementation trends, and competitive positioning analysis for hardware appliances, virtual NGFW solutions, and cloud-native firewall-as-a-service offerings.


Primary Research

Qualitative and quantitative insights were obtained by interviewing supply-side and demand-side stakeholders during the primary research process. NGFW vendors, managed security service providers (MSSPs), and systems integrators included CEOs, CTOs, VPs of Engineering, product management heads, and channel strategy executives as supply-side sources. Chief Information Security Officers (CISOs), Chief Information Officers (CIOs), IT infrastructure directors, network security architects, and procurement heads from Fortune 500 enterprises, government defense agencies, financial institutions, healthcare providers, and mid-market organizations comprised demand-side sources. The primary research validated deployment type preferences (on-premises vs. cloud-native vs. hybrid), confirmed AI/ML-driven threat detection pipeline roadmaps, and gathered insights on NGFW purchasing criteria, pricing elasticity between hardware and virtualized solutions, and managed firewall service adoption dynamics.

Primary Respondent Breakdown:

By Designation: C-level Primaries (32%), Director Level (31%), Others (37%)

By Region: North America (38%), Europe (25%), Asia-Pacific (28%), Rest of World (9%)


Market Size Estimation

Global market valuation was derived through revenue mapping and deployment volume analysis across hardware appliances, virtualized software licenses, and cloud-native firewall-as-a-service subscriptions. The methodology included:

Identification of 40+ key NGFW vendors and pure-play firewall-as-a-service providers across North America, Europe, Asia-Pacific, Latin America, and Middle East & Africa

Product mapping across hardware-based NGFW, virtual NGFW (VMware/Hyper-V/KVM), containerized microsegmentation firewalls, and cloud-native firewall services (AWS/Azure/GCP integrations)

Analysis of reported and modeled annual revenues specific to firewall product portfolios, excluding adjacent network security revenues (e.g., standalone IDS/IPS, VPN concentrators)

Coverage of vendors representing 72-77% of global market share in 2024, including direct sales and channel partner contributions

Extrapolation using bottom-up (enterprise seat count × deployment density × blended ASP by component) and top-down (vendor revenue validation against regional IT security spending reports) approaches to derive segment-specific valuations for on-premises, cloud-based, and hybrid deployment architectures

Download Free Sample

Kindly complete the form below to receive a free sample of this Report

Download PDF ×

We do not share your information with anyone. However, we may send you emails based on your report interest from time to time. You may contact us at any time to opt-out.

















