• Cat-intel
  • MedIntelliX
  • Resources
  • About Us
  • Hero Background
    English
    Chinese
    French
    Japanese
    Korean
    German
    Spanish

    Non Woven Abrasive Market Analysis

    ID: MRFR/CnM/3103-CR
    188 Pages
    Chitranshi Jaiswal
    June 2025

    Non-Woven Abrasives Market Research Report Information by Substrate (Metal, Glass, Plastic, Composite, Wood, Others), by Product (Hand Pads, Rolls, Discs, Belts, Wheels, Brushes), by Application (Deburring, Finishing, Cleaning, Polishing, Others), by End-Use Industry (Transportation, Building & Construction, Electrical & Electronics, Industrial Machinery, Others), and Region (North Amer...

    Share:
    Download PDF ×

    We do not share your information with anyone. However, we may send you emails based on your report interest from time to time. You may contact us at any time to opt-out.

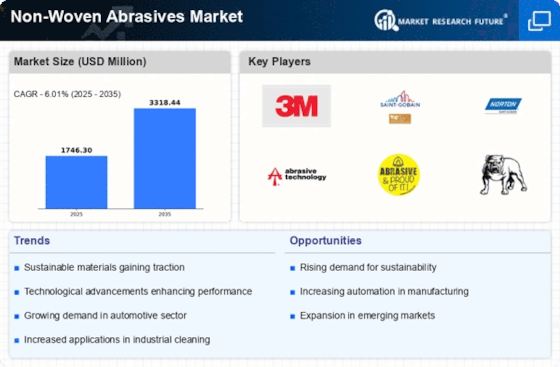
    Non Woven Abrasive Market Infographic
    $ 4,950.0
    $ 5,950.0
    $ 7,250.0

    Market Analysis

    In-depth Analysis of Non Woven Abrasive Market Industry Landscape

    The dynamics of Non-Woven Abrasives market unfold themselves as a dynamic landscape influenced by various factors that shape its demand, supply, and overall trajectory in metal fabrication, woodworking, and automotive industries. Non-woven abrasives consist of synthetic fibers combined with abrasive grains bonded together that provide versatility for surface finishing applications such as deburring, polishing as well as cleaning. The major driver behind the demand for non-woven abrasives is basically their ability to produce consistent finishes with ease; hence there is an increasing pressure on maintaining high precision levels during production processes. These relationships between factors are most evident when one considers trends of modern metal working technology, woodworking industry dynamics as well as need for good quality surface finish across multiple sectors.

    In preparing metal surfaces for welding or removing rusts and producing fine finish non-woven abrasives are extensively used in metal fabrication industry. Factors such as adoption of advanced manufacturing methods, need for efficient surface preparation, and overall expansion of metalworking industries influence the demand for non-woven abrasives in metal fabrication. Changing abrasive formulations, customized product requirements, and increased automation demands in surface finishing processes shape the dynamics of the non-woven abrasive market in metal fabrication.

    Sanding and finishing wooden surfaces to make them look smooth and uniform can hardly do without non-woven abrasives in woodworking industry. The main drivers of non-woven abrasive use in wood working applications are influenced by furniture manufacturing trends, cabinetry as well as general emphasis on high quality wooden finishes. Changes in wood working techniques, advances made in abrasive technology as well as a preference for supplies that fulfill green initiatives have a bearing on operations within this segment.

    Non-Woven Abrasives are used for paint preparation, automotive component cleaning sanding among other tasks within the auto sector. Non-woven abrasives demand within automotive industry is driven by several factors like the complexities of latest car models or designs; efficiency gains from manufacturing point of view; Surface quality attention being paid by all stakeholders. Developments occurring in automotive manufacturing methods such as lightweight materials adoption, new alternative for finishing processes contribute to changing dynamics of nonwovens abrading markets towards automotive application fields.

    Also global economic conditions and trade policies are also part of the non-woven abrasive market dynamics since they are part of the global manufacturing supply chain. Other factors such as economic growth, trade agreements, and geopolitical events can affect production activities and demand for non-woven abrasives.

    Author
    Chitranshi Jaiswal
    Research Analyst Level I

    In her 3 years of experience in the market research field, she has handled critical cross-domain projects. She has an in-depth knowledge of market estimation & analysis, problem-solving, primary as well as secondary research, and team management.She holds an engineering degree and is an MBA professional from a well-known university, capable of evaluating the market and competitive conditions. An exceptional strategist with excellent communication skills and a passion for delivering cutting-edge & practical insights for the market. Proficient in multi-tasking, and can successfully deal with competing demands, while maintaining complete confidentiality. Generated business through active client and project development, networking, and high-quality responses. Her knowledge and skills have helped in making solid business decisions, securing funding from investors, and avoiding business failures.

    Leave a Comment

    FAQs

    How much is the Global Non-Woven Abrasives Market?

    USD 1,746.3 Million is the Non-Woven Abrasives Market in 2024

    Which Product holds the largest market share?

    The Discs segment by Product holds the largest market share and grows at a CAGR of 6.18 % during the forecast period.

    Which region holds the largest market share in the Global Non-Woven Abrasives Market?

    Asia-Pacific holds the largest market share in the Global Non-Woven Abrasives Market.

    Who are the prominent players in the Global Non-Woven Abrasives Market?

    Dynabrade Inc., Steel Shine (Uppal India), Mirka Ltd., Osborn GmbH, HERMES Schleifmittel GmbH, DeWalt, SIA Abrasives Industries AG, Carborundum Universal Limited (CUMI), Saint-Gobain, 3M Company are the prominent players in the Global Non-Woven Abrasives Market.

    Which Application of segment led the Global Non-Woven Abrasives Market?

    The Finishing segment dominated the market in 2024.

    Market Summary

    As per Market Research Future Analysis, the Global Non-Woven Abrasives Market was valued at USD 1,746.3 Million in 2024 and is projected to reach USD 3,256.9 Million by 2035, growing at a CAGR of 6.01% from 2025 to 2035. The growth is driven by increasing demand from end-use industries, particularly in automotive and aerospace sectors. The automotive industry utilizes non-woven abrasives for vehicle finishing and maintenance, with electric vehicle production further boosting demand. The Asia-Pacific region is experiencing rapid growth in aerospace, supported by rising middle-class income and investments in aviation infrastructure, which will enhance the demand for non-woven abrasives.

    Key Market Trends & Highlights

    Key trends influencing the Non-Woven Abrasives Market include technological advancements and increasing industrialization.

    • The Non-Woven Abrasives Market is expected to grow from USD 1,847.3 Million in 2025 to USD 3,256.9 Million by 2035.
    • Electric car sales grew by 35% year-on-year in 2023, highlighting increased demand for non-woven abrasives in the automotive sector.
    • Asia-Pacific is anticipated to account for approximately 40% of global passenger traffic by 2030, driving aerospace-related demand for abrasives.
    • The Discs segment dominated the market in 2024, while Hand Pads are projected to be the fastest-growing segment during the forecast period.

    Market Size & Forecast

    2024 Market Size USD 1,746.3 Million
    2035 Market Size USD 3,256.9 Million
    CAGR (2025-2035) 6.01%
    Largest Regional Market Share in 2024 Asia-Pacific

    Major Players

    Dynabrade Inc., Steel Shine (Uppal India), Mirka Ltd., Osborn GmbH, HERMES Schleifmittel GmbH, DeWalt, SIA Abrasives Industries AG, Carborundum Universal Limited (CUMI), Saint-Gobain, 3M Company

    Market Trends

    The ongoing evolution in manufacturing processes and the increasing demand for high-performance materials suggest a robust growth trajectory for the global non-woven abrasives market, driven by advancements in technology and sustainability initiatives.

    U.S. Department of Commerce

    Non Woven Abrasive Market Market Drivers

    Growing Demand in Automotive Sector

    The automotive industry is a substantial driver for the Global Non-Woven Abrasives Market Industry, as manufacturers increasingly utilize non-woven abrasives for surface finishing and polishing applications. With the automotive sector projected to expand significantly, the demand for non-woven abrasives is expected to rise correspondingly. In 2024, the market value is estimated at 1.75 USD Billion, reflecting the industry's reliance on these materials for achieving high-quality finishes. This trend indicates a potential growth trajectory, as non-woven abrasives offer advantages such as reduced risk of surface damage and enhanced efficiency, which are crucial for automotive manufacturers.

    Rising Adoption in Metal Fabrication

    Metal fabrication processes are increasingly incorporating non-woven abrasives due to their versatility and effectiveness in various applications. The Global Non-Woven Abrasives Market Industry benefits from this trend, as these abrasives provide superior surface preparation and finishing capabilities. Industries such as aerospace and construction are particularly reliant on these materials for achieving desired surface characteristics. As the demand for high-quality metal products continues to grow, the market for non-woven abrasives is likely to expand. This is evidenced by the projected market growth from 1.75 USD Billion in 2024 to an estimated 3.26 USD Billion by 2035, indicating a robust compound annual growth rate of 5.83% from 2025 to 2035.

    Increased Focus on Sustainable Practices

    Sustainability is becoming a pivotal concern across various industries, influencing the Global Non-Woven Abrasives Market Industry. Manufacturers are increasingly seeking eco-friendly alternatives to traditional abrasives, prompting a shift towards non-woven options that often utilize recycled materials. This trend aligns with global efforts to reduce environmental impact and enhance product lifecycle. As industries adopt sustainable practices, the demand for non-woven abrasives is expected to rise, driven by their lower environmental footprint. This shift not only supports corporate social responsibility initiatives but also meets consumer preferences for greener products, potentially expanding market opportunities.

    Expanding Applications Across Diverse Industries

    The versatility of non-woven abrasives is a key factor driving the Global Non-Woven Abrasives Market Industry. These materials find applications in a wide range of sectors, including woodworking, electronics, and healthcare, due to their ability to provide consistent surface finishes without damaging the substrate. As industries continue to explore new applications for non-woven abrasives, the market is poised for growth. The increasing need for high-quality finishes in various products is likely to sustain demand, contributing to the projected market expansion from 1.75 USD Billion in 2024 to 3.26 USD Billion by 2035, with a compound annual growth rate of 5.83% from 2025 to 2035.

    Technological Advancements in Abrasive Manufacturing

    Technological innovations in the production of non-woven abrasives are significantly influencing the Global Non-Woven Abrasives Market Industry. Advances in manufacturing processes, such as improved bonding techniques and the development of new fiber materials, enhance the performance and durability of these abrasives. These innovations enable manufacturers to produce abrasives that are more efficient and effective in various applications, from automotive to metalworking. As technology continues to evolve, the market is likely to witness increased competition and product differentiation, further driving growth. This dynamic environment suggests that companies investing in research and development may gain a competitive edge.

    Market Segment Insights

    Non-Woven Abrasives Market

    Non-Woven Abrasives Market Segment Insights

    Non-Woven Abrasives

    Non-Woven Abrasives System by Substrate Insights

    Based on Substrate, this segment includes Metal, Glass, Plastic, Composite, Wood, Others. The Metal segment dominated the global market in 2024, while the Plastic segment is projected to be the fastest–growing segment during the forecast period. Abrading metal is a fundamental process in metalworking that serves various purposes, from improving surface quality and preparing for further treatment to enhancing mechanical properties and achieving specific aesthetic finishes. 

    This versatility makes abrasion an essential step in manufacturing, maintenance, and finishing applications across many industries. The major reasons for this include surface preparation for various future processes to be done on the metal substrate. The presence of any contaminant on the metal substrate such as metal compounds that form with the metal reacting with the various gases in the environment.

    FIGURE 2: NON-WOVEN ABRASIVES MARKET SHARE BY SUBSTRATE 2024 AND 2035 (USD MILLION)

    Non-Woven Abrasives

    Non-Woven Abrasives System by Product Insights

    Based on Product, this segment includes Hand Pads, Rolls, Discs, Belts, Wheels, Brushes. The Discs segment dominated the global market in 2024, while the Hand Pads segment is projected to be the fastest–growing segment during the forecast period. Abrasive discs are circular tools used for grinding, sanding, and polishing applications across various industries. They are typically attached to handheld grinders or sanders, rotary tools, or specialized machines for surface preparation, material removal, and finishing tasks. Abrasive discs are made from materials such as aluminum oxide, silicon carbide, zirconia alumina, or ceramic abrasives. 

    These materials determine the disc's cutting ability and durability. The discs are backed with materials like paper, cloth, fiber, or film. This backing provides support and flexibility during use. The types of discs are typically designed based on the type of application which is used such as grinding, polishing, sanding and cutting, among others. These discs are commonly used in various sanding, polishing, cutting and other operations in large industrial installations and facilities, and other industries around the world.

    Non-Woven Abrasives

    Non-Woven Abrasives System by Application Insights

    Based on Application, this segment includes Deburring, Finishing, Cleaning, Polishing, Others. The Finishing segment dominated the global market in 2024, while the Deburring segment is projected to be the fastest–growing segment during the forecast period. Finishing in manufacturing refers to a series of processes applied to a workpiece to achieve desired surface characteristics, dimensions, and overall quality. It is a critical step that not only enhances the appearance of the final product but also ensures functionality, durability, and often regulatory compliance. 

    Finishing techniques vary widely depending on the material, application, and desired outcome. It improves the surface texture, removing imperfections such as rough spots, burrs, scratches, or machining marks left from previous operations. It enhances the appearance of the product, making it more visually appealing and professional. In summary, finishing plays a crucial role in enhancing the quality, functionality, and aesthetics of manufactured products. It involves a variety of processes tailored to achieve specific surface characteristics, ensuring that the final product meets both functional and aesthetic requirements.

    Non-Woven Abrasives

    Non-Woven Abrasives System by End-Use Industry Insights

    Based on the End-Use Industry, this segment includes Transportation, Building & Construction, Electrical & Electronics, Industrial Machinery, Others. The Transportation segment dominated the global market in 2024, while it is projected to be the fastest–growing segment during the forecast period. Nonwoven abrasives find several applications in the transportation sector, primarily for surface preparation, cleaning, and finishing tasks. They are used for preparing metal surfaces before painting or coating them. They can effectively remove rust, corrosion, old paint, and surface contaminants without damaging the underlying material. 

    This is crucial in maintaining the structural integrity of transportation vehicles such as cars, trucks, buses, and trains. In manufacturing and maintenance processes within the transportation industry, abrasives are used to clean parts and components, removing burrs, scale, and other imperfections. This ensures smooth operation and prevents premature wear and tears. These abrasives are not only effective on metal surfaces, but are also useful for other materials like plastics, composites and others. Overall, nonwoven abrasives play a significant role in maintaining the efficiency, safety, and appearance of vehicles and transportation infrastructure by ensuring proper surface preparation, cleaning, and finishing.

    Their versatility and effectiveness make them indispensable in the transportation sector's maintenance and manufacturing processes.

    Get more detailed insights about Non-Woven Abrasives Market Research Report – Forecast Till 2035

    Regional Insights

    Based on the Region, the global Non-Woven Abrasives are segmented into North America, Europe, Asia-Pacific, South America and Middle East & Africa. Major demand factors driving the Asia-Pacific market are the increasing demand for non-woven abrasives from various end-use industries and rising industrialization and manufacturing activities. The region's robust manufacturing base supports the demand for non-woven abrasives in various applications. Industries such as automotive manufacturing, electronics production, and heavy machinery fabrication require efficient surface treatment solutions, which non-woven abrasives provide due to their flexibility, consistency, and effectiveness. 

    Similar to other regions, APAC is increasingly focusing on sustainable manufacturing practices and products. Non-woven abrasives are preferred over traditional abrasives due to their lower environmental impact and reduced waste generation during production and use, aligning with regional environmental regulations and sustainability goals.

    FIGURE 3: NON-WOVEN ABRASIVES MARKET VALUE BY REGION 2024 AND 2035 (USD MILLION)

    NON-WOVEN ABRASIVES MARKET VALUE BY REGION 2024 AND 2035

    Source: Secondary Research, Primary Research, MRFR Database, and Analyst Review

    Further, the countries considered in the scope of the Application Tracking System Market are the US, Canada, Mexico, Germany, the UK, France, Spain, Italy, Russia, China, Japan, India, South Korea, Brazil, Argentina, GCC Countries, South Africa and others.

    Key Players and Competitive Insights

    Many global, regional, and local vendors characterize the Non-Woven Abrasives Market. The market is highly competitive, with all the players competing to gain market share. Intense competition, rapid advances in technology, frequent changes in government policies, and environmental regulations are key factors that confront market growth. The vendors compete based on cost, product quality, reliability, and government regulations. Vendors must provide cost-efficient, high-quality products to survive and succeed in an intensely competitive market.

    The major competitors in the market are Dynabrade Inc., Steel Shine (Uppal India), Mirka Ltd., Osborn GmbH, HERMES Schleifmittel GmbH, DeWalt, SIA Abrasives Industries AG, Carborundum Universal Limited (CUMI), Saint-Gobain, 3M Company are among others. The Non-Woven Abrasives Market is a consolidated market due to increasing competition, acquisitions, mergers and other strategic market developments and decisions to improve operational effectiveness.

    Key Companies in the Non Woven Abrasive Market market include

    Industry Developments

    December 2023: Business Finland granted Mirka Ltd. 5,89 M€ RRF (Recovery and Resilience Facility) funding to establish a circular grain manufacturing (CIGMA) plant. The CIGMA plant will utilize waste streams from the industry as well as abrasive waste from both production and end users to process and produce new circular ceramic and abrasive grains. The abrasive manufacturing industry is typically following a linear economy model where the abrasives are seen as mass-produced products with short lifetimes and challenging recycling possibilities

    February 2022: Cumi Abrasives Germany, a step down wholly owned subsidiary of Carborundum Universal Ltd (CUMI) entered into a binding share purchase agreement to buy 100% stake in Rhodius Abrasives for ₹55 million Euros (₹464 CR), according to an exchange filing.

    February 2020: Osborn GmbH announced that it acquired the Matchless Metal Polish Company in an all-cash transaction valued at $5 million. The Matchless Metal Polish Company, founded in 1885, provides a full line of metal finishing products and services including buffing compounds, buffing wheels, abrasives and chemicals with annual sales of approximately $8 million.

    Non-Woven Abrasives Market Segmentation

    Non-Woven Abrasives by Substrate Outlook

    • Metal
    • Glass
    • Plastic
    • Composite
    • Wood
    • Others

    Non-Woven Abrasives by Product Outlook

    • Hand Pads
    • Rolls
    • Discs
    • Belts
    • Wheels
    • Brushes

    Non-Woven Abrasives by Application Outlook

    • Deburring
    • Finishing
    • Cleaning
    • Polishing
    • Others

    Non-Woven Abrasives by End-Use Industry Outlook

    • Transportation
    • Building & Construction
    • Electrical & Electronics
    • Industrial Machinery
    • Others

    Non-Woven Abrasives Regional Outlook

    • North America
      • US
      • Canada
      • Mexico
    • Europe
      • Germany
      • UK
      • France
      • Spain
      • Italy
      • Russia
      • Rest of Europe
    • Asia-Pacific
      • China
      • Japan
      • India
      • South Korea
      • Rest of Asia-Pacific
    • South America
      • Brazil
      • Argentina
      • Rest of South America
    • Middle East & Africa
      • GCC Countries
      • South Africa
      • Rest of Middle East & Africa

    Future Outlook

    Non Woven Abrasive Market Future Outlook

    The Global Non-Woven Abrasives Market is projected to grow at a 5.83% CAGR from 2024 to 2035, driven by technological advancements and increasing demand in various industries.

    New opportunities lie in:

    • Develop eco-friendly non-woven abrasive products to cater to sustainability-focused consumers.
    • Leverage automation in manufacturing processes to enhance production efficiency and reduce costs.
    • Expand into emerging markets with tailored solutions for local industries and applications.

    By 2035, the Non-Woven Abrasives Market is expected to achieve robust growth, reflecting evolving industry needs and innovations.

    Market Segmentation

    Regional Outlook

    North America
    • US
    • Canada
    • Mexico

    by Substrate Outlook

    • Metal
    • Glass
    • Plastic
    • Composite
    • Wood
    • Others

    Non-Woven Abrasives by Product Outlook

    • Hand Pads
    • Rolls
    • Discs
    • Belts
    • Wheels
    • Brushes

    Non-Woven Abrasives by Application Outlook

    • Deburring
    • Finishing
    • Cleaning
    • Polishing
    • Others

    Non-Woven Abrasives by End-Use Industry Outlook

    • Transportation
    • Building & Construction
    • Electrical & Electronics
    • Industrial Machinery
    • Others

    Report Scope

    Report Attribute/Metric Details
    Market Size 2024 USD 1,746.3 Million
    Market Size 2025 USD 1,84.3 Million
    Market Size 2035 USD 3,256.9 Million
    Compound Annual Growth Rate (CAGR) 6.01% (2025-2035)
    Base Year 2024
    Forecast Period 2025-2035
    Historical Data 2019-2023
    Forecast Units Volume, Value (Kilo Tons, USD Million)
    Report Coverage Revenue Forecast, Competitive Landscape, Growth Factors, and Trends
    Segments Covered By Substrate, By Product, By Application, By End-Use Industry
    Geographies Covered North America, Europe, Asia Pacific, South America, Middle East & Africa
    Countries Covered The US, Canada, Mexico, Germany, the UK, France, Spain, Italy, Russia, China, Japan, India, South Korea, Brazil, Argentina, GCC Countries, South Africa
    Key Companies Profiled Dynabrade Inc., Steel Shine (Uppal India), Mirka Ltd., Osborn GmbH, HERMES Schleifmittel GmbH, DeWalt, SIA Abrasives Industries AG, Carborundum Universal Limited (CUMI), Saint-Gobain, 3M Company
    Key Market Opportunities ·         Rapid growth of aerospace industry in the Asia-Pacific region
    Key Market Dynamics ·         Increasing demand for non-woven abrasives from various end-use industries ·         Rising industrialization and manufacturing activities

    Market Highlights

    Author

    Chitranshi Jaiswal
    Research Analyst Level I

    She holds an experience of about 6+ years in market research and business consulting, working under the spectrum of information communication technology, telecommunications and semiconductor domains. aarti conceptualizes and implements a scalable business strategy and provides strategic leadership to the clients. her expertise lies in market estimation, competitive intelligence, pipeline analysis, customer assessment, etc.

    Leave a Comment

    Latest Comments

    John Doe
    john@example.com

    This is a great article! Really helped me understand the topic better.

    Posted on July 23, 2025, 10:15 AM
    Jane Smith
    jane@domain.com

    Thanks for sharing this. I’ve bookmarked it for later reference.

    Posted on July 22, 2025, 7:45 PM

    FAQs

    How much is the Global Non-Woven Abrasives Market?

    USD 1,746.3 Million is the Non-Woven Abrasives Market in 2024

    Which Product holds the largest market share?

    The Discs segment by Product holds the largest market share and grows at a CAGR of 6.18 % during the forecast period.

    Which region holds the largest market share in the Global Non-Woven Abrasives Market?

    Asia-Pacific holds the largest market share in the Global Non-Woven Abrasives Market.

    Who are the prominent players in the Global Non-Woven Abrasives Market?

    Dynabrade Inc., Steel Shine (Uppal India), Mirka Ltd., Osborn GmbH, HERMES Schleifmittel GmbH, DeWalt, SIA Abrasives Industries AG, Carborundum Universal Limited (CUMI), Saint-Gobain, 3M Company are the prominent players in the Global Non-Woven Abrasives Market.

    Which Application of segment led the Global Non-Woven Abrasives Market?

    The Finishing segment dominated the market in 2024.

    1. EXECUTIVE SUMMARY
      1. MARKET ATTRACTIVENESS
      2. ANALYSIS
      3. GLOBAL NON-WOVEN ABRASIVES MARKET, BY REGION
      4. NON-WOVEN
    2. ABRASIVES MARKET, BY TARGET SUBSTRATE
      1. NON-WOVEN ABRASIVES MARKET, BY PRODUCT
      2. NON-WOVEN ABRASIVES MARKET, BY APPLICATION
      3. NON-WOVEN ABRASIVES MARKET,
      4. BY END-USE INDUSTRY
    3. MARKET INTRODUCTION
      1. DEFINITION
      2. SCOPE
      3. OF THE STUDY
      4. RESEARCH OBJECTIVE
      5. MARKET STRUCTURE
    4. RESEARCH
      1. METHODOLOGY
      2. VALIDATION
    5. PRICING, TRADE AND MARKET BREAKDOWN APPROACH
      1. DATA
      2. ASSUMPTIONS & LIMITATIONS
    6. MARKET DYNAMICS
      1. 4.1
      2. INTRODUCTION
      3. DRIVERS
        1. INCREASING DEMAND FOR NON-WOVEN ABRASIVES
        2. RISING INDUSTRIALIZATION AND MANUFACTURING
        3. DRIVER IMPACT ANALYSIS
      4. FROM VARIOUS END-USE INDUSTRIES
      5. ACTIVITIES
      6. RESTRAINTS
        1. HIGH
      7. COST OF RAW MATERIALS
      8. OPPORTUNITY
        1. RAPID GROWTH OF AEROSPACE
      9. INDUSTRY IN THE ASIA-PACIFIC REGION
      10. CHALLENGES
        1. TECHNOLOGICAL
      11. ADVANCEMENTS AND PRODUCT DIFFERENTIATION
    7. MARKET FACTOR ANALYSIS
      1. 5.1
    8. SUPPLY CHAIN ANALYSIS
      1. PRODUCERS
      2. 5.2
      3. PORTER’S FIVE FORCES MODEL
      4. 5.2.2
      5. BARGAINING POWER OF BUYERS
      6. SUBSTITUTES
      7. 5.3.1
      8. PRICING DRIVERS
      9. 5.3.4
      10. PRICING OVERVIEW, BY PRODUCT, 2019 TO 2035 (USD/TONS)
      11. BY REGION
      12. 5.6.3
      13. DIGITAL INTEGRATION
      14. 5.8.1
      15. DURABILITY AND LONGEVITY
      16. FINISH QUALITY
      17. MARKET
      18. OF COVID-19 ON DEMAND FROM END-USERS
    9. RAW MATERIAL SCENARIO
    10. NON-WOVEN ABRASIVE
    11. DISTRIBUTION & SALES CHANNEL
    12. END-USERS
    13. BARGAINING POWER OF SUPPLIERS
    14. THREAT OF NEW ENTRANTS
    15. THREAT OF
    16. INTENSITY OF RIVALRY
      1. PRICING OVERVIEW
        1. PRICING OVERVIEW, BY REGION, 2019 TO 2035 (USD/TONS)
        2. PRICING OVERVIEW, BY TARGET SUBSTRATE, 2019 TO 2035 (USD/TONS)
      2. SUPPLY-DEMAND ANALYSIS,
      3. COST STRUCTURE ANALYSIS
        1. COST COMPONENT BREAKDOWN (%)
        2. FACTORS AFFECTING THE COST OF THESE COMPONENTS
      4. TECHNOLOGICAL ADVANCEMENTS
        1. ENHANCED ABRASIVE MATERIALS
        2. PRODUCT DESIGN INNOVATIONS
      5. REGULATORY FRAMEWORK
        1. GOVERNMENT POLICIES
        2. PATENT ANALYSIS
      6. PERFORMANCE CHARACTERISTICS ANALYSIS
        1. FLEXIBILITY AND CONFORMABILITY
        2. SURFACE
      7. IMPACT OF CORONAVIRUS OUTBREAK ON THE GLOBAL NON-WOVEN ABRASIVE
        1. IMPACT OF COVID-19 ON SUPPLY CHAIN ANALYSIS
        2. IMPACT
    17. GLOBAL NON-WOVEN ABRASIVES MARKET, BY
      1. SUBSTRATE
      2. INTRODUCTION
      3. METAL
      4. GLASS
      5. PLASTIC
      6. COMPOSITE
      7. WOOD
      8. OTHERS
    18. GLOBAL NON-WOVEN ABRASIVES
    19. MARKET, BY PRODUCT
      1. INTRODUCTION
      2. HAND PADS
      3. ROLLS
      4. 7.4
      5. DISCS
      6. BELTS
      7. WHEELS
      8. BRUSHES
    20. GLOBAL NON-WOVEN ABRASIVES
    21. MARKET, BY APPLICATION
      1. INTRODUCTION
      2. DEBURRING
      3. FINISHING
      4. CLEANING
      5. POLISHING
      6. OTHERS
    22. GLOBAL NON-WOVEN ABRASIVES
    23. MARKET, BY END-USE INDUSTRY
      1. INTRODUCTION
      2. TRANSPORTATION
      3. 9.3
      4. BUILDING & CONSTRUCTION
      5. ELECTRICAL & ELECTRONICS
      6. INDUSTRIAL
      7. MACHINERY
      8. OTHERS
    24. GLOBAL NON-WOVEN ABRASIVES MARKET, BY REGION
      1. OVERVIEW
      2. NORTH AMERICA
      3. NORTH AMERICA
        1. US
        2. CANADA
        3. MEXICO
      4. EUROPE
        1. GERMANY
        2. FRANCE
        3. SPAIN
        4. ITALY
        5. RUSSIA
        6. REST OF EUROPE
      5. 10.4.2
      6. UK
      7. ASIA-PACIFIC
        1. CHINA
        2. JAPAN
        3. INDIA
        4. SOUTH KOREA
        5. REST OF ASIA PACIFIC
        6. BRAZIL
        7. ARGENTINA
        8. REST OF SOUTH
      8. 10.6
      9. SOUTH AMERICA
      10. AMERICA
      11. MIDDLE EAST & AFRICA
        1. GCC COUNTRIES
        2. REST OF MIDDLE EAST & AFRICA
      12. 10.7.2
      13. SOUTH AFRICA
    25. COMPANY PROFILES
      1. OFFERED
      2. STRATEGIES
      3. \r\n
      4. \r\n
      5. \r\n
    26. COMPANY OVERVIEW
    27. FINANCIAL OVERVIEW
    28. PRODUCTS OFFERED
    29. KEY DEVELOPMENTS
    30. SWOT ANALYSIS
    31. KEY STRATEGIES
    32. COMPANY OVERVIEW
    33. FINANCIAL OVERVIEW
    34. PRODUCTS OFFERED
    35. KEY DEVELOPMENTS
    36. SWOT ANALYSIS
    37. KEY STRATEGIES
    38. COMPANY OVERVIEW
    39. FINANCIAL OVERVIEW
    40. PRODUCTS OFFERED
    41. KEY DEVELOPMENTS
    42. SWOT ANALYSIS
    43. KEY STRATEGIES
    44. COMPANY OVERVIEW
    45. FINANCIAL OVERVIEW
    46. PRODUCTS OFFERED
    47. KEY DEVELOPMENTS
    48. SWOT ANALYSIS
    49. KEY STRATEGIES
    50. COMPANY OVERVIEW
    51. FINANCIAL OVERVIEW
    52. PRODUCTS OFFERED
    53. KEY DEVELOPMENTS
    54. SWOT ANALYSIS
    55. KEY STRATEGIES
    56. COMPANY OVERVIEW
    57. FINANCIAL OVERVIEW
    58. PRODUCTS OFFERED
    59. KEY DEVELOPMENTS
    60. SWOT ANALYSIS
    61. KEY STRATEGIES
    62. COMPANY OVERVIEW
    63. FINANCIAL OVERVIEW
    64. PRODUCTS OFFERED
    65. KEY DEVELOPMENTS
    66. SWOT ANALYSIS
    67. KEY STRATEGIES
    68. COMPANY OVERVIEW
    69. FINANCIAL OVERVIEW
    70. PRODUCTS OFFERED
    71. KEY DEVELOPMENTS
    72. SWOT ANALYSIS
    73. KEY STRATEGIES
    74. COMPANY OVERVIEW
    75. FINANCIAL OVERVIEW
    76. PRODUCTS OFFERED
    77. KEY DEVELOPMENTS
    78. SWOT ANALYSIS
    79. KEY STRATEGIES
    80. COMPANY OVERVIEW
    81. FINANCIAL OVERVIEW
    82. PRODUCTS
    83. KEY DEVELOPMENTS
    84. SWOT ANALYSIS
    85. KEY
      1. DATA CITATIONS
    86. LIST OF TABLES
    87. LIST OF ASSUMPTIONS
    88. PRICING OVERVIEW,
      1. BY REGION, 2019 TO 2035 (USD/TONS)
    89. PRICING OVERVIEW, BY TARGET SUBSTRATE,
    90. PRICING OVERVIEW, BY PRODUCT, 2019 TO 2035
      1. (USD/TONS)
    91. GLOBAL NON-WOVEN ABRASIVES MARKET, BY SUBSTRATE, 2019-2035
      1. (USD MILLION)
    92. GLOBAL NON-WOVEN ABRASIVES MARKET, BY SUBSTRATE, 2019-2035
      1. (KILO TONS)
    93. GLOBAL NON-WOVEN ABRASIVES MARKET, BY PRODUCT, 2019-2035
      1. (USD MILLION)
    94. GLOBAL NON-WOVEN ABRASIVES MARKET, BY PRODUCT, 2019-2035
      1. (KILO TONS)
    95. GLOBAL NON-WOVEN ABRASIVES MARKET, BY APPLICATION, 2019-2035
      1. (USD MILLION)
    96. GLOBAL NON-WOVEN ABRASIVES MARKET, BY APPLICATION, 2019-2035
      1. (KILO TONS)
    97. GLOBAL NON-WOVEN ABRASIVES MARKET, BY END-USE INDUSTRY,
    98. GLOBAL NON-WOVEN ABRASIVES MARKET, BY END-USE
      1. INDUSTRY, 2019-2035 (KILO TONS)
    99. GLOBAL NON-WOVEN ABRASIVES MARKET,
      1. BY REGION, 2019-2035 (USD MILLION)
    100. GLOBAL NON-WOVEN ABRASIVES MARKET,
      1. BY REGION, 2019-2035 (KILO TONS)
    101. NORTH AMERICA: NON-WOVEN ABRASIVES
    102. MARKET, BY COUNTRY, 2019-2035 (USD MILLION)
    103. NORTH AMERICA: NON-WOVEN
    104. ABRASIVES MARKET, BY COUNTRY, 2019-2035 (KILO TONS)
    105. NORTH AMERICA
    106. NON-WOVEN ABRASIVES MARKET, BY SUBSTRATE, 2019-2035 (USD MILLION)
      1. TABLE 18
    107. NORTH AMERICA NON-WOVEN ABRASIVES MARKET, BY SUBSTRATE, 2019-2035 (KILO TONS)
    108. NORTH AMERICA NON-WOVEN ABRASIVES MARKET, BY PRODUCT, 2019-2035 (USD
      1. MILLION)
    109. NORTH AMERICA NON-WOVEN ABRASIVES MARKET, BY PRODUCT, 2019-2035
      1. (KILO TONS)
    110. NORTH AMERICA NON-WOVEN ABRASIVES MARKET, BY APPLICATION,
    111. NORTH AMERICA NON-WOVEN ABRASIVES MARKET,
      1. BY APPLICATION, 2019-2035 (KILO TONS)
    112. NORTH AMERICA: NON-WOVEN ABRASIVES
    113. MARKET, BY END-USE, 2019-2035 (USD MILLION)
    114. NORTH AMERICA: NON-WOVEN
    115. ABRASIVES MARKET, BY END-USE, 2019-2035 (KILO TONS)
    116. US NON-WOVEN ABRASIVES
    117. MARKET, BY SUBSTRATE, 2019-2035 (USD MILLION)
    118. US NON-WOVEN ABRASIVES
    119. MARKET, BY SUBSTRATE, 2019-2035 (KILO TONS)
    120. US NON-WOVEN ABRASIVES
    121. MARKET, BY PRODUCT, 2019-2035 (USD MILLION)
    122. US NON-WOVEN ABRASIVES
    123. MARKET, BY PRODUCT, 2019-2035 (KILO TONS)
    124. US NON-WOVEN ABRASIVES MARKET,
      1. BY APPLICATION, 2019-2035 (USD MILLION)
    125. US NON-WOVEN ABRASIVES MARKET,
      1. BY APPLICATION, 2019-2035 (KILO TONS)
    126. US: NON-WOVEN ABRASIVES MARKET,
      1. BY END-USE, 2019-2035 (USD MILLION)
    127. US: NON-WOVEN ABRASIVES MARKET,
      1. BY END-USE, 2019-2035 (KILO TONS)
    128. CANADA NON-WOVEN ABRASIVES MARKET,
      1. BY SUBSTRATE, 2019-2035 (USD MILLION)
    129. CANADA NON-WOVEN ABRASIVES MARKET,
      1. BY SUBSTRATE, 2019-2035 (KILO TONS)
    130. CANADA NON-WOVEN ABRASIVES MARKET,
      1. BY PRODUCT, 2019-2035 (USD MILLION)
    131. CANADA NON-WOVEN ABRASIVES MARKET,
      1. BY PRODUCT, 2019-2035 (KILO TONS)
    132. CANADA NON-WOVEN ABRASIVES MARKET,
      1. BY APPLICATION, 2019-2035 (USD MILLION)
    133. CANADA NON-WOVEN ABRASIVES
    134. MARKET, BY APPLICATION, 2019-2035 (KILO TONS)
    135. CANADA: NON-WOVEN ABRASIVES
    136. MARKET, BY END-USE, 2019-2035 (USD MILLION)
    137. CANADA: NON-WOVEN ABRASIVES
    138. MARKET, BY END-USE, 2019-2035 (KILO TONS)
    139. MEXICO NON-WOVEN ABRASIVES
    140. MARKET, BY SUBSTRATE, 2019-2035 (USD MILLION)
    141. MEXICO NON-WOVEN ABRASIVES
    142. MARKET, BY SUBSTRATE, 2019-2035 (KILO TONS)
    143. MEXICO NON-WOVEN ABRASIVES
    144. MARKET, BY PRODUCT, 2019-2035 (USD MILLION)
    145. MEXICO NON-WOVEN ABRASIVES
    146. MARKET, BY PRODUCT, 2019-2035 (KILO TONS)
    147. MEXICO NON-WOVEN ABRASIVES
    148. MARKET, BY APPLICATION, 2019-2035 (USD MILLION)
    149. MEXICO NON-WOVEN ABRASIVES
    150. MARKET, BY APPLICATION, 2019-2035 (KILO TONS)
    151. MEXICO: NON-WOVEN ABRASIVES
    152. MARKET, BY END-USE, 2019-2035 (USD MILLION)
    153. MEXICO: NON-WOVEN ABRASIVES
    154. MARKET, BY END-USE, 2019-2035 (KILO TONS)
    155. EUROPE: NON-WOVEN ABRASIVES
    156. MARKET, BY COUNTRY, 2019-2035 (USD MILLION)
    157. EUROPE: NON-WOVEN ABRASIVES
    158. MARKET, BY COUNTRY, 2019-2035 (KILO TONS)
    159. EUROPE NON-WOVEN ABRASIVES
    160. MARKET, BY SUBSTRATE, 2019-2035 (USD MILLION)
    161. EUROPE NON-WOVEN ABRASIVES
    162. MARKET, BY SUBSTRATE, 2019-2035 (KILO TONS)
    163. EUROPE NON-WOVEN ABRASIVES
    164. MARKET, BY PRODUCT, 2019-2035 (USD MILLION)
    165. EUROPE NON-WOVEN ABRASIVES
    166. MARKET, BY PRODUCT, 2019-2035 (KILO TONS)
    167. EUROPE NON-WOVEN ABRASIVES
    168. MARKET, BY APPLICATION, 2019-2035 (USD MILLION)
    169. EUROPE NON-WOVEN ABRASIVES
    170. MARKET, BY APPLICATION, 2019-2035 (KILO TONS)
    171. EUROPE: NON-WOVEN ABRASIVES
    172. MARKET, BY END-USE, 2019-2035 (USD MILLION)
    173. EUROPE: NON-WOVEN ABRASIVES
    174. MARKET, BY END-USE, 2019-2035 (KILO TONS)
    175. GERMANY NON-WOVEN ABRASIVES
    176. MARKET, BY SUBSTRATE, 2019-2035 (USD MILLION)
    177. GERMANY NON-WOVEN ABRASIVES
    178. MARKET, BY SUBSTRATE, 2019-2035 (KILO TONS)
    179. GERMANY NON-WOVEN ABRASIVES
    180. MARKET, BY PRODUCT, 2019-2035 (USD MILLION)
    181. GERMANY NON-WOVEN ABRASIVES
    182. MARKET, BY PRODUCT, 2019-2035 (KILO TONS)
    183. GERMANY NON-WOVEN ABRASIVES
    184. MARKET, BY APPLICATION, 2019-2035 (USD MILLION)
    185. GERMANY NON-WOVEN
    186. ABRASIVES MARKET, BY APPLICATION, 2019-2035 (KILO TONS)
    187. GERMANY: NON-WOVEN
    188. ABRASIVES MARKET, BY END-USE, 2019-2035 (USD MILLION)
    189. GERMANY: NON-WOVEN
    190. ABRASIVES MARKET, BY END-USE, 2019-2035 (KILO TONS)
    191. UK NON-WOVEN ABRASIVES
    192. MARKET, BY SUBSTRATE, 2019-2035 (USD MILLION)
    193. UK NON-WOVEN ABRASIVES
    194. MARKET, BY SUBSTRATE, 2019-2035 (KILO TONS)
    195. UK NON-WOVEN ABRASIVES
    196. MARKET, BY PRODUCT, 2019-2035 (USD MILLION)
    197. UK NON-WOVEN ABRASIVES
    198. MARKET, BY PRODUCT, 2019-2035 (KILO TONS)
    199. UK NON-WOVEN ABRASIVES MARKET,
      1. BY APPLICATION, 2019-2035 (USD MILLION)
    200. UK NON-WOVEN ABRASIVES MARKET,
      1. BY APPLICATION, 2019-2035 (KILO TONS)
    201. UK: NON-WOVEN ABRASIVES MARKET,
      1. BY END-USE, 2019-2035 (USD MILLION)
    202. UK: NON-WOVEN ABRASIVES MARKET,
      1. BY END-USE, 2019-2035 (KILO TONS)
    203. FRANCE NON-WOVEN ABRASIVES MARKET,
      1. BY SUBSTRATE, 2019-2035 (USD MILLION)
    204. FRANCE NON-WOVEN ABRASIVES MARKET,
      1. BY SUBSTRATE, 2019-2035 (KILO TONS)
    205. FRANCE NON-WOVEN ABRASIVES MARKET,
      1. BY PRODUCT, 2019-2035 (USD MILLION)
    206. FRANCE NON-WOVEN ABRASIVES MARKET,
      1. BY PRODUCT, 2019-2035 (KILO TONS)
    207. FRANCE NON-WOVEN ABRASIVES MARKET,
      1. BY APPLICATION, 2019-2035 (USD MILLION)
    208. FRANCE NON-WOVEN ABRASIVES
    209. MARKET, BY APPLICATION, 2019-2035 (KILO TONS)
    210. FRANCE: NON-WOVEN ABRASIVES
    211. MARKET, BY END-USE, 2019-2035 (USD MILLION)
    212. FRANCE: NON-WOVEN ABRASIVES
    213. MARKET, BY END-USE, 2019-2035 (KILO TONS)
    214. SPAIN NON-WOVEN ABRASIVES
    215. MARKET, BY SUBSTRATE, 2019-2035 (USD MILLION)
    216. SPAIN NON-WOVEN ABRASIVES
    217. MARKET, BY SUBSTRATE, 2019-2035 (KILO TONS)
    218. SPAIN NON-WOVEN ABRASIVES
    219. MARKET, BY PRODUCT, 2019-2035 (USD MILLION)
    220. SPAIN NON-WOVEN ABRASIVES
    221. MARKET, BY PRODUCT, 2019-2035 (KILO TONS)
    222. SPAIN NON-WOVEN ABRASIVES
    223. MARKET, BY APPLICATION, 2019-2035 (USD MILLION)
    224. SPAIN NON-WOVEN ABRASIVES
    225. MARKET, BY APPLICATION, 2019-2035 (KILO TONS)
    226. SPAIN: NON-WOVEN ABRASIVES
    227. MARKET, BY END-USE, 2019-2035 (USD MILLION)
    228. SPAIN: NON-WOVEN ABRASIVES
    229. MARKET, BY END-USE, 2019-2035 (KILO TONS)
    230. ITALY NON-WOVEN ABRASIVES
    231. MARKET, BY SUBSTRATE, 2019-2035 (USD MILLION)
    232. ITALY NON-WOVEN ABRASIVES
    233. MARKET, BY SUBSTRATE, 2019-2035 (KILO TONS)
    234. ITALY NON-WOVEN ABRASIVES
    235. MARKET, BY PRODUCT, 2019-2035 (USD MILLION)
    236. ITALY NON-WOVEN ABRASIVES
    237. MARKET, BY PRODUCT, 2019-2035 (KILO TONS)
    238. ITALY NON-WOVEN ABRASIVES
    239. MARKET, BY APPLICATION, 2019-2035 (USD MILLION)
    240. ITALY NON-WOVEN ABRASIVES
    241. MARKET, BY APPLICATION, 2019-2035 (KILO TONS)
    242. ITALY: NON-WOVEN ABRASIVES
    243. MARKET, BY END-USE, 2019-2035 (USD MILLION)
    244. ITALY: NON-WOVEN ABRASIVES
    245. MARKET, BY END-USE, 2019-2035 (KILO TONS)
    246. RUSSIA NON-WOVEN ABRASIVES
    247. MARKET, BY SUBSTRATE, 2019-2035 (USD MILLION)
    248. RUSSIA NON-WOVEN ABRASIVES
    249. MARKET, BY SUBSTRATE, 2019-2035 (KILO TONS)
    250. RUSSIA NON-WOVEN ABRASIVES
    251. MARKET, BY PRODUCT, 2019-2035 (USD MILLION)
    252. RUSSIA NON-WOVEN ABRASIVES
    253. MARKET, BY PRODUCT, 2019-2035 (KILO TONS)
    254. RUSSIA NON-WOVEN ABRASIVES
    255. MARKET, BY APPLICATION, 2019-2035 (USD MILLION)
    256. RUSSIA NON-WOVEN
    257. ABRASIVES MARKET, BY APPLICATION, 2019-2035 (KILO TONS)
    258. RUSSIA: NON-WOVEN
    259. ABRASIVES MARKET, BY END-USE, 2019-2035 (USD MILLION)
    260. RUSSIA: NON-WOVEN
    261. ABRASIVES MARKET, BY END-USE, 2019-2035 (KILO TONS)
    262. REST OF EUROPE
    263. NON-WOVEN ABRASIVES MARKET, BY SUBSTRATE, 2019-2035 (USD MILLION)
      1. TABLE 108
    264. REST OF EUROPE NON-WOVEN ABRASIVES MARKET, BY SUBSTRATE, 2019-2035 (KILO TONS)
    265. REST OF EUROPE NON-WOVEN ABRASIVES MARKET, BY PRODUCT, 2019-2035 (USD
      1. MILLION)
    266. REST OF EUROPE NON-WOVEN ABRASIVES MARKET, BY PRODUCT, 2019-2035
      1. (KILO TONS)
    267. REST OF EUROPE NON-WOVEN ABRASIVES MARKET, BY APPLICATION,
    268. REST OF EUROPE NON-WOVEN ABRASIVES MARKET,
      1. BY APPLICATION, 2019-2035 (KILO TONS)
    269. REST OF EUROPE: NON-WOVEN ABRASIVES
    270. MARKET, BY END-USE, 2019-2035 (USD MILLION)
    271. REST OF EUROPE: NON-WOVEN
    272. ABRASIVES MARKET, BY END-USE, 2019-2035 (KILO TONS)
    273. ASIA PACIFIC:
    274. NON-WOVEN ABRASIVES MARKET, BY COUNTRY, 2019-2035 (USD MILLION)
    275. ASIA
    276. PACIFIC: NON-WOVEN ABRASIVES MARKET, BY COUNTRY, 2019-2035 (TONS)
      1. TABLE 117
    277. ASIA PACIFIC NON-WOVEN ABRASIVES MARKET, BY SUBSTRATE, 2019-2035 (USD MILLION)
    278. ASIA PACIFIC NON-WOVEN ABRASIVES MARKET, BY SUBSTRATE, 2019-2035 (TONS)
    279. ASIA PACIFIC NON-WOVEN ABRASIVES MARKET, BY PRODUCT, 2019-2035 (USD
      1. MILLION)
    280. ASIA PACIFIC NON-WOVEN ABRASIVES MARKET, BY PRODUCT, 2019-2035
      1. (TONS)
    281. ASIA PACIFIC NON-WOVEN ABRASIVES MARKET, BY APPLICATION, 2019-2035
      1. (USD MILLION)
    282. ASIA PACIFIC NON-WOVEN ABRASIVES MARKET, BY APPLICATION,
    283. ASIA PACIFIC: NON-WOVEN ABRASIVES MARKET, BY END-USE,
    284. ASIA PACIFIC: NON-WOVEN ABRASIVES MARKET,
      1. BY END-USE, 2019-2035 (TONS)
    285. CHINA NON-WOVEN ABRASIVES MARKET, BY
      1. SUBSTRATE, 2019-2035 (USD MILLION)
    286. CHINA NON-WOVEN ABRASIVES MARKET,
      1. BY SUBSTRATE, 2019-2035 (TONS)
    287. CHINA NON-WOVEN ABRASIVES MARKET,
      1. BY PRODUCT, 2019-2035 (USD MILLION)
    288. CHINA NON-WOVEN ABRASIVES MARKET,
      1. BY PRODUCT, 2019-2035 (TONS)
    289. CHINA NON-WOVEN ABRASIVES MARKET, BY
      1. APPLICATION, 2019-2035 (USD MILLION)
    290. CHINA NON-WOVEN ABRASIVES MARKET,
      1. BY APPLICATION, 2019-2035 (TONS)
    291. CHINA: NON-WOVEN ABRASIVES MARKET,
      1. BY END-USE, 2019-2035 (USD MILLION)
    292. CHINA: NON-WOVEN ABRASIVES MARKET,
      1. BY END-USE, 2019-2035 (TONS)
    293. JAPAN NON-WOVEN ABRASIVES MARKET, BY
      1. SUBSTRATE, 2019-2035 (USD MILLION)
    294. JAPAN NON-WOVEN ABRASIVES MARKET,
      1. BY SUBSTRATE, 2019-2035 (TONS)
    295. JAPAN NON-WOVEN ABRASIVES MARKET,
      1. BY PRODUCT, 2019-2035 (USD MILLION)
    296. JAPAN NON-WOVEN ABRASIVES MARKET,
      1. BY PRODUCT, 2019-2035 (TONS)
    297. JAPAN NON-WOVEN ABRASIVES MARKET, BY
      1. APPLICATION, 2019-2035 (USD MILLION)
    298. JAPAN NON-WOVEN ABRASIVES MARKET,
      1. BY APPLICATION, 2019-2035 (TONS)
    299. JAPAN: NON-WOVEN ABRASIVES MARKET,
      1. BY END-USE, 2019-2035 (USD MILLION)
    300. JAPAN: NON-WOVEN ABRASIVES MARKET,
      1. BY END-USE, 2019-2035 (TONS)
    301. INDIA NON-WOVEN ABRASIVES MARKET, BY
      1. SUBSTRATE, 2019-2035 (USD MILLION)
    302. INDIA NON-WOVEN ABRASIVES MARKET,
      1. BY SUBSTRATE, 2019-2035 (TONS)
    303. INDIA NON-WOVEN ABRASIVES MARKET,
      1. BY PRODUCT, 2019-2035 (USD MILLION)
    304. INDIA NON-WOVEN ABRASIVES MARKET,
      1. BY PRODUCT, 2019-2035 (TONS)
    305. INDIA NON-WOVEN ABRASIVES MARKET, BY
      1. APPLICATION, 2019-2035 (USD MILLION)
    306. INDIA NON-WOVEN ABRASIVES MARKET,
      1. BY APPLICATION, 2019-2035 (TONS)
    307. INDIA: NON-WOVEN ABRASIVES MARKET,
      1. BY END-USE, 2019-2035 (USD MILLION)
    308. INDIA: NON-WOVEN ABRASIVES MARKET,
      1. BY END-USE, 2019-2035 (TONS)
    309. SOUTH KOREA NON-WOVEN ABRASIVES MARKET,
      1. BY SUBSTRATE, 2019-2035 (USD MILLION)
    310. SOUTH KOREA NON-WOVEN ABRASIVES
    311. MARKET, BY SUBSTRATE, 2019-2035 (TONS)
    312. SOUTH KOREA NON-WOVEN ABRASIVES
    313. MARKET, BY PRODUCT, 2019-2035 (USD MILLION)
    314. SOUTH KOREA NON-WOVEN
    315. ABRASIVES MARKET, BY PRODUCT, 2019-2035 (TONS)
    316. SOUTH KOREA NON-WOVEN
    317. ABRASIVES MARKET, BY APPLICATION, 2019-2035 (USD MILLION)
    318. SOUTH KOREA
    319. NON-WOVEN ABRASIVES MARKET, BY APPLICATION, 2019-2035 (TONS)
    320. SOUTH
    321. KOREA: NON-WOVEN ABRASIVES MARKET, BY END-USE, 2019-2035 (USD MILLION)
      1. TABLE
    322. SOUTH KOREA: NON-WOVEN ABRASIVES MARKET, BY END-USE, 2019-2035 (TONS)
      1. TABLE
    323. REST OF ASIA PACIFIC NON-WOVEN ABRASIVES MARKET, BY SUBSTRATE, 2019-2035 (USD
      1. MILLION)
    324. REST OF ASIA PACIFIC NON-WOVEN ABRASIVES MARKET, BY SUBSTRATE,
    325. REST OF ASIA PACIFIC NON-WOVEN ABRASIVES MARKET,
      1. BY PRODUCT, 2019-2035 (USD MILLION)
    326. REST OF ASIA PACIFIC NON-WOVEN
    327. ABRASIVES MARKET, BY PRODUCT, 2019-2035 (TONS)
    328. REST OF ASIA PACIFIC
    329. NON-WOVEN ABRASIVES MARKET, BY APPLICATION, 2019-2035 (USD MILLION)
      1. TABLE 162
    330. REST OF ASIA PACIFIC NON-WOVEN ABRASIVES MARKET, BY APPLICATION, 2019-2035 (TONS)
    331. REST OF ASIA PACIFIC: NON-WOVEN ABRASIVES MARKET, BY END-USE, 2019-2035
      1. (USD MILLION)
    332. REST OF ASIA PACIFIC: NON-WOVEN ABRASIVES MARKET, BY
      1. END-USE, 2019-2035 (TONS)
    333. SOUTH AMERICA: NON-WOVEN ABRASIVES MARKET,
      1. BY COUNTRY, 2019-2035 (USD MILLION)
    334. SOUTH AMERICA: NON-WOVEN ABRASIVES
    335. MARKET, BY COUNTRY, 2019-2035 (TONS)
    336. SOUTH AMERICA NON-WOVEN ABRASIVES
    337. MARKET, BY SUBSTRATE, 2019-2035 (USD MILLION)
    338. SOUTH AMERICA NON-WOVEN
    339. ABRASIVES MARKET, BY SUBSTRATE, 2019-2035 (TONS)
    340. SOUTH AMERICA NON-WOVEN
    341. ABRASIVES MARKET, BY PRODUCT, 2019-2035 (USD MILLION)
    342. SOUTH AMERICA
    343. NON-WOVEN ABRASIVES MARKET, BY PRODUCT, 2019-2035 (TONS)
    344. SOUTH AMERICA
    345. NON-WOVEN ABRASIVES MARKET, BY APPLICATION, 2019-2035 (USD MILLION)
      1. TABLE 172
    346. SOUTH AMERICA NON-WOVEN ABRASIVES MARKET, BY APPLICATION, 2019-2035 (TONS)
      1. TABLE
    347. SOUTH AMERICA: NON-WOVEN ABRASIVES MARKET, BY END-USE, 2019-2035 (USD MILLION)
    348. SOUTH AMERICA: NON-WOVEN ABRASIVES MARKET, BY END-USE, 2019-2035 (TONS)
    349. BRAZIL NON-WOVEN ABRASIVES MARKET, BY SUBSTRATE, 2019-2035 (USD MILLION)
    350. BRAZIL NON-WOVEN ABRASIVES MARKET, BY SUBSTRATE, 2019-2035 (TONS)
    351. BRAZIL NON-WOVEN ABRASIVES MARKET, BY PRODUCT, 2019-2035 (USD MILLION)
    352. BRAZIL NON-WOVEN ABRASIVES MARKET, BY PRODUCT, 2019-2035 (TONS)
      1. TABLE
    353. BRAZIL NON-WOVEN ABRASIVES MARKET, BY APPLICATION, 2019-2035 (USD MILLION)
    354. BRAZIL NON-WOVEN ABRASIVES MARKET, BY APPLICATION, 2019-2035 (TONS)
    355. BRAZIL: NON-WOVEN ABRASIVES MARKET, BY END-USE, 2019-2035 (USD MILLION)
    356. BRAZIL: NON-WOVEN ABRASIVES MARKET, BY END-USE, 2019-2035 (TONS)
    357. ARGENTINA NON-WOVEN ABRASIVES MARKET, BY SUBSTRATE, 2019-2035 (USD MILLION)
    358. ARGENTINA NON-WOVEN ABRASIVES MARKET, BY SUBSTRATE, 2019-2035 (TONS)
    359. ARGENTINA NON-WOVEN ABRASIVES MARKET, BY PRODUCT, 2019-2035 (USD MILLION)
    360. ARGENTINA NON-WOVEN ABRASIVES MARKET, BY PRODUCT, 2019-2035 (TONS)
    361. ARGENTINA NON-WOVEN ABRASIVES MARKET, BY APPLICATION, 2019-2035 (USD
      1. MILLION)
    362. ARGENTINA NON-WOVEN ABRASIVES MARKET, BY APPLICATION, 2019-2035
      1. (TONS)
    363. ARGENTINA: NON-WOVEN ABRASIVES MARKET, BY END-USE, 2019-2035
      1. (USD MILLION)
    364. ARGENTINA: NON-WOVEN ABRASIVES MARKET, BY END-USE,
    365. REST OF SOUTH AMERICA NON-WOVEN ABRASIVES MARKET,
      1. BY SUBSTRATE, 2019-2035 (USD MILLION)
    366. REST OF SOUTH AMERICA NON-WOVEN
    367. ABRASIVES MARKET, BY SUBSTRATE, 2019-2035 (TONS)
    368. REST OF SOUTH AMERICA
    369. NON-WOVEN ABRASIVES MARKET, BY PRODUCT, 2019-2035 (USD MILLION)
    370. REST
    371. OF SOUTH AMERICA NON-WOVEN ABRASIVES MARKET, BY PRODUCT, 2019-2035 (TONS)
      1. TABLE
    372. REST OF SOUTH AMERICA NON-WOVEN ABRASIVES MARKET, BY APPLICATION, 2019-2035
      1. (USD MILLION)
    373. REST OF SOUTH AMERICA NON-WOVEN ABRASIVES MARKET, BY
      1. APPLICATION, 2019-2035 (TONS)
    374. REST OF SOUTH AMERICA: NON-WOVEN ABRASIVES
    375. MARKET, BY END-USE, 2019-2035 (USD MILLION)
    376. REST OF SOUTH AMERICA:
    377. NON-WOVEN ABRASIVES MARKET, BY END-USE, 2019-2035 (TONS)
    378. MIDDLE EAST
    379. & AFRICA: NON-WOVEN ABRASIVES MARKET, BY COUNTRY, 2019-2035 (USD MILLION)
    380. MIDDLE EAST & AFRICA: NON-WOVEN ABRASIVES MARKET, BY COUNTRY, 2019-2035
      1. (KILO TONS)
    381. MIDDLE EAST & AFRICA NON-WOVEN ABRASIVES MARKET,
      1. BY SUBSTRATE, 2019-2035 (USD MILLION)
    382. MIDDLE EAST & AFRICA NON-WOVEN
    383. ABRASIVES MARKET, BY SUBSTRATE, 2019-2035 (KILO TONS)
    384. MIDDLE EAST
    385. & AFRICA NON-WOVEN ABRASIVES MARKET, BY PRODUCT, 2019-2035 (USD MILLION)
    386. MIDDLE EAST & AFRICA NON-WOVEN ABRASIVES MARKET, BY PRODUCT, 2019-2035
      1. (KILO TONS)
    387. MIDDLE EAST & AFRICA NON-WOVEN ABRASIVES MARKET,
      1. BY APPLICATION, 2019-2035 (USD MILLION)
    388. MIDDLE EAST & AFRICA
    389. NON-WOVEN ABRASIVES MARKET, BY APPLICATION, 2019-2035 (KILO TONS)
      1. TABLE 207
    390. MIDDLE EAST & AFRICA: NON-WOVEN ABRASIVES MARKET, BY END-USE, 2019-2035 (USD
      1. MILLION)
    391. MIDDLE EAST & AFRICA: NON-WOVEN ABRASIVES MARKET, BY
      1. END-USE, 2019-2035 (KILO TONS)
    392. GCC COUNTRIES NON-WOVEN ABRASIVES
    393. MARKET, BY SUBSTRATE, 2019-2035 (USD MILLION)
    394. GCC COUNTRIES NON-WOVEN
    395. ABRASIVES MARKET, BY SUBSTRATE, 2019-2035 (KILO TONS)
    396. GCC COUNTRIES
    397. NON-WOVEN ABRASIVES MARKET, BY PRODUCT, 2019-2035 (USD MILLION)
    398. GCC
    399. COUNTRIES NON-WOVEN ABRASIVES MARKET, BY PRODUCT, 2019-2035 (KILO TONS)
      1. TABLE
    400. GCC COUNTRIES NON-WOVEN ABRASIVES MARKET, BY APPLICATION, 2019-2035 (USD MILLION)
    401. GCC COUNTRIES NON-WOVEN ABRASIVES MARKET, BY APPLICATION, 2019-2035
      1. (KILO TONS)
    402. GCC COUNTRIES: NON-WOVEN ABRASIVES MARKET, BY END-USE,
    403. GCC COUNTRIES: NON-WOVEN ABRASIVES MARKET,
      1. BY END-USE, 2019-2035 (KILO TONS)
    404. SOUTH AFRICA NON-WOVEN ABRASIVES
    405. MARKET, BY SUBSTRATE, 2019-2035 (USD MILLION)
    406. SOUTH AFRICA NON-WOVEN
    407. ABRASIVES MARKET, BY SUBSTRATE, 2019-2035 (KILO TONS)
    408. SOUTH AFRICA
    409. NON-WOVEN ABRASIVES MARKET, BY PRODUCT, 2019-2035 (USD MILLION)
    410. SOUTH
    411. AFRICA NON-WOVEN ABRASIVES MARKET, BY PRODUCT, 2019-2035 (KILO TONS)
      1. TABLE
    412. SOUTH AFRICA NON-WOVEN ABRASIVES MARKET, BY APPLICATION, 2019-2035 (USD MILLION)
    413. SOUTH AFRICA NON-WOVEN ABRASIVES MARKET, BY APPLICATION, 2019-2035 (KILO
      1. TONS)
    414. SOUTH AFRICA: NON-WOVEN ABRASIVES MARKET, BY END-USE, 2019-2035
      1. (USD MILLION)
    415. SOUTH AFRICA: NON-WOVEN ABRASIVES MARKET, BY END-USE,
    416. REST OF MIDDLE EAST & AFRICA NON-WOVEN
    417. ABRASIVES MARKET, BY SUBSTRATE, 2019-2035 (USD MILLION)
    418. REST OF MIDDLE
    419. EAST & AFRICA NON-WOVEN ABRASIVES MARKET, BY SUBSTRATE, 2019-2035 (KILO TONS)
    420. REST OF MIDDLE EAST & AFRICA NON-WOVEN ABRASIVES MARKET, BY PRODUCT,
    421. REST OF MIDDLE EAST & AFRICA NON-WOVEN
    422. ABRASIVES MARKET, BY PRODUCT, 2019-2035 (KILO TONS)
    423. REST OF MIDDLE
    424. EAST & AFRICA NON-WOVEN ABRASIVES MARKET, BY APPLICATION, 2019-2035 (USD MILLION)
    425. REST OF MIDDLE EAST & AFRICA NON-WOVEN ABRASIVES MARKET, BY APPLICATION,
    426. REST OF MIDDLE EAST & AFRICA: NON-WOVEN
    427. ABRASIVES MARKET, BY END-USE, 2019-2035 (USD MILLION)
    428. REST OF MIDDLE
    429. EAST & AFRICA: NON-WOVEN ABRASIVES MARKET, BY END-USE, A (KILO TONS)
      1. TABLE
    430. DYNABRADE INC.: PRODUCTS OFFERED
    431. DYNABRADE INC.: KEY DEVELOPMENTS
    432. STEEL SHINE (UPPAL INDIA): PRODUCTS OFFERED
    433. STEEL SHINE
      1. (UPPAL INDIA): KEY DEVELOPMENTS
    434. MIRKA LTD: PRODUCTS OFFERED
      1. TABLE
    435. MIRKA LTD: KEY DEVELOPMENTS
    436. OSBORN GMBH: PRODUCTS OFFERED
    437. OSBORN GMBH: KEY DEVELOPMENTS
    438. HERMES SCHLEIFMITTEL GMBH:
      1. PRODUCTS OFFERED
    439. HERMES SCHLEIFMITTEL GMBH: KEY DEVELOPMENTS
      1. TABLE
    440. DEWALT: PRODUCTS OFFERED
    441. DEWALT: KEY DEVELOPMENTS
      1. TABLE
    442. SIA ABRASIVES INDUSTRIES AG: PRODUCTS OFFERED
    443. SIA ABRASIVES INDUSTRIES
      1. AG: KEY DEVELOPMENTS
    444. CARBORUNDUM UNIVERSAL LIMITED (CUMI): PRODUCTS
      1. OFFERED
    445. CARBORUNDUM UNIVERSAL LIMITED (CUMI): KEY DEVELOPMENTS
    446. SAINT-GOBAIN: PRODUCTS OFFERED
    447. SAINT-GOBAIN: KEY DEVELOPMENTS
    448. 3M COMPANY: PRODUCTS OFFERED
    449. 3M COMPANY: KEY DEVELOPMENTS
      1. \r\n
      2. \r\n
      3. \r\n
      4. \r\n
    450. LIST OF FIGURES
    451. MARKET SYNOPSIS
    452. MARKET ATTRACTIVENESS
      1. ANALYSIS: GLOBAL NON-WOVEN ABRASIVES MARKET, 2024
    453. GLOBAL NON-WOVEN
      1. ABRASIVES MARKET ANALYSIS BY REGION (USD MILLION)
    454. NON-WOVEN ABRASIVES
      1. MARKET ANALYSIS BY TARGET SUBSTRATE (USD MILLION)
    455. NON-WOVEN ABRASIVES
      1. MARKET ANALYSIS BY PRODUCT (USD MILLION)
    456. NON-WOVEN ABRASIVES MARKET
      1. ANALYSIS BY APPLICATION
    457. NON-WOVEN ABRASIVES MARKET ANALYSIS BY END-USE
      1. INDUSTRY (USD MILLION)
    458. GLOBAL NON-WOVEN ABRASIVE MARKET: STRUCTURE
    459. BOTTOM-UP AND TOP-DOWN APPROACHES
    460. MARKET DYNAMIC ANALYSIS
    461. OF THE GLOBAL NON-WOVEN ABRASIVE MARKET
    462. WORLD MOTOR VEHICLE PRODUCTION
      1. BY REGION (NUMBER OF UNITS)
    463. GLOBAL COMMERCIAL AIRCRAFT FLEET FORECAST
      1. BY REGION (THOUSANDS)
    464. CHINA’S AUTOMOTIVE INDUSTRY FROM 2019
      1. TO 2035
    465. RESTRAINT IMPACT ANALYSIS
    466. SUPPLY CHAIN: GLOBAL
    467. NON-WOVEN ABRASIVE MARKET
    468. PORTER’S FIVE FORCES MODEL: GLOBAL
    469. NON-WOVEN ABRASIVE MARKET
    470. GLOBAL NON-WOVEN ABRASIVES MARKET, BY SUBSTRATE,
    471. GLOBAL NON-WOVEN ABRASIVES MARKET, BY PRODUCT, 2023
      1. (% SHARE)
    472. GLOBAL NON-WOVEN ABRASIVES MARKET, BY APPLICATION, 2023
      1. (% SHARE)
    473. GLOBAL NON-WOVEN ABRASIVES MARKET, BY END-USE INDUSTRY,
    474. GLOBAL NON-WOVEN ABRASIVES MARKET, BY REGION, 2023
      1. (% SHARE)
    475. GLOBAL NON-WOVEN ABRASIVE MAJOR PLAYERS MARKET SHARE ANALYSIS,
    476. DYNABRADE INC.: FINANCIAL OVERVIEW SNAPSHOT
      1. FIGURE
    477. DYNABRADE INC.: SWOT ANALYSIS
    478. STEEL SHINE (UPPAL INDIA): FINANCIAL
      1. OVERVIEW SNAPSHOT
    479. STEEL SHINE (UPPAL INDIA): SWOT ANALYSIS
      1. FIGURE
    480. MIRKA LTD: FINANCIAL OVERVIEW SNAPSHOT
    481. MIRKA LTD: SWOT ANALYSIS
    482. OSBORN GMBH: FINANCIAL OVERVIEW SNAPSHOT
    483. OSBORN GMBH:
    484. SWOT ANALYSIS
    485. HERMES SCHLEIFMITTEL GMBH: FINANCIAL OVERVIEW SNAPSHOT
    486. HERMES SCHLEIFMITTEL GMBH: SWOT ANALYSIS
    487. DEWALT: FINANCIAL
      1. OVERVIEW SNAPSHOT
    488. DEWALT: SWOT ANALYSIS
    489. SIA ABRASIVES
      1. INDUSTRIES AG: FINANCIAL OVERVIEW SNAPSHOT
    490. SIA ABRASIVES INDUSTRIES
      1. AG: SWOT ANALYSIS
    491. CARBORUNDUM UNIVERSAL LIMITED (CUMI): FINANCIAL
      1. OVERVIEW SNAPSHOT
    492. CARBORUNDUM UNIVERSAL LIMITED (CUMI): SWOT ANALYSIS
    493. SAINT-GOBAIN: FINANCIAL OVERVIEW SNAPSHOT
    494. SAINT-GOBAIN:
    495. SWOT ANALYSIS
    496. 3M COMPANY: FINANCIAL OVERVIEW SNAPSHOT
      1. FIGURE
    497. 3M COMPANY: SWOT ANALYSIS
      1. \r\n

    Global Outlook (Kilo Tons,USD Million,2019-2035)

    Global Non-Woven Abrasives, By Substrate (Kilo Tons,USD Million,2019-2035)

    • Metal
    • Glass
    • Plastic
    • Composite
    • Wood
    • Others

    Global Non-Woven Abrasives, By Product (Kilo Tons,USD Million,2019-2035)

    • Hand Pads
    • Rolls
    • Discs
    • Belts
    • Wheels
    • Brushes

    Global Non-Woven Abrasives, By Application (Kilo Tons,USD Million,2019-2035)

    • Deburring
    • Finishing
    • Cleaning
    • Polishing
    • Others

    Global Non-Woven Abrasives, By End-Use Industry (Kilo Tons,USD Million,2019-2035)

    • Transportation
    • Building & Construction
    • Electrical & Electronics
    • Industrial Machinery
    • Others

    North America Outlook (Kilo Tons,USD Million,2019-2035)

    North America Non-Woven Abrasives, By Substrate (Kilo Tons,USD Million,2019-2035)

    • Metal
    • Glass
    • Plastic
    • Composite
    • Wood
    • Others

    North America Non-Woven Abrasives, By Product (Kilo Tons,USD Million,2019-2035)

    • Hand Pads
    • Rolls
    • Discs
    • Belts
    • Wheels
    • Brushes

    North America Non-Woven Abrasives, By Application (Kilo Tons,USD Million,2019-2035)

    • Deburring
    • Finishing
    • Cleaning
    • Polishing
    • Others

    North America Non-Woven Abrasives, By End-Use Industry (Kilo Tons,USD Million,2019-2035)

    • Transportation
    • Building & Construction
    • Electrical & Electronics
    • Industrial Machinery
    • Others

    US Outlook (Kilo Tons,USD Million,2019-2035)

    US Non-Woven Abrasives, By Substrate (Kilo Tons,USD Million,2019-2035)

    • Metal
    • Glass
    • Plastic
    • Composite
    • Wood
    • Others


    US Non-Woven Abrasives, By Product (Kilo Tons,USD Million,2019-2035)

    • Hand Pads
    • Rolls
    • Discs
    • Belts
    • Wheels
    • Brushes

    US Non-Woven Abrasives, By Application (Kilo Tons,USD Million,2019-2035)

    • Deburring
    • Finishing
    • Cleaning
    • Polishing
    • Others

    US Non-Woven Abrasives, By End-Use Industry (Kilo Tons,USD Million,2019-2035)

    • Transportation
    • Building & Construction
    • Electrical & Electronics
    • Industrial Machinery
    • Others

    Canada Outlook (Kilo Tons,USD Million,2019-2035)

    Canada Non-Woven Abrasives, By Substrate (Kilo Tons,USD Million,2019-2035)

    • Metal
    • Glass
    • Plastic
    • Composite
    • Wood
    • Others

    Canada Non-Woven Abrasives, By Product (Kilo Tons,USD Million,2019-2035)

    • Hand Pads
    • Rolls
    • Discs
    • Belts
    • Wheels
    • Brushes


    Canada Non-Woven Abrasives, By Application (Kilo Tons,USD Million,2019-2035)

    • Deburring
    • Finishing
    • Cleaning
    • Polishing
    • Others

    Canada Non-Woven Abrasives, By End-Use Industry (Kilo Tons,USD Million,2019-2035)

    • Transportation
    • Building & Construction
    • Electrical & Electronics
    • Industrial Machinery
    • Others

    Mexico Outlook (Kilo Tons,USD Million,2019-2035)

    Mexico Non-Woven Abrasives, By Substrate (Kilo Tons,USD Million,2019-2035)

    • Metal
    • Glass
    • Plastic
    • Composite
    • Wood
    • Others

    Mexico Non-Woven Abrasives, By Product (Kilo Tons,USD Million,2019-2035)

    • Hand Pads
    • Rolls
    • Discs
    • Belts
    • Wheels
    • Brushes

    Mexico Non-Woven Abrasives, By Application (Kilo Tons,USD Million,2019-2035)

    • Deburring
    • Finishing
    • Cleaning
    • Polishing
    • Others

    Mexico Non-Woven Abrasives, By End-Use Industry (Kilo Tons,USD Million,2019-2035)

    • Transportation
    • Building & Construction
    • Electrical & Electronics
    • Industrial Machinery
    • Others

    Europe Outlook (Kilo Tons,USD Million,2019-2035)

    Europe Non-Woven Abrasives, By Substrate (Kilo Tons,USD Million,2019-2035)

    • Metal
    • Glass
    • Plastic
    • Composite
    • Wood
    • Others

    Europe Non-Woven Abrasives, By Product (Kilo Tons,USD Million,2019-2035)

    • Hand Pads
    • Rolls
    • Discs
    • Belts
    • Wheels
    • Brushes

    Europe Non-Woven Abrasives, By Application (Kilo Tons,USD Million,2019-2035)

    Deburring

    Finishing

    Cleaning

    Polishing

    Others

    Europe Non-Woven Abrasives, By End-Use Industry (Kilo Tons,USD Million,2019-2035)

    • Transportation
    • Building & Construction
    • Electrical & Electronics
    • Industrial Machinery
    • Others

    Germany Outlook (Kilo Tons,USD Million,2019-2035)

    Germany Non-Woven Abrasives, By Substrate (Kilo Tons,USD Million,2019-2035)

    • Metal
    • Glass
    • Plastic
    • Composite
    • Wood
    • Others

    Germany Non-Woven Abrasives, By Product (Kilo Tons,USD Million,2019-2035)

    • Hand Pads
    • Rolls
    • Discs
    • Belts
    • Wheels
    • Brushes

    Germany Non-Woven Abrasives, By Application (Kilo Tons,USD Million,2019-2035)

    • Deburring
    • Finishing
    • Cleaning
    • Polishing
    • Others

    Germany Non-Woven Abrasives, By End-Use Industry (Kilo Tons,USD Million,2019-2035)

    • Transportation
    • Building & Construction
    • Electrical & Electronics
    • Industrial Machinery
    • Others

    UK Outlook (Kilo Tons,USD Million,2019-2035)

    UK Non-Woven Abrasives, By Substrate (Kilo Tons,USD Million,2019-2035)

    • Metal
    • Glass
    • Plastic
    • Composite
    • Wood
    • Others

    UK Non-Woven Abrasives, By Product (Kilo Tons,USD Million,2019-2035)

    • Hand Pads
    • Rolls
    • Discs
    • Belts
    • Wheels
    • Brushes

    UK Non-Woven Abrasives, By Application (Kilo Tons,USD Million,2019-2035)

    • Deburring
    • Finishing
    • Cleaning
    • Polishing
    • Others

    UK Non-Woven Abrasives, By End-Use Industry (Kilo Tons,USD Million,2019-2035)

    • Transportation
    • Building & Construction
    • Electrical & Electronics
    • Industrial Machinery
    • Others

    France Outlook (Kilo Tons,USD Million,2019-2035)

    France Non-Woven Abrasives, By Substrate (Kilo Tons,USD Million,2019-2035)

    • Metal
    • Glass
    • Plastic
    • Composite
    • Wood
    • Others


    France Non-Woven Abrasives, By Product (Kilo Tons,USD Million,2019-2035)

    • Hand Pads
    • Rolls
    • Discs
    • Belts
    • Wheels
    • Brushes

    France Non-Woven Abrasives, By Application (Kilo Tons,USD Million,2019-2035)

    • Deburring
    • Finishing
    • Cleaning
    • Polishing
    • Others

    France Non-Woven Abrasives, By End-Use Industry (Kilo Tons,USD Million,2019-2035)

    • Transportation
    • Building & Construction
    • Electrical & Electronics
    • Industrial Machinery
    • Others

    Spain Outlook (Kilo Tons,USD Million,2019-2035)

    Spain Non-Woven Abrasives, By Substrate (Kilo Tons,USD Million,2019-2035)

    • Metal
    • Glass
    • Plastic
    • Composite
    • Wood
    • Others

    Spain Non-Woven Abrasives, By Product (Kilo Tons,USD Million,2019-2035)

    • Hand Pads
    • Rolls
    • Discs
    • Belts
    • Wheels
    • Brushes

    Spain Non-Woven Abrasives, By Application (Kilo Tons,USD Million,2019-2035)

    • Deburring
    • Finishing
    • Cleaning
    • Polishing
    • Others

    Spain Non-Woven Abrasives, By End-Use Industry (Kilo Tons,USD Million,2019-2035)

    • Transportation
    • Building & Construction
    • Electrical & Electronics
    • Industrial Machinery
    • Others

    Italy Outlook (Kilo Tons,USD Million,2019-2035)

    Italy Non-Woven Abrasives, By Substrate (Kilo Tons,USD Million,2019-2035)

    • Metal
    • Glass
    • Plastic
    • Composite
    • Wood
    • Others

    Italy Non-Woven Abrasives, By Product (Kilo Tons,USD Million,2019-2035)

    • Hand Pads
    • Rolls
    • Discs
    • Belts
    • Wheels
    • Brushes

    Italy Non-Woven Abrasives, By Application (Kilo Tons,USD Million,2019-2035)

    • Deburring
    • Finishing
    • Cleaning
    • Polishing
    • Others


    Italy Non-Woven Abrasives, By End-Use Industry (Kilo Tons,USD Million,2019-2035)

    • Transportation
    • Building & Construction
    • Electrical & Electronics
    • Industrial Machinery
    • Others

    Russia Outlook (Kilo Tons,USD Million,2019-2035)

    Russia Non-Woven Abrasives, By Substrate (Kilo Tons,USD Million,2019-2035)

    • Metal
    • Glass
    • Plastic
    • Composite
    • Wood
    • Others

    Russia Non-Woven Abrasives, By Product (Kilo Tons,USD Million,2019-2035)

    • Hand Pads
    • Rolls
    • Discs
    • Belts
    • Wheels
    • Brushes

    Russia Non-Woven Abrasives, By Application (Kilo Tons,USD Million,2019-2035)

    • Deburring
    • Finishing
    • Cleaning
    • Polishing
    • Others

    Russia Non-Woven Abrasives, By End-Use Industry (Kilo Tons,USD Million,2019-2035)

    • Transportation
    • Building & Construction
    • Electrical & Electronics
    • Industrial Machinery
    • Others


    Rest of Europe Outlook (Kilo Tons,USD Million,2019-2035)

    Rest of Europe Non-Woven Abrasives, By Substrate (Kilo Tons,USD Million,2019-2035)

    • Metal
    • Glass
    • Plastic
    • Composite
    • Wood
    • Others

    Rest of Europe Non-Woven Abrasives, By Product (Kilo Tons,USD Million,2019-2035)

    • Hand Pads
    • Rolls
    • Discs
    • Belts
    • Wheels
    • Brushes

    Rest of Europe Non-Woven Abrasives, By Application (Kilo Tons,USD Million,2019-2035)

    • Deburring
    • Finishing
    • Cleaning
    • Polishing
    • Others

    Rest of Europe Non-Woven Abrasives, By End-Use Industry (Kilo Tons,USD Million,2019-2035)

    • Transportation
    • Building & Construction
    • Electrical & Electronics
    • Industrial Machinery
    • Other

    Asia-Pacific Outlook (Kilo Tons,USD Million,2019-2035)

    Asia-Pacific Non-Woven Abrasives, By Substrate (Kilo Tons,USD Million,2019-2035)

    • Metal
    • Glass
    • Plastic
    • Composite
    • Wood
    • Others

    Asia-Pacific Non-Woven Abrasives, By Product (Kilo Tons,USD Million,2019-2035)

    • Hand Pads
    • Rolls
    • Discs
    • Belts
    • Wheels
    • Brushes

    Asia-Pacific Non-Woven Abrasives, By Application (Kilo Tons,USD Million,2019-2035)

    • Deburring
    • Finishing
    • Cleaning
    • Polishing
    • Others

    Asia-Pacific Non-Woven Abrasives, By End-Use Industry (Kilo Tons,USD Million,2019-2035)

    • Transportation
    • Building & Construction
    • Electrical & Electronics
    • Industrial Machinery
    • Others

    China Outlook (Kilo Tons,USD Million,2019-2035)

    China Non-Woven Abrasives, By Substrate (Kilo Tons,USD Million,2019-2035)

    • Metal
    • Glass
    • Plastic
    • Composite
    • Wood
    • Others

    China Non-Woven Abrasives, By Product (Kilo Tons,USD Million,2019-2035)

    • Hand Pads
    • Rolls
    • Discs
    • Belts
    • Wheels
    • Brushes

    China Non-Woven Abrasives, By Application (Kilo Tons,USD Million,2019-2035)

    • Deburring
    • Finishing
    • Cleaning
    • Polishing
    • Others

    China Non-Woven Abrasives, By End-Use Industry (Kilo Tons,USD Million,2019-2035)

    • Transportation
    • Building & Construction
    • Electrical & Electronics
    • Industrial Machinery
    • Others

    Japan Outlook (Kilo Tons,USD Million,2019-2035)

    Japan Non-Woven Abrasives, By Substrate (Kilo Tons,USD Million,2019-2035)

    • Metal
    • Glass
    • Plastic
    • Composite
    • Wood
    • Others

    Japan Non-Woven Abrasives, By Product (Kilo Tons,USD Million,2019-2035)

    • Hand Pads
    • Rolls
    • Discs
    • Belts
    • Wheels
    • Brushes

    Japan Non-Woven Abrasives, By Application (Kilo Tons,USD Million,2019-2035)

    • Deburring
    • Finishing
    • Cleaning
    • Polishing
    • Others

    Japan Non-Woven Abrasives, By End-Use Industry (Kilo Tons,USD Million,2019-2035)

    • Transportation
    • Building & Construction
    • Electrical & Electronics
    • Industrial Machinery
    • Others

    India Outlook (Kilo Tons,USD Million,2019-2035)

    India Non-Woven Abrasives, By Substrate (Kilo Tons,USD Million,2019-2035)

    • Metal
    • Glass
    • Plastic
    • Composite
    • Wood
    • Others

    India Non-Woven Abrasives, By Product (Kilo Tons,USD Million,2019-2035)

    • Hand Pads
    • Rolls
    • Discs
    • Belts
    • Wheels
    • Brushes

    India Non-Woven Abrasives, By Application (Kilo Tons,USD Million,2019-2035)

    • Deburring
    • Finishing
    • Cleaning
    • Polishing
    • Others

    India Non-Woven Abrasives, By End-Use Industry (Kilo Tons,USD Million,2019-2035)

    • Transportation
    • Building & Construction
    • Electrical & Electronics
    • Industrial Machinery
    • Others

    South Korea Outlook (Kilo Tons,USD Million,2019-2035)

    South Korea Non-Woven Abrasives, By Substrate (Kilo Tons,USD Million,2019-2035)

    • Metal
    • Glass
    • Plastic
    • Composite
    • Wood
    • Others

    South Korea Non-Woven Abrasives, By Product (Kilo Tons,USD Million,2019-2035)

    • Hand Pads
    • Rolls
    • Discs
    • Belts
    • Wheels
    • Brushes

    South Korea Non-Woven Abrasives, By Application (Kilo Tons,USD Million,2019-2035)

    • Deburring
    • Finishing
    • Cleaning
    • Polishing
    • Others

    South Korea Non-Woven Abrasives, By End-Use Industry (Kilo Tons,USD Million,2019-2035)

    • Transportation
    • Building & Construction
    • Electrical & Electronics
    • Industrial Machinery
    • Others

    Rest of Asia-Pacific Outlook (Kilo Tons,USD Million,2019-2035)

    Rest of Asia-Pacific Non-Woven Abrasives, By Substrate (Kilo Tons,USD Million,2019-2035)

    • Metal
    • Glass
    • Plastic
    • Composite
    • Wood
    • Others

    Rest of Asia-Pacific Non-Woven Abrasives, By Product (Kilo Tons,USD Million,2019-2035)

    • Hand Pads
    • Rolls
    • Discs
    • Belts
    • Wheels
    • Brushes

    Rest of Asia-Pacific Non-Woven Abrasives, By Application (Kilo Tons,USD Million,2019-2035)

    • Deburring
    • Finishing
    • Cleaning
    • Polishing
    • Others

    Rest of Asia-Pacific Non-Woven Abrasives, By End-Use Industry (Kilo Tons,USD Million,2019-2035)

    • Transportation
    • Building & Construction
    • Electrical & Electronics
    • Industrial Machinery
    • Others

    South America Outlook (Kilo Tons,USD Million,2019-2035)

    South America Non-Woven Abrasives, By Substrate (Kilo Tons,USD Million,2019-2035)

    • Metal
    • Glass
    • Plastic
    • Composite
    • Wood
    • Others

    South America Non-Woven Abrasives, By Product (Kilo Tons,USD Million,2019-2035)

    • Hand Pads
    • Rolls
    • Discs
    • Belts
    • Wheels
    • Brushes

    South America Non-Woven Abrasives, By Application (Kilo Tons,USD Million,2019-2035)

    • Deburring
    • Finishing
    • Cleaning
    • Polishing
    • Others

    South America Non-Woven Abrasives, By End-Use Industry (Kilo Tons,USD Million,2019-2035)

    • Transportation
    • Building & Construction
    • Electrical & Electronics
    • Industrial Machinery
    • Others

    Brazil Outlook (Kilo Tons,USD Million,2019-2035)

    Brazil Non-Woven Abrasives, By Substrate (Kilo Tons,USD Million,2019-2035)

    • Metal
    • Glass
    • Plastic
    • Composite
    • Wood
    • Others

    Brazil Non-Woven Abrasives, By Product (Kilo Tons,USD Million,2019-2035)

    • Hand Pads
    • Rolls
    • Discs
    • Belts
    • Wheels
    • Brushes

    Brazil Non-Woven Abrasives, By Application (Kilo Tons,USD Million,2019-2035)

    • Deburring
    • Finishing
    • Cleaning
    • Polishing
    • Others

    Brazil Non-Woven Abrasives, By End-Use Industry (Kilo Tons,USD Million,2019-2035)

    • Transportation
    • Building & Construction
    • Electrical & Electronics
    • Industrial Machinery
    • Others

    Argentina Outlook (Kilo Tons,USD Million,2019-2035)

    Argentina Non-Woven Abrasives, By Substrate (Kilo Tons,USD Million,2019-2035)

    • Metal
    • Glass
    • Plastic
    • Composite
    • Wood
    • Others

    Argentina Non-Woven Abrasives, By Product (Kilo Tons,USD Million,2019-2035)

    • Hand Pads
    • Rolls
    • Discs
    • Belts
    • Wheels
    • Brushes

    Argentina Non-Woven Abrasives, By Application (Kilo Tons,USD Million,2019-2035)

    • Deburring
    • Finishing
    • Cleaning
    • Polishing
    • Others

    Argentina Non-Woven Abrasives, By End-Use Industry (Kilo Tons,USD Million,2019-2035)

    • Transportation
    • Building & Construction
    • Electrical & Electronics
    • Industrial Machinery
    • Others

    Rest of South America Outlook (Kilo Tons,USD Million,2019-2035)

    Rest of South America Non-Woven Abrasives, By Substrate (Kilo Tons,USD Million,2019-2035)

    • Metal
    • Glass
    • Plastic
    • Composite
    • Wood
    • Others

    Rest of South America Non-Woven Abrasives, By Product (Kilo Tons,USD Million,2019-2035)

    • Hand Pads
    • Rolls
    • Discs
    • Belts
    • Wheels
    • Brushes

    Rest of South America Non-Woven Abrasives, By Application (Kilo Tons,USD Million,2019-2035)

    • Deburring
    • Finishing
    • Cleaning
    • Polishing
    • Others

    Rest of South America Non-Woven Abrasives, By End-Use Industry (Kilo Tons,USD Million,2019-2035)

    • Transportation
    • Building & Construction
    • Electrical & Electronics
    • Industrial Machinery
    • Others

    Middle East & Africa Outlook (Kilo Tons,USD Million,2019-2035)

    Middle East & Africa Non-Woven Abrasives, By Substrate (Kilo Tons,USD Million,2019-2035)

    • Metal
    • Glass
    • Plastic
    • Composite
    • Wood
    • Others

    Middle East & Africa Non-Woven Abrasives, By Product (Kilo Tons,USD Million,2019-2035)

    • Hand Pads
    • Rolls
    • Discs
    • Belts
    • Wheels
    • Brushes

    Middle East & Africa Non-Woven Abrasives, By Application (Kilo Tons,USD Million,2019-2035)

    • Deburring
    • Finishing
    • Cleaning
    • Polishing
    • Others

    Middle East & Africa Non-Woven Abrasives, By End-Use Industry (Kilo Tons,USD Million,2019-2035)

    • Transportation
    • Building & Construction
    • Electrical & Electronics
    • Industrial Machinery
    • Others

    GCC Countries Outlook (Kilo Tons,USD Million,2019-2035)

    GCC Countries Non-Woven Abrasives, By Substrate (Kilo Tons,USD Million,2019-2035)

    • Metal
    • Glass
    • Plastic
    • Composite
    • Wood
    • Others

    GCC Countries Non-Woven Abrasives, By Product (Kilo Tons,USD Million,2019-2035)

    • Hand Pads
    • Rolls
    • Discs
    • Belts
    • Wheels
    • Brushes

    GCC Countries Non-Woven Abrasives, By Application (Kilo Tons,USD Million,2019-2035)

    • Deburring
    • Finishing
    • Cleaning
    • Polishing
    • Others

    GCC Countries Non-Woven Abrasives, By End-Use Industry (Kilo Tons,USD Million,2019-2035)

    • Transportation
    • Building & Construction
    • Electrical & Electronics
    • Industrial Machinery
    • Others

    South Africa Outlook (Kilo Tons,USD Million,2019-2035)

    South Africa Non-Woven Abrasives, By Substrate (Kilo Tons,USD Million,2019-2035)

    • Metal
    • Glass
    • Plastic
    • Composite
    • Wood
    • Others

    South Africa Non-Woven Abrasives, By Product (Kilo Tons,USD Million,2019-2035)

    • Hand Pads
    • Rolls
    • Discs
    • Belts
    • Wheels
    • Brushes

    South Africa Non-Woven Abrasives, By Application (Kilo Tons,USD Million,2019-2035)

    • Deburring
    • Finishing
    • Cleaning
    • Polishing
    • Others

    South Africa Non-Woven Abrasives, By End-Use Industry (Kilo Tons,USD Million,2019-2035)

    • Transportation
    • Building & Construction
    • Electrical & Electronics
    • Industrial Machinery
    • Others

    Rest of Middle East & Africa Outlook (Kilo Tons,USD Million,2019-2035)

    Rest of Middle East & Africa Non-Woven Abrasives, By Substrate (Kilo Tons,USD Million,2019-2035)

    • Metal
    • Glass
    • Plastic
    • Composite
    • Wood
    • Others

    Rest of Middle East & Africa Non-Woven Abrasives, By Product (Kilo Tons,USD Million,2019-2035)

    • Hand Pads
    • Rolls
    • Discs
    • Belts
    • Wheels
    • Brushes

    Rest of Middle East & Africa Non-Woven Abrasives, By Application (Kilo Tons,USD Million,2019-2035)

    • Deburring
    • Finishing
    • Cleaning
    • Polishing
    • Others

    Rest of Middle East & Africa Non-Woven Abrasives, By End-Use Industry (Kilo Tons,USD Million,2019-2035)

    • Transportation
    • Building & Construction
    • Electrical & Electronics
    • Industrial Machinery
    • Others
    Infographic

    Free Sample Request

    Kindly complete the form below to receive a free sample of this Report

    Get Free Sample

    Customer Strories

    “I am very pleased with how market segments have been defined in a relevant way for my purposes (such as "Portable Freezers & refrigerators" and "last-mile"). In general the report is well structured. Thanks very much for your efforts.”

    Victoria Milne

    Founder
    Case Study
    Chemicals and Materials