• Cat-intel
  • MedIntelliX
  • Resources
  • About Us
  • Hero Background
    English
    Chinese
    French
    Japanese
    Korean
    German
    Spanish

    North America Moringa Products Market Trends

    ID: MRFR/F-B & N/8862-CR
    100 Pages
    Snehal Singh
    November 2020

    North America Moringa Products Market Research Report Information By Type (Leaves & Leaf Powder, Oil, Seeds and Others), End-Use (Functional Food and Beverages, Nutraceuticals, Pharmaceuticals, Personal Care and Others) and Country (US, Canada and Mexico) - Forecast till 2035

    Share:
    Download PDF ×

    We do not share your information with anyone. However, we may send you emails based on your report interest from time to time. You may contact us at any time to opt-out.

    North America Moringa Products Market Infographic
    $ 4,950.0
    $ 5,950.0
    $ 7,250.0

    Market Trends

    Key Emerging Trends in the North America Moringa Products Market

    The Moringa Products Market is currently witnessing several noteworthy trends that reflect the evolving preferences of consumers and the broader health and wellness landscape. One prominent trend is the increasing popularity of Moringa as a superfood. Consumers are becoming more aware of the rich nutritional profile of Moringa, which includes essential vitamins, minerals, and antioxidants. This heightened awareness has led to a surge in demand for Moringa-based products across various categories, such as supplements, powders, teas, and oils, as individuals seek to incorporate this nutrient-dense plant into their daily diets. Sustainability is emerging as a key trend in the Moringa Products Market. Moringa is known for its adaptability to diverse climates and soil conditions, making it a sustainable crop that requires minimal resources for cultivation. As environmental concerns become more prevalent, consumers are gravitating towards products that align with eco-friendly practices. The sustainability of Moringa production positions it as an attractive option for those seeking products with a lower environmental impact. Additionally, the Moringa Products Market is experiencing a surge in demand for organic and non-GMO products. Consumers are increasingly prioritizing natural and chemical-free options, and this preference extends to Moringa-based products. Companies that offer certified organic Moringa products are capitalizing on this trend, appealing to health-conscious consumers who value clean and transparent ingredient sourcing. The rise of plant-based lifestyles is influencing the Moringa Products Market significantly. As more individuals adopt vegetarian or vegan diets, Moringa has become a valuable source of essential nutrients often found in animal products. Moringa's versatility allows it to cater to the plant-based movement, positioning it as a sought-after ingredient in plant-based foods, snacks, and supplements. In terms of product innovation, there is a growing trend of incorporating Moringa into functional and convenient formats. Companies are developing Moringa-infused beverages, snacks, and ready-to-eat products to meet the demand for on-the-go nutrition. This trend reflects the changing consumer preferences for convenient yet nutritious options that fit into their busy lifestyles. Moreover, the cosmetic and personal care industry is exploring the benefits of Moringa in skincare products. Moringa oil, extracted from the seeds, is gaining recognition for its moisturizing and antioxidant properties. This trend highlights the diversification of Moringa applications beyond dietary supplements, expanding its presence in the beauty and wellness sector. The Moringa Products Market is also witnessing increased online sales and direct-to-consumer channels. The convenience of online shopping, coupled with the ability to access a broader range of Moringa products, has contributed to the growth of e-commerce in this market. Companies are leveraging digital platforms to reach a wider audience and offer educational content about the nutritional benefits of Moringa, fostering consumer engagement and loyalty.

    Market Summary

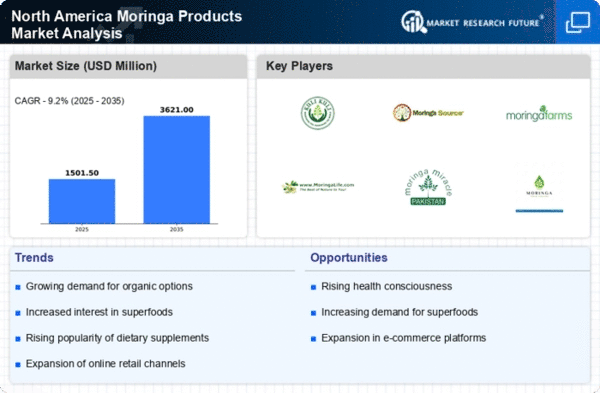
    The North America Moringa Products market is projected to grow significantly from 1.53 USD Billion in 2024 to 4.85 USD Billion by 2035.

    Key Market Trends & Highlights

    North America Moringa Products Key Trends and Highlights

    • The market is expected to experience a compound annual growth rate of 11.05 percent from 2025 to 2035.
    • By 2035, the market valuation is anticipated to reach 4.85 USD Billion, indicating robust growth potential.
    • In 2024, the market is valued at 1.53 USD Billion, reflecting a strong foundation for future expansion.
    • Growing adoption of health and wellness products due to increasing consumer awareness is a major market driver.

    Market Size & Forecast

    2024 Market Size 1.53 (USD Million)
    2035 Market Size 4.85 (USD Million)
    CAGR (2025-2035) 11.05%
    Largest Regional Market Share in 2024 south_america)

    Major Players

    Moringa Pura Vida (Mexico), Kuli Kuli, Inc. (US), Only Natural Inc. (US), Green Virgin Products LLC (US), Kiva (US), Sunfood (US), ADUNA Ltd. (UK), Ancient Greenfields Pvt Ltd (India), Bio Nutrition Inc. (US), Nutramarks, Inc. (US)

    Market Trends

    North America Moringa Products Market Market Drivers

    Market Segment Insights

    Regional Insights

    Key Companies in the North America Moringa Products Market market include

    Industry Developments

    Market Segmentation

    Market Segmentation

    • North America Moringa Products Market, By Type
    • North America Moringa Products Market, By End Use
    • North America Moringa Products Market, By Country
    • Intended Audience
    • Food & Beverage manufacturers
    • Pharmaceutical & Nutraceutical Product Manufacturers
    • Traders, Wholesalers, Retailers, and Distributors
    • Governments, Farmers, Associations, and Industrial Bodies
    • Investors and Trade Experts
    • US
    • Canada
    • Mexico
    • Functional Food and Beverages
    • Nutraceuticals
    • Pharmaceuticals
    • Personal Care
    • Others
    • Leaves & Leaf Powder
    • Oil
    • Seeds
    • Others

    Report Scope

    {"0"=>{"market_size"=>" USD 2263.6 Million"}, "1"=>{"cagr"=>"10% (2020-2027)"}, "2"=>{"base_year"=>"2019"}, "3"=>{"forecast_period"=>"2020-2027"}, "4"=>{"historical_data"=>"2018"}, "5"=>{"forecast_units"=>" Value (USD Million)"}, "6"=>{"report_coverage"=>" Revenue Forecast, Competitive Landscape, Growth Factors, and Trends"}, "7"=>{"segments_covered"=>"By Type, By End-Use, and By Country"}, "8"=>{"geographies_covered"=>" North America, Europe, Asia-Pacific, and Rest of the World (RoW)"}, "9"=>{"key_vendors"=>"Moringa Pura Vida (Mexico), Kuli Kuli Inc. (US), Only Natural Inc. (US), Green Virgin Products LLC (US), Kiva (US), Sunfood (US), ADUNA Ltd. (UK), Ancient Greenfields Pvt Ltd (India), Bio Nutrition Inc. (US), Nutramarks Inc.(US)"}, "10"=>{"key_market_opportunities"=>"High nutritive and medicinal properties of the moringa tree are expected to drive the growth of the North America"}, "11"=>{"key_market_drivers"=>"High Nutritive and Medicinal Properties of The Moringa Tree"}}

    Market Highlights

    Author

    Snehal Singh
    Assistant Manager - Research

    She holds an experience of about 6+ years in market research and business consulting, working under the spectrum of information communication technology, telecommunications and semiconductor domains. aarti conceptualizes and implements a scalable business strategy and provides strategic leadership to the clients. her expertise lies in market estimation, competitive intelligence, pipeline analysis, customer assessment, etc.

    Leave a Comment

    Latest Comments

    John Doe
    john@example.com

    This is a great article! Really helped me understand the topic better.

    Posted on July 23, 2025, 10:15 AM
    Jane Smith
    jane@domain.com

    Thanks for sharing this. I’ve bookmarked it for later reference.

    Posted on July 22, 2025, 7:45 PM

    FAQs

    How big will the North America Moringa Products Industry be in the 2027?

    North America Moringa Products Industry Size is expected to reach 2,263.6 Million By 2027

    What is the growth rate of the North America Moringa Products Market during the forecast period of 2020–2027?

    North America Moringa Products Market is anticipated to grow at a 10% during the forecast period of 2020–2027

    Who are the leading key players in the North America Moringa Products Market?

    Moringa Pura Vida (Mexico), Kuli Kuli Inc. (US), Only Natural Inc. (US), Green Virgin Products LLC (US), Kiva (US), Sunfood (US), ADUNA Ltd. (UK), Ancient Greenfields Pvt Ltd (India), Bio Nutrition Inc. (US), Nutramarks Inc.(US)

    Which Country will lead the North America Moringa Products Market?

    US will dominate the North America Moringa Products Market

    1. Executive Summary
      1. NORTH AMERICA MORINGA PRODUCTS MARKET, BY PRODUCT TYPE 14
        1. NORTH AMERICA MORINGA PRODUCTS MARKET, BY END USE 15
    2. Market Introduction
      1. DEFINITION 16
      2. SCOPE OF STUDY 16
      3. MARKET STRUCTURE 16
      4. KEY BUYING CRITERIA 17
    3. Research Methodology
      1. RESEARCH PROCESS 18
      2. PRIMARY RESEARCH 19
      3. SECONDARY RESEARCH 20
      4. MARKET SIZE ESTIMATION 21
      5. FORECAST MODEL 22
      6. LIST OF ASSUMPTIONS & LIMITATIONS 23
    4. MARKET DYNAMICS
      1. INTRODUCTION 24
      2. DRIVERS 25
        1. NUTRITIVE AND MEDICINAL PROPERTIES OF MORINGA 25
        2. INCREASING APPLICATION OF MORINGA IN VARIOUS INDUSTRIES 27
        3. DRIVERS IMPACT ANALYSIS 27
      3. RESTRAINT 28
        1. GAP IN DEMAND AND SUPPLY 28
        2. RESTRAINT IMPACT ANALYSIS 28
      4. OPPORTUNITY 29
        1. RISING DEMAND FOR NATURAL PRODUCTS 29
      5. CHALLENGE 29
        1. LIMITED CONSUMER AWARENESS 29
    5. MARKET FACTOR ANALYSIS
      1. VALUE CHAIN ANALYSIS 30
        1. RAW MATERIAL PROCUREMENT 31
        2. PROCESSING 31
        3. PACKAGING 31
      2. SUPPLY CHAIN ANALYSIS 32
      3. PORTER’S FIVE FORCES MODEL 33
        1. THREAT OF NEW ENTRANTS 33
        2. BARGAINING POWER OF SUPPLIERS 34
        3. BARGAINING POWER OF BUYERS 34
        4. THREAT OF SUBSTITUTES 34
        5. INTENSITY OF RIVALRY 34
      4. IMPACT OF COVID-19 ON THE NORTH AMERICA MORINGA PRODUCTS MARKET 35
      5. LIST OF POTENTIAL BUYERS IN NORTH AMERICA 36
      6. IMPORT VOLUME FOR NORTH AMERICA 36
      7. AVERAGE PRICING PER TON FOR NORTH AMERICAN REGION 36
    6. NORTH AMERICA MORINGA PRODUCTS MARKET, BY PRODUCT TYPE
      1. OVERVIEW 37
        1. NORTH AMERICA MORINGA PRODUCTS MARKET ESTIMATES & FORECAST, BY PRODUCT TYPE, 2020–2027 (USD MILLION) 38
        2. NORTH AMERICA MORINGA PRODUCTS MARKET ESTIMATES & FORECAST, BY PRODUCT TYPE, 2020–2027 (KT) 38
      2. LEAVES & LEAF POWDER 39
        1. LEAVES & LEAF POWDER: MARKET ESTIMATES & FORECAST, BY COUNTRY, 2020–2027 (USD MILLION) 39
        2. LEAVES & LEAF POWDER: MARKET ESTIMATES & FORECAST, BY COUNTRY, 2020–2027 (KT) 39
      3. OIL 40
        1. OIL: MARKET ESTIMATES & FORECAST, BY COUNTRY, 2020–2027 (USD MILLION) 40
        2. OIL: MARKET ESTIMATES & FORECAST, BY COUNTRY, 2020–2027 (KT) 40
      4. SEEDS 41
        1. SEEDS: MARKET ESTIMATES & FORECAST, BY COUNTRY, 2020–2027 (USD MILLION) 41
        2. SEEDS: MARKET ESTIMATES & FORECAST, BY COUNTRY, 2020–2027 (KT) 41
      5. OTHERS 42
        1. OTHERS: MARKET ESTIMATES & FORECAST, BY COUNTRY, 2020–2027 (USD MILLION) 42
        2. OTHERS: MARKET ESTIMATES & FORECAST, BY COUNTRY, 2020–2027 (KT) 42
    7. NORTH AMERICA MORINGA PRODUCTS MARKET, BY END USE
      1. OVERVIEW 43
        1. NORTH AMERICA MORINGA PRODUCTS MARKET ESTIMATES & FORECAST, BY END USE, 2020–2027 (USD MILLION) 44
        2. NORTH AMERICA MORINGA PRODUCTS MARKET ESTIMATES & FORECAST, BY END USE, 2020–2027 (KT) 44
      2. FUNCTIONAL FOOD & BEVERAGES 45
        1. FUNCTIONAL FOOD & BEVERAGES: MARKET ESTIMATES & FORECAST, BY COUNTRY, 2020–2027 (USD MILLION) 45
        2. FUNCTIONAL FOOD & BEVERAGES: MARKET ESTIMATES & FORECAST, BY COUNTRY, 2020–2027 (KT) 45
      3. NUTRACEUTICAL 46
        1. NUTRACEUTICALS: MARKET ESTIMATES & FORECAST, BY COUNTRY, 2020–2027 (USD MILLION) 46
        2. NUTRACEUTICALS: MARKET ESTIMATES & FORECAST, BY COUNTRY, 2020–2027 (KT) 46
      4. PHARMACEUTICALS 47
        1. PHARMACEUTICALS: MARKET ESTIMATES & FORECAST, BY COUNTRY, 2020–2027 (USD MILLION) 47
        2. PHARMACEUTICALS: MARKET ESTIMATES & FORECAST, BY COUNTRY, 2020–2027 (KT) 47
      5. PERSONAL CARE 48
        1. PERSONAL CARE: MARKET ESTIMATES & FORECAST, BY COUNTRY, 2020–2027 (USD MILLION) 48
        2. PERSONAL CARE: MARKET ESTIMATES & FORECAST, BY COUNTRY, 2020–2027 (KT) 48
      6. OTHERS 49
        1. OTHERS: MARKET ESTIMATES & FORECAST, BY COUNTRY, 2020–2027 (USD MILLION) 49
        2. OTHERS: MARKET ESTIMATES & FORECAST, BY COUNTRY, 2020–2027 (KT) 49
    8. NORTH AMERICA MORINGA PRODUCTS MARKET, BY COUNTRY
      1. OVERVIEW 50
      2. US 52
      3. CANADA 54
      4. MEXICO 56
    9. Competitive Landscape
      1. COMPETITIVE OVERVIEW 58
      2. MARKET STRATEGY ANALYSIS 58
      3. COMPETITIVE BENCHMARKING 59
    10. COMPANY PROFILES
      1. MORINGA PURA VIDA 60
        1. COMPANY OVERVIEW 60
        2. FINANCIAL OVERVIEW 60
        3. PRODUCTS OFFERED 60
        4. KEY DEVELOPMENTS 60
        5. SWOT ANALYSIS 61
        6. KEY STRATEGIES 61
      2. KULI KULI, INC. 62
        1. COMPANY OVERVIEW 62
        2. FINANCIAL OVERVIEW 62
        3. PRODUCTS OFFERED 62
        4. KEY DEVELOPMENTS 63
        5. SWOT ANALYSIS 63
        6. KEY STRATEGIES 63
      1. ONLY NATURAL INC. 64
        1. COMPANY OVERVIEW 64
        2. FINANCIAL OVERVIEW 64
        3. PRODUCTS OFFERED 64
        4. KEY DEVELOPMENTS 64
        5. SWOT ANALYSIS 65
        6. KEY STRATEGIES 65
      2. GREEN VIRGIN PRODUCTS LLC 66
        1. COMPANY OVERVIEW 66
        2. FINANCIAL OVERVIEW 66
        3. PRODUCTS OFFERED 66
        4. KEY DEVELOPMENTS 67
        5. SWOT ANALYSIS 67
        6. KEY STRATEGIES 67
      3. ANCIENT GREENFIELDS PVT LTD. 68
        1. COMPANY OVERVIEW 68
        2. FINANCIAL OVERVIEW 68
        3. PRODUCTS OFFERED 68
        4. KEY DEVELOPMENTS 68
        5. SWOT ANALYSIS 69
        6. KEY STRATEGIES 69
      4. KIVA 70
        1. COMPANY OVERVIEW 70
        2. FINANCIAL OVERVIEW 70
        3. PRODUCTS OFFERED 70
        4. KEY DEVELOPMENTS 70
        5. KEY STRATEGIES 70
      5. SUNFOOD 71
        1. COMPANY OVERVIEW 71
        2. FINANCIAL OVERVIEW 71
        3. PRODUCTS OFFERED 71
        4. KEY DEVELOPMENTS 71
        5. KEY STRATEGIES 71
      6. ADUNA LTD. 72
        1. COMPANY OVERVIEW 72
        2. FINANCIAL OVERVIEW 72
        3. PRODUCTS OFFERED 72
        4. KEY DEVELOPMENTS 72
        5. KEY STRATEGIES 72
      7. BIO NUTRITION INC. 73
        1. COMPANY OVERVIEW 73
        2. FINANCIAL OVERVIEW 73
        3. PRODUCTS OFFERED 73
        4. KEY DEVELOPMENTS 73
        5. KEY STRATEGIES 73
      8. NUTRAMARKS, INC. 74
        1. COMPANY OVERVIEW 74
        2. FINANCIAL OVERVIEW 74
        3. PRODUCTS OFFERED 74
        4. KEY DEVELOPMENTS 74
        5. KEY STRATEGIES 74
    11. List of Tables and Figures
      1. 11 LIST OF TABLES
      2. TABLE 1 PRIMARY INTERVIEWS 19
      3. TABLE 2 LIST OF ASSUMPTIONS 23
      4. TABLE 3 NUTRITIONAL VALUE ANALYSIS OF MORINGA OLEIFERA LEAVES, LEAF POWDER, SEEDS, AND PODS IN 100 GRAM PER PLANT MATERIAL 25
      5. TABLE 4 MEDICINAL USES OF DIFFERENT PARTS OF MORINGA OLEIFERA 26
      6. TABLE 5 NORTH AMERICA MORINGA PRODUCTS MARKET ESTIMATES & FORECAST, BY PRODUCT TYPE, 2021–2027 (USD MILLION) 38
      7. TABLE 6 NORTH AMERICA MORINGA PRODUCTS MARKET ESTIMATES & FORECAST, BY PRODUCT TYPE, 2021–2027 (KT) 38
      8. TABLE 7 LEAVES & LEAF POWDER: MARKET ESTIMATES & FORECAST, BY COUNTRY, 2021–2027 (USD MILLION) 39
      9. TABLE 8 LEAVES & LEAF POWDER: MARKET ESTIMATES & FORECAST, BY COUNTRY, 2021–2027 (KT) 39
      10. TABLE 9 OIL: MARKET ESTIMATES & FORECAST, BY COUNTRY, 2021–2027 (USD MILLION) 40
      11. TABLE 10 OIL: MARKET ESTIMATES & FORECAST, BY COUNTRY, 2021–2027 (KT) 40
      12. TABLE 11 SEEDS: MARKET ESTIMATES & FORECAST, BY COUNTRY, 2021–2027 (USD MILLION) 41
      13. TABLE 12 SEEDS: MARKET ESTIMATES & FORECAST, BY COUNTRY, 2021–2027 (KT) 41
      14. TABLE 13 OTHERS: MARKET ESTIMATES & FORECAST, BY COUNTRY, 2021–2027 (USD MILLION) 42
      15. TABLE 14 OTHERS: MARKET ESTIMATES & FORECAST, BY COUNTRY, 2021–2027 (KT) 42
      16. TABLE 15 NORTH AMERICA MORINGA PRODUCTS MARKET ESTIMATES & FORECAST, BY END USE, 2021–2027 (USD MILLION) 44
      17. TABLE 16 NORTH AMERICA MORINGA PRODUCTS MARKET ESTIMATES & FORECAST, BY END USE, 2021–2027 (KT) 44
      18. TABLE 17 FUNCTIONAL FOOD & BEVERAGES: MARKET ESTIMATES & FORECAST, BY COUNTRY, 2021–2027 (USD MILLION) 45
      19. TABLE 18 FUNCTIONAL FOOD & BEVERAGES: MARKET ESTIMATES & FORECAST, BY COUNTRY, 2021–2027 (KT) 45
      20. TABLE 19 NUTRACEUTICALS: MARKET ESTIMATES & FORECAST, BY COUNTRY, 2021–2027 (USD MILLION) 46
      21. TABLE 20 NUTRACEUTICALS: MARKET ESTIMATES & FORECAST, BY COUNTRY, 2021–2027 (KT) 46
      22. TABLE 21 PHARMACEUTICALS: MARKET ESTIMATES & FORECAST, BY COUNTRY, 2021–2027 (USD MILLION) 47
      23. TABLE 22 PHARMACEUTICALS: MARKET ESTIMATES & FORECAST, BY COUNTRY, 2021–2027 (KT) 47
      24. TABLE 23 PERSONAL CARE: MARKET ESTIMATES & FORECAST, BY COUNTRY, 2021–2027 (USD MILLION) 48
      25. TABLE 24 PERSONAL CARE: MARKET ESTIMATES & FORECAST, BY COUNTRY, 2021–2027 (KT) 48
      26. TABLE 25 OTHERS: MARKET ESTIMATES & FORECAST, BY COUNTRY, 2021–2027 (USD MILLION) 49
      27. TABLE 26 OTHERS: MARKET ESTIMATES & FORECAST, BY COUNTRY, 2021–2027 (KT) 49
      28. TABLE 27 NORTH AMERICA MORINGA PRODUCTS MARKET ESTIMATES & FORECAST, BY COUNTRY, 2021–2027 (USD MILLION) 51
      29. TABLE 28 NORTH AMERICA MORINGA PRODUCTS MARKET ESTIMATES & FORECAST, BY COUNTRY, 2021–2027 (KT) 51
      30. TABLE 29 US: MORINGA PRODUCTS MARKET, BY PRODUCT TYPE, 2021–2027 (USD MILLION) 52
      31. TABLE 30 US: MORINGA PRODUCTS MARKET, BY PRODUCT TYPE, 2021–2027 (KT) 52
      32. TABLE 31 US: MORINGA PRODUCTS MARKET, BY END USE, 2021–2027 (USD MILLION) 53
      33. TABLE 32 US: MORINGA PRODUCTS MARKET, BY END USE, 2021–2027 (KT) 53
      34. TABLE 33 CANADA: MORINGA PRODUCTS MARKET, BY PRODUCT TYPE, 2021–2027 (USD MILLION) 54
      35. TABLE 34 CANADA: MORINGA PRODUCTS MARKET, BY PRODUCT TYPE, 2021–2027 (KT) 54
      36. TABLE 35 CANADA: MORINGA PRODUCTS MARKET, BY END USE, 2021–2027 (USD MILLION) 55
      37. TABLE 36 CANADA: MORINGA PRODUCTS MARKET, BY END USE, 2021–2027 (KT) 55
      38. TABLE 37 MEXICO: MORINGA PRODUCTS MARKET, BY PRODUCT TYPE, 2021–2027 (USD MILLION) 56
      39. TABLE 38 MEXICO: MORINGA PRODUCTS MARKET, BY PRODUCT TYPE, 2021–2027 (KT) 56
      40. TABLE 39 MEXICO: MORINGA PRODUCTS MARKET, BY END USE, 2021–2027 (USD MILLION) 57
      41. TABLE 40 MEXICO: MORINGA PRODUCTS MARKET, BY END USE, 2021–2027 (KT) 57
      42. TABLE 41 MORINGA PURA VIDA: PRODUCTS OFFERED 60
      43. TABLE 42 KULI KULI, INC.: PRODUCTS OFFERED 62
      44. TABLE 43 KULI KULI, INC.: KEY DEVELOPMENTS 63
      45. TABLE 44 ONLY NATURAL INC.: PRODUCTS OFFERED 64
      46. TABLE 45 GREEN VIRGIN PRODUCTS LLC.: PRODUCTS OFFERED 66
      47. TABLE 46 ANCIENT GREENFIELDS PVT LTD.: PRODUCTS OFFERED 68
      48. TABLE 47 KIVA: PRODUCTS OFFERED 70
      49. TABLE 48 SUNFOOD: PRODUCTS OFFERED 71
      50. TABLE 49 ADUNA LTD.: PRODUCTS OFFERED 72
      51. TABLE 50 BIO NUTRITION INC.: PRODUCTS OFFERED 73
      52. TABLE 51 NUTRAMARKS, INC.: PRODUCTS OFFERED 74
      53. TABLE 52 NUTRAMARKS, INC.: KEY DEVELOPMENTS 74 12 LIST OF FIGURES
      54. FIGURE 1 MARKET SYNOPSIS 13
      55. FIGURE 2 NORTH AMERICA MORINGA PRODUCTS MARKET ANALYSIS, BY PRODUCT TYPE 14
      56. FIGURE 3 NORTH AMERICA MORINGA PRODUCTS MARKET ANALYSIS, BY END USE 15
      57. FIGURE 4 NORTH AMERICA MORINGA PRODUCTS MARKET: STRUCTURE 16
      58. FIGURE 5 KEY BUYING CRITERIA FOR CLEAN LABEL INGREDIENTS 17
      59. FIGURE 6 RESEARCH PROCESS 18
      60. FIGURE 7 TOP-DOWN AND Bottom-up ApproachES 21
      61. FIGURE 8 MARKET DYNAMICS OVERVIEW 24
      62. FIGURE 9 DRIVERS IMPACT ANALYSIS: NORTH AMERICA MORINGA PRODUCTS MARKET 27
      63. FIGURE 10 RESTRAINT IMPACT ANALYSIS: NORTH AMERICA MORINGA PRODUCTS MARKET 28
      64. FIGURE 11 NORTH AMERICA MORINGA PRODUCTS MARKET: VALUE CHAIN OF MORINGA PRODUCTS 30
      65. FIGURE 12 NORTH AMERICA MORINGA PRODUCTS MARKET: SUPPLY CHAIN 32
      66. FIGURE 13 PORTER''S FIVE FORCES ANALYSIS OF THE NORTH AMERICA MORINGA PRODUCTS MARKET 33
      67. FIGURE 14 NORTH AMERICA MORINGA PRODUCTS MARKET SHARE, BY PRODUCT TYPE, 2021 (% SHARE) 37
      68. FIGURE 15 NORTH AMERICA MORINGA PRODUCTS MARKET SIZE, BY PRODUCT TYPE, 2021–2027 (USD MILLION) 37
      69. FIGURE 16 NORTH AMERICA MORINGA PRODUCTS MARKET SHARE, BY END USE, 2021 (% SHARE) 43
      70. FIGURE 17 NORTH AMERICA MORINGA PRODUCTS MARKET SIZE, BY END USE, 2021–2027 (USD MILLION) 43
      71. FIGURE 18 NORTH AMERICA MORINGA PRODUCTS MARKET, BY COUNTRY, 2021–2027 (USD MILLION) 50
      72. FIGURE 19 NORTH AMERICA MORINGA PRODUCTS MARKET, BY COUNTRY, 2021–2027 (% SHARE) 50
      73. FIGURE 20 BENCHMARKING OF MAJOR COMPETITORS 59
      74. FIGURE 21 MORINGA PURA VIDA: SWOT ANALYSIS 61
      75. FIGURE 22 KULI KULI, INC.: SWOT ANALYSIS 63
      76. FIGURE 23 ONLY NATURAL INC.: SWOT ANALYSIS 65
      77. FIGURE 24 GREEN VIRGIN PRODUCTS LLC: SWOT ANALYSIS 67
      78. FIGURE 25 ANCIENT GREENFIELDS PVT LTD.: SWOT ANALYSIS 69

    North America Moringa Products Market Segmentation

    Market Segmentation Overview

    • Detailed segmentation data will be available in the full report
    • Comprehensive analysis by multiple parameters
    • Regional and country-level breakdowns
    • Market size forecasts by segment
    Infographic

    Free Sample Request

    Kindly complete the form below to receive a free sample of this Report

    Get Free Sample

    Customer Strories

    “I am very pleased with how market segments have been defined in a relevant way for my purposes (such as "Portable Freezers & refrigerators" and "last-mile"). In general the report is well structured. Thanks very much for your efforts.”

    Victoria Milne

    Founder
    Case Study
    Chemicals and Materials