×
  • Cat-intel
  • MedIntelliX
  • Resources
  • About Us
  • Hero Background
    English
    Chinese
    French
    Japanese
    Korean
    German
    Spanish

    Octylphenol Ethoxylate Market Size

    ID: MRFR/CnM/2500-HCR
    145 Pages
    Anshula Mandaokar
    October 2025

    Octylphenol Ethoxylate Market Research Report Information - by Application (Detergents, Defoaming Agents, Dispersants, Stabilizer, Adhesive, Cleaners, and others), by End Use Industry (Textiles, Agriculture, Pulp & Paper, Pharmaceutical, Oilfield, Personal Care, Paint & Coatings, Plastics, and others), and by Region- Forecast till 2035

    Share:
    Download PDF ×

    We do not share your information with anyone. However, we may send you emails based on your report interest from time to time. You may contact us at any time to opt-out.

    Octylphenol Ethoxylate Market Infographic
    Purchase Options

    Octylphenol Ethoxylate Size

    Octylphenol Ethoxylate Market Growth Projections and Opportunities

    Octylphenol Ethoxylate (OPE) market dynamics are shaped by many factors. Demand from textiles, agriculture, and industrial cleaning drives it. Agrochemical formulations, textile manufacturing, and industrial cleaning solutions use OPE, a non-ionic surfactant, for its emulsifying and dispersion capabilities. These industries' growth and performance affect OPE demand, making it essential in many industrial processes.

    Environmental awareness and regulations affect the OPE market. OPE, a chemical molecule utilized in many applications, is regulated to assure safety and environmental impact. Manufacturers must follow these requirements to meet rules and satisfy environmentally concerned customers. Sustainable and biodegradable OPE versions have influenced market dynamics due to eco-friendly methods.

    Global economic conditions shape the OPE market. Industrial output, consumer expenditure, and agricultural activities affect OPE-containing product demand. OPE demand rises when manufacturing activities across sectors rise during economic expansion. Conversely, economic downturns may restrict industrial and agricultural activity, hurting market dynamics.

    The OPE market evolves due to production technology. OPE manufacturing can be more efficient and cost-effective with synthesis and production technology innovations. Companies that invest in R&D to remain ahead of technology advances might better meet industry needs and acquire a competitive edge.

    OPE supply chain characteristics, including raw material availability and pricing, are crucial. Octylphenol and ethylene oxide are OPE's main ingredients. Raw material price fluctuations affect production costs and market dynamics. A reliable and efficient supply chain is needed to supply OPE to end-users without disruptions and preserve market stability.

    Geopolitics and global trade policies shape the OPE market. Tariffs, trade agreements, and international disputes affect chemical supply and demand. To succeed in global trade, OPE companies must monitor and adjust to these external forces. Key players, market share, and strategic efforts affect OPE market competition. To gain market share, companies innovate, extend their product portfolios, and develop strategic collaborations.
    Octylphenol Ethoxylate Market Size Graph
    Author
    Anshula Mandaokar
    Team Lead - Research

    Anshula Mandaokar holds an academic degree in Chemical Engineering and has been contributing to the field for more than 5 years. She has expertise in Market Research and Business Consulting and serves as a Team Lead for a reputed Market Research firm under the Chemicals and Materials domain spectrum. She has worked on multiple projects, generating explicit results in a quick turnaround time. Her understanding of data interpretation justifies her role as a leader.

    Leave a Comment

    FAQs

    What is the projected market valuation of the Octylphenol Ethoxylate Market by 2035?

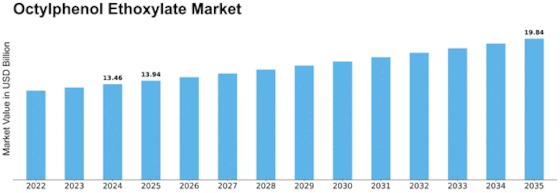
    The projected market valuation of the Octylphenol Ethoxylate Market is expected to reach 19.84 USD Billion by 2035.

    What was the market valuation of the Octylphenol Ethoxylate Market in 2024?

    The market valuation of the Octylphenol Ethoxylate Market was 13.46 USD Billion in 2024.

    What is the expected CAGR for the Octylphenol Ethoxylate Market during the forecast period 2025 - 2035?

    The expected CAGR for the Octylphenol Ethoxylate Market during the forecast period 2025 - 2035 is 3.59%.

    Market Summary

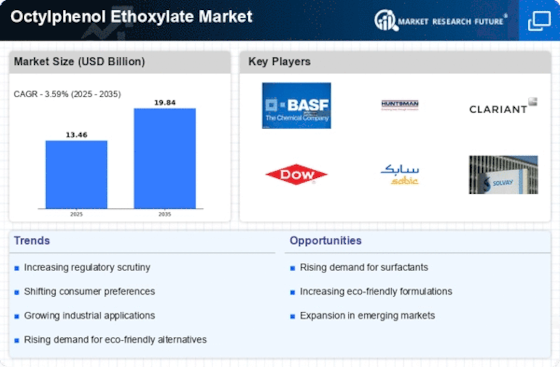
    As per MRFR analysis, the Octylphenol Ethoxylate Market Size was estimated at 13.46 USD Billion in 2024. The Octylphenol Ethoxylate industry is projected to grow from 13.94 USD Billion in 2025 to 19.84 USD Billion by 2035, exhibiting a compound annual growth rate (CAGR) of 3.59 during the forecast period 2025 - 2035.

    Key Market Trends & Highlights

    The Octylphenol Ethoxylate Market is poised for growth driven by sustainability and technological advancements.

    • North America remains the largest market for Octylphenol Ethoxylate Market, primarily due to its extensive industrial applications.
    • The Asia-Pacific region is emerging as the fastest-growing market, fueled by increasing demand in personal care and agricultural sectors.
    • Detergents represent the largest segment, while the defoaming agents segment is experiencing rapid growth due to technological innovations.
    • Key market drivers include rising demand in personal care products and the expansion of agricultural applications, which are shaping market dynamics.

    Market Size & Forecast

    2024 Market Size 13.46 (USD Billion)
    2035 Market Size 19.84 (USD Billion)
    CAGR (2025 - 2035) 3.59%
    Largest Regional Market Share in 2024 Asia Pacific

    Major Players

    <p>BASF SE (DE), Huntsman Corporation (US), Clariant AG (CH), Dow Inc. (US), SABIC (SA), Solvay SA (BE), AkzoNobel N.V. (NL), Eastman Chemical Company (US), Nouryon (NL)</p>

    Market Trends

    The Octylphenol Ethoxylate Market is currently experiencing a dynamic phase characterized by evolving consumer preferences and regulatory frameworks. This market, which encompasses a range of applications including surfactants and emulsifiers, appears to be influenced by increasing environmental awareness and the push for sustainable alternatives. As industries seek to reduce their ecological footprint, the demand for bio-based and biodegradable products is likely to rise, prompting manufacturers to innovate and adapt their offerings. Furthermore, the ongoing advancements in chemical processing technologies may enhance production efficiency, thereby impacting pricing strategies and market accessibility. In addition, the Octylphenol Ethoxylate Market is witnessing a shift towards more stringent regulations concerning chemical safety and environmental impact. This regulatory landscape could compel companies to invest in research and development to ensure compliance while also meeting consumer expectations for safer products. As a result, the market may see a diversification of product lines, catering to both traditional and emerging sectors. Overall, the interplay between regulatory pressures and market demands suggests a complex yet promising future for the Octylphenol Ethoxylate Market, where adaptability and innovation will be key drivers of success.

    Sustainability Initiatives

    The Octylphenol Ethoxylate Market is increasingly influenced by sustainability initiatives. Companies are exploring eco-friendly alternatives to traditional products, driven by consumer demand for greener solutions. This trend may lead to the development of bio-based ethoxylates, which could align with global efforts to reduce environmental impact.

    Technological Advancements

    Technological advancements in production processes are shaping the Octylphenol Ethoxylate Market. Innovations in chemical synthesis and processing techniques may enhance efficiency and reduce costs. This evolution could enable manufacturers to offer competitive pricing while maintaining product quality.

    Regulatory Compliance

    The regulatory landscape surrounding the Octylphenol Ethoxylate Market is becoming increasingly stringent. Companies are likely to face pressure to comply with new safety and environmental regulations. This trend may drive investment in research and development, as firms seek to create safer and more compliant products.

    Octylphenol Ethoxylate Market Market Drivers

    Increasing Regulatory Scrutiny

    The Octylphenol Ethoxylate Market faces increasing regulatory scrutiny, which is shaping market dynamics. Governments and regulatory bodies are implementing stricter guidelines regarding the use of chemicals in various applications, particularly in personal care and agricultural sectors. This heightened focus on safety and environmental impact is prompting manufacturers to reformulate products and seek alternatives to octylphenol ethoxylates. While this may pose challenges, it also presents opportunities for innovation and the development of safer, more sustainable alternatives. Market analysts suggest that companies that proactively adapt to these regulatory changes may gain a competitive edge, thereby influencing the overall trajectory of the Octylphenol Ethoxylate Market in the coming years.

    Growth in Agricultural Applications

    The Octylphenol Ethoxylate Market is witnessing growth driven by its increasing utilization in agricultural applications. These compounds serve as effective surfactants in pesticide formulations, enhancing the dispersion and adhesion of active ingredients on plant surfaces. As the agricultural sector seeks to improve crop yields and pest management strategies, the demand for octylphenol ethoxylates is expected to rise. Recent market analyses suggest that the agricultural segment could represent a substantial portion of the overall market, with an anticipated growth rate of around 5% over the next few years. This trend underscores the importance of octylphenol ethoxylates in modern agricultural practices, positioning the Octylphenol Ethoxylate Market as a key player in supporting sustainable farming initiatives.

    Expansion of Industrial Applications

    The Octylphenol Ethoxylate Market is significantly influenced by the expansion of industrial applications. These compounds are widely used in various sectors, including textiles, coatings, and plastics, due to their excellent wetting and dispersing properties. The textile industry, in particular, relies on octylphenol ethoxylates for dyeing and finishing processes, which enhance color retention and fabric quality. Market data indicates that the industrial segment is projected to grow at a rate of approximately 6% annually, driven by increasing production capacities and the demand for high-performance materials. This expansion not only highlights the versatility of octylphenol ethoxylates but also reinforces their critical role in the Octylphenol Ethoxylate Market, as manufacturers seek to optimize processes and improve product performance.

    Rising Demand in Personal Care Products

    The Octylphenol Ethoxylate Market experiences a notable surge in demand due to its application in personal care products. As consumers increasingly prioritize high-quality formulations, manufacturers are incorporating octylphenol ethoxylates for their emulsifying and surfactant properties. This trend is particularly evident in the production of shampoos, lotions, and creams, where octylphenol ethoxylates enhance texture and stability. Market data indicates that the personal care segment accounts for a significant share of the overall octylphenol ethoxylate consumption, with projections suggesting a steady growth rate of approximately 4% annually. This rising demand is likely to drive innovation and product development within the Octylphenol Ethoxylate Market, as companies strive to meet consumer expectations for effective and safe personal care solutions.

    Technological Innovations in Production

    Technological innovations in the production of octylphenol ethoxylates are emerging as a key driver for the Octylphenol Ethoxylate Market. Advances in manufacturing processes, such as the development of more efficient catalysts and reaction conditions, are enhancing the yield and purity of these compounds. Furthermore, the adoption of green chemistry principles is gaining traction, leading to the formulation of more sustainable production methods. These innovations not only improve the economic viability of octylphenol ethoxylates but also align with the growing demand for environmentally friendly products. Market forecasts suggest that these technological advancements could contribute to a reduction in production costs by up to 10%, thereby stimulating growth within the Octylphenol Ethoxylate Market and attracting new entrants.

    Market Segment Insights

    Regional Insights

    North America : Innovation and Demand Growth

    The North American market for Octylphenol Ethoxylate Market is driven by increasing demand in various applications, particularly in the agricultural and industrial sectors. The region holds approximately 35% of the global market share, making it the largest market. Regulatory support for sustainable chemicals and innovations in formulations are key growth catalysts. The demand for eco-friendly products is also on the rise, further propelling market growth. The United States is the leading country in this region, with significant contributions from Canada and Mexico. Major players like BASF SE, Huntsman Corporation, and Dow Inc. dominate the competitive landscape, focusing on product innovation and sustainability. The presence of these key players ensures a robust supply chain and enhances market dynamics, positioning North America as a leader in the Octylphenol Ethoxylate Market.

    Europe : Regulatory Framework and Innovation

    Europe is characterized by stringent regulations and a strong commitment to sustainability, which significantly influence the Octylphenol Ethoxylate Market. The region accounts for approximately 30% of the global market share, making it the second-largest market. The European Union's REACH regulations promote the use of safer chemicals, driving demand for innovative and eco-friendly alternatives. This regulatory framework is a key driver for market growth in the region. Germany, France, and the UK are the leading countries in this market, with a competitive landscape featuring key players like Clariant AG and Solvay SA. The focus on research and development, along with collaboration between industry and academia, fosters innovation. The presence of major chemical companies ensures a steady supply of Octylphenol Ethoxylate Market, catering to various industrial applications. The commitment to sustainability is reshaping the market dynamics in Europe.

    Asia-Pacific : Emerging Markets and Growth Potential

    The Asia-Pacific region is witnessing rapid growth in the Octylphenol Ethoxylate Market, driven by increasing industrialization and urbanization. This region holds approximately 25% of the global market share, with countries like China and India leading the demand. The growing agricultural sector and rising consumer awareness regarding eco-friendly products are significant growth drivers. Additionally, favorable government policies and investments in chemical manufacturing are expected to further boost market growth. China is the largest market in the region, followed by India and Japan. The competitive landscape is marked by the presence of key players such as AkzoNobel N.V. and Eastman Chemical Company. These companies are focusing on expanding their production capacities and enhancing product offerings to meet the growing demand. The Asia-Pacific market is characterized by a mix of established players and emerging companies, creating a dynamic competitive environment.

    Middle East and Africa : Resource-Rich and Growing Demand

    The Middle East and Africa region is gradually emerging as a significant market for Octylphenol Ethoxylate Market, driven by increasing industrial activities and a growing demand for chemical products. This region holds approximately 10% of the global market share. The growth is supported by investments in infrastructure and manufacturing, particularly in countries like Saudi Arabia and South Africa. The region's rich natural resources also provide a competitive advantage in chemical production. Saudi Arabia is the leading country in this market, with substantial contributions from South Africa and the UAE. The competitive landscape features both local and international players, including SABIC and Nouryon. These companies are focusing on expanding their market presence and enhancing product offerings to cater to the growing demand. The Middle East and Africa are poised for significant growth in the Octylphenol Ethoxylate Market, driven by favorable economic conditions and increasing industrialization.

    Key Companies in the Octylphenol Ethoxylate Market market include

    Industry Developments

    Future Outlook

    Octylphenol Ethoxylate Market Future Outlook

    <p>The Octylphenol Ethoxylate Market is projected to grow at a 3.59% CAGR from 2024 to 2035, driven by increasing demand in industrial applications and eco-friendly formulations.</p>

    New opportunities lie in:

    • <p>Expansion into biodegradable surfactants for sustainable product lines.</p>
    • <p>Development of customized formulations for niche industrial applications.</p>
    • <p>Strategic partnerships with key players in the agricultural sector for enhanced product distribution.</p>

    <p>By 2035, the market is expected to solidify its position as a key player in specialty chemicals.</p>

    Market Segmentation

    Octylphenol Ethoxylate Market End User Outlook

    • Textiles
    • Agriculture
    • Pulp & Paper
    • Pharmaceutical
    • Oilfield
    • Personal Care
    • Paint & Coatings
    • Plastics
    • Others

    Octylphenol Ethoxylate Market Application Outlook

    • Detergents
    • Defoaming agents
    • Dispersants
    • Stabilizer
    • Adhesive
    • Cleaners
    • Others

    Report Scope

    MARKET SIZE 202413.46(USD Billion)
    MARKET SIZE 202513.94(USD Billion)
    MARKET SIZE 203519.84(USD Billion)
    COMPOUND ANNUAL GROWTH RATE (CAGR)3.59% (2024 - 2035)
    REPORT COVERAGERevenue Forecast, Competitive Landscape, Growth Factors, and Trends
    BASE YEAR2024
    Market Forecast Period2025 - 2035
    Historical Data2019 - 2024
    Market Forecast UnitsUSD Billion
    Key Companies ProfiledMarket analysis in progress
    Segments CoveredMarket segmentation analysis in progress
    Key Market OpportunitiesGrowing demand for eco-friendly surfactants drives innovation in the Octylphenol Ethoxylate Market.
    Key Market DynamicsRising regulatory scrutiny and shifting consumer preferences drive innovation in the Octylphenol Ethoxylate Market.
    Countries CoveredNorth America, Europe, APAC, South America, MEA

    FAQs

    What is the projected market valuation of the Octylphenol Ethoxylate Market by 2035?

    The projected market valuation of the Octylphenol Ethoxylate Market is expected to reach 19.84 USD Billion by 2035.

    What was the market valuation of the Octylphenol Ethoxylate Market in 2024?

    The market valuation of the Octylphenol Ethoxylate Market was 13.46 USD Billion in 2024.

    What is the expected CAGR for the Octylphenol Ethoxylate Market during the forecast period 2025 - 2035?

    The expected CAGR for the Octylphenol Ethoxylate Market during the forecast period 2025 - 2035 is 3.59%.

    1. SECTION I: EXECUTIVE SUMMARY AND KEY HIGHLIGHTS
      1. EXECUTIVE SUMMARY
        1. Market Overview
        2. Key Findings
        3. Market Segmentation
        4. Competitive Landscape
        5. Challenges and Opportunities
        6. Future Outlook
    2. SECTION II: SCOPING, METHODOLOGY AND MARKET STRUCTURE
      1. MARKET INTRODUCTION
        1. Definition
        2. Scope of the study
      2. RESEARCH METHODOLOGY
        1. Overview
        2. Data Mining
        3. Secondary Research
        4. Primary Research
        5. Forecasting Model
        6. Market Size Estimation
        7. Data Triangulation
        8. Validation
    3. SECTION III: QUALITATIVE ANALYSIS
      1. MARKET DYNAMICS
        1. Overview
        2. Drivers
        3. Restraints
        4. Opportunities
      2. MARKET FACTOR ANALYSIS
        1. Value chain Analysis
        2. Porter's Five Forces Analysis
        3. COVID-19 Impact Analysis
    4. SECTION IV: QUANTITATIVE ANALYSIS
      1. Chemicals and Materials, BY Application (USD Billion)
        1. Detergents
        2. Defoaming agents
        3. Dispersants
        4. Stabilizer
        5. Adhesive
        6. Cleaners
        7. Others
      2. Chemicals and Materials, BY End User (USD Billion)
        1. Textiles
        2. Agriculture
        3. Pulp & Paper
        4. Pharmaceutical
        5. Oilfield
        6. Personal Care
        7. Paint & Coatings
        8. Plastics
        9. Others
      3. Chemicals and Materials, BY Region (USD Billion)
        1. North America
        2. Europe
        3. APAC
        4. South America
        5. MEA
    5. SECTION V: COMPETITIVE ANALYSIS
      1. Competitive Landscape
        1. Overview
        2. Competitive Analysis
        3. Market share Analysis
        4. Major Growth Strategy in the Chemicals and Materials
        5. Competitive Benchmarking
        6. Leading Players in Terms of Number of Developments in the Chemicals and Materials
        7. Key developments and growth strategies
        8. Major Players Financial Matrix
      2. Company Profiles
        1. BASF SE (DE)
        2. Huntsman Corporation (US)
        3. Clariant AG (CH)
        4. Dow Inc. (US)
        5. SABIC (SA)
        6. Solvay SA (BE)
        7. AkzoNobel N.V. (NL)
        8. Eastman Chemical Company (US)
        9. Nouryon (NL)
      3. Appendix
        1. References
        2. Related Reports
    6. LIST OF FIGURES
      1. MARKET SYNOPSIS
      2. NORTH AMERICA MARKET ANALYSIS
      3. US MARKET ANALYSIS BY APPLICATION
      4. US MARKET ANALYSIS BY END USER
      5. CANADA MARKET ANALYSIS BY APPLICATION
      6. CANADA MARKET ANALYSIS BY END USER
      7. EUROPE MARKET ANALYSIS
      8. GERMANY MARKET ANALYSIS BY APPLICATION
      9. GERMANY MARKET ANALYSIS BY END USER
      10. UK MARKET ANALYSIS BY APPLICATION
      11. UK MARKET ANALYSIS BY END USER
      12. FRANCE MARKET ANALYSIS BY APPLICATION
      13. FRANCE MARKET ANALYSIS BY END USER
      14. RUSSIA MARKET ANALYSIS BY APPLICATION
      15. RUSSIA MARKET ANALYSIS BY END USER
      16. ITALY MARKET ANALYSIS BY APPLICATION
      17. ITALY MARKET ANALYSIS BY END USER
      18. SPAIN MARKET ANALYSIS BY APPLICATION
      19. SPAIN MARKET ANALYSIS BY END USER
      20. REST OF EUROPE MARKET ANALYSIS BY APPLICATION
      21. REST OF EUROPE MARKET ANALYSIS BY END USER
      22. APAC MARKET ANALYSIS
      23. CHINA MARKET ANALYSIS BY APPLICATION
      24. CHINA MARKET ANALYSIS BY END USER
      25. INDIA MARKET ANALYSIS BY APPLICATION
      26. INDIA MARKET ANALYSIS BY END USER
      27. JAPAN MARKET ANALYSIS BY APPLICATION
      28. JAPAN MARKET ANALYSIS BY END USER
      29. SOUTH KOREA MARKET ANALYSIS BY APPLICATION
      30. SOUTH KOREA MARKET ANALYSIS BY END USER
      31. MALAYSIA MARKET ANALYSIS BY APPLICATION
      32. MALAYSIA MARKET ANALYSIS BY END USER
      33. THAILAND MARKET ANALYSIS BY APPLICATION
      34. THAILAND MARKET ANALYSIS BY END USER
      35. INDONESIA MARKET ANALYSIS BY APPLICATION
      36. INDONESIA MARKET ANALYSIS BY END USER
      37. REST OF APAC MARKET ANALYSIS BY APPLICATION
      38. REST OF APAC MARKET ANALYSIS BY END USER
      39. SOUTH AMERICA MARKET ANALYSIS
      40. BRAZIL MARKET ANALYSIS BY APPLICATION
      41. BRAZIL MARKET ANALYSIS BY END USER
      42. MEXICO MARKET ANALYSIS BY APPLICATION
      43. MEXICO MARKET ANALYSIS BY END USER
      44. ARGENTINA MARKET ANALYSIS BY APPLICATION
      45. ARGENTINA MARKET ANALYSIS BY END USER
      46. REST OF SOUTH AMERICA MARKET ANALYSIS BY APPLICATION
      47. REST OF SOUTH AMERICA MARKET ANALYSIS BY END USER
      48. MEA MARKET ANALYSIS
      49. GCC COUNTRIES MARKET ANALYSIS BY APPLICATION
      50. GCC COUNTRIES MARKET ANALYSIS BY END USER
      51. SOUTH AFRICA MARKET ANALYSIS BY APPLICATION
      52. SOUTH AFRICA MARKET ANALYSIS BY END USER
      53. REST OF MEA MARKET ANALYSIS BY APPLICATION
      54. REST OF MEA MARKET ANALYSIS BY END USER
      55. KEY BUYING CRITERIA OF CHEMICALS AND MATERIALS
      56. RESEARCH PROCESS OF MRFR
      57. DRO ANALYSIS OF CHEMICALS AND MATERIALS
      58. DRIVERS IMPACT ANALYSIS: CHEMICALS AND MATERIALS
      59. RESTRAINTS IMPACT ANALYSIS: CHEMICALS AND MATERIALS
      60. SUPPLY / VALUE CHAIN: CHEMICALS AND MATERIALS
      61. CHEMICALS AND MATERIALS, BY APPLICATION, 2024 (% SHARE)
      62. CHEMICALS AND MATERIALS, BY APPLICATION, 2024 TO 2035 (USD Billion)
      63. CHEMICALS AND MATERIALS, BY END USER, 2024 (% SHARE)
      64. CHEMICALS AND MATERIALS, BY END USER, 2024 TO 2035 (USD Billion)
      65. BENCHMARKING OF MAJOR COMPETITORS
    7. LIST OF TABLES
      1. LIST OF ASSUMPTIONS
      2. North America MARKET SIZE ESTIMATES; FORECAST
        1. BY APPLICATION, 2025-2035 (USD Billion)
        2. BY END USER, 2025-2035 (USD Billion)
      3. US MARKET SIZE ESTIMATES; FORECAST
        1. BY APPLICATION, 2025-2035 (USD Billion)
        2. BY END USER, 2025-2035 (USD Billion)
      4. Canada MARKET SIZE ESTIMATES; FORECAST
        1. BY APPLICATION, 2025-2035 (USD Billion)
        2. BY END USER, 2025-2035 (USD Billion)
      5. Europe MARKET SIZE ESTIMATES; FORECAST
        1. BY APPLICATION, 2025-2035 (USD Billion)
        2. BY END USER, 2025-2035 (USD Billion)
      6. Germany MARKET SIZE ESTIMATES; FORECAST
        1. BY APPLICATION, 2025-2035 (USD Billion)
        2. BY END USER, 2025-2035 (USD Billion)
      7. UK MARKET SIZE ESTIMATES; FORECAST
        1. BY APPLICATION, 2025-2035 (USD Billion)
        2. BY END USER, 2025-2035 (USD Billion)
      8. France MARKET SIZE ESTIMATES; FORECAST
        1. BY APPLICATION, 2025-2035 (USD Billion)
        2. BY END USER, 2025-2035 (USD Billion)
      9. Russia MARKET SIZE ESTIMATES; FORECAST
        1. BY APPLICATION, 2025-2035 (USD Billion)
        2. BY END USER, 2025-2035 (USD Billion)
      10. Italy MARKET SIZE ESTIMATES; FORECAST
        1. BY APPLICATION, 2025-2035 (USD Billion)
        2. BY END USER, 2025-2035 (USD Billion)
      11. Spain MARKET SIZE ESTIMATES; FORECAST
        1. BY APPLICATION, 2025-2035 (USD Billion)
        2. BY END USER, 2025-2035 (USD Billion)
      12. Rest of Europe MARKET SIZE ESTIMATES; FORECAST
        1. BY APPLICATION, 2025-2035 (USD Billion)
        2. BY END USER, 2025-2035 (USD Billion)
      13. APAC MARKET SIZE ESTIMATES; FORECAST
        1. BY APPLICATION, 2025-2035 (USD Billion)
        2. BY END USER, 2025-2035 (USD Billion)
      14. China MARKET SIZE ESTIMATES; FORECAST
        1. BY APPLICATION, 2025-2035 (USD Billion)
        2. BY END USER, 2025-2035 (USD Billion)
      15. India MARKET SIZE ESTIMATES; FORECAST
        1. BY APPLICATION, 2025-2035 (USD Billion)
        2. BY END USER, 2025-2035 (USD Billion)
      16. Japan MARKET SIZE ESTIMATES; FORECAST
        1. BY APPLICATION, 2025-2035 (USD Billion)
        2. BY END USER, 2025-2035 (USD Billion)
      17. South Korea MARKET SIZE ESTIMATES; FORECAST
        1. BY APPLICATION, 2025-2035 (USD Billion)
        2. BY END USER, 2025-2035 (USD Billion)
      18. Malaysia MARKET SIZE ESTIMATES; FORECAST
        1. BY APPLICATION, 2025-2035 (USD Billion)
        2. BY END USER, 2025-2035 (USD Billion)
      19. Thailand MARKET SIZE ESTIMATES; FORECAST
        1. BY APPLICATION, 2025-2035 (USD Billion)
        2. BY END USER, 2025-2035 (USD Billion)
      20. Indonesia MARKET SIZE ESTIMATES; FORECAST
        1. BY APPLICATION, 2025-2035 (USD Billion)
        2. BY END USER, 2025-2035 (USD Billion)
      21. Rest of APAC MARKET SIZE ESTIMATES; FORECAST
        1. BY APPLICATION, 2025-2035 (USD Billion)
        2. BY END USER, 2025-2035 (USD Billion)
      22. South America MARKET SIZE ESTIMATES; FORECAST
        1. BY APPLICATION, 2025-2035 (USD Billion)
        2. BY END USER, 2025-2035 (USD Billion)
      23. Brazil MARKET SIZE ESTIMATES; FORECAST
        1. BY APPLICATION, 2025-2035 (USD Billion)
        2. BY END USER, 2025-2035 (USD Billion)
      24. Mexico MARKET SIZE ESTIMATES; FORECAST
        1. BY APPLICATION, 2025-2035 (USD Billion)
        2. BY END USER, 2025-2035 (USD Billion)
      25. Argentina MARKET SIZE ESTIMATES; FORECAST
        1. BY APPLICATION, 2025-2035 (USD Billion)
        2. BY END USER, 2025-2035 (USD Billion)
      26. Rest of South America MARKET SIZE ESTIMATES; FORECAST
        1. BY APPLICATION, 2025-2035 (USD Billion)
        2. BY END USER, 2025-2035 (USD Billion)
      27. MEA MARKET SIZE ESTIMATES; FORECAST
        1. BY APPLICATION, 2025-2035 (USD Billion)
        2. BY END USER, 2025-2035 (USD Billion)
      28. GCC Countries MARKET SIZE ESTIMATES; FORECAST
        1. BY APPLICATION, 2025-2035 (USD Billion)
        2. BY END USER, 2025-2035 (USD Billion)
      29. South Africa MARKET SIZE ESTIMATES; FORECAST
        1. BY APPLICATION, 2025-2035 (USD Billion)
        2. BY END USER, 2025-2035 (USD Billion)
      30. Rest of MEA MARKET SIZE ESTIMATES; FORECAST
        1. BY APPLICATION, 2025-2035 (USD Billion)
        2. BY END USER, 2025-2035 (USD Billion)
      31. PRODUCT LAUNCH/PRODUCT DEVELOPMENT/APPROVAL
      32. ACQUISITION/PARTNERSHIP

    Octylphenol Ethoxylate Market Segmentation

    Market Segmentation Overview

    • Detailed segmentation data will be available in the full report
    • Comprehensive analysis by multiple parameters
    • Regional and country-level breakdowns
    • Market size forecasts by segment
    Infographic

    Free Sample Request

    Kindly complete the form below to receive a free sample of this Report

    Get Free Sample

    Customer Strories

    “I am very pleased with how market segments have been defined in a relevant way for my purposes (such as "Portable Freezers & refrigerators" and "last-mile"). In general the report is well structured. Thanks very much for your efforts.”

    Victoria Milne

    Founder

    Compare Licence

    ×
    Features License Type
    Single User Multiuser License Enterprise User
    Price $4,950 $5,950 $7,250
    Maximum User Access Limit 1 User Upto 10 Users Unrestricted Access Throughout the Organization
    Free Customization
    Direct Access to Analyst
    Deliverable Format
    Platform Access
    Discount on Next Purchase 10% 15% 15%
    Printable Versions