×
Hero Background
English
Chinese
French
Japanese
Korean
German
Spanish

Optical position sensor Market Analysis

ID: MRFR/SEM/5988-HCR
100 Pages
Shubham Munde
October 2025

Optical position sensor Market Research Report Information By Type (Linear Position Sensors, Rotary Position Sensors), By Contract Type (Non-Contact Type, Contact Type), By Output (Digital Output, Analog Output), By Application (Machine Tools, Robotics, Motion Systems, Material Handling, Test Equipment, Others {Inspection Systems and Measurement}), By End-user (Manufacturing, Automotive, Aerospace, Packaging, Healthcare, Electronics, Others), And By Region (North America, Europe, Asia-Pacific & Rest Of The World) – Industry Forecast 2032

Share:
Download PDF ×

We do not share your information with anyone. However, we may send you emails based on your report interest from time to time. You may contact us at any time to opt-out.

Optical position sensor Market Infographic
Purchase Options

Market Analysis

In-depth Analysis of Optical position sensor Market Industry Landscape

The Optical Position Sensor Market is characterized by dynamic and multifaceted market dynamics that influence its growth and evolution. One of the key driving forces is the relentless technological advancements in sensor technology. With automation and precision taking precedence across industries, there is a never-ending requirement for optical position sensors that can deliver better accuracy in addition to faster response times with more reliability. Continuous technological evolution dictates innovation, making producers manufacture advanced sensors that respond to changing needs of various applications.

Another crucial factor affecting market dynamics is the increasing variety of applications for optical position sensors. They are used in automotive, aerospace healthcare sectors of consumer electronics and industrial automation. Optical position sensors display great versatility leading them to become essential constituents of many varieties of devices that support continued market development. In turn, the growing introduction of these sensors into upcoming technologies such as robotics and autonomous cars drives market dynamics to open new challenges for industry players.

In addition, global focus on energy optimization and sustainability contributes greatly to the market dynamics. Optical position sensors, through a non-contact sensing mechanism, have several advantages when compared to conventional contact based sensor types which include improved energy efficiency contamination and radiation resistance. With the increased realization of environmental concerns for both consumers and industries, eco-friendliness becomes a major factor that affects market dynamics; hence manufacturers emphasize on green sensor technologies.

The regulatory landscape also impacts the dynamics of market. Industry standards and regulations follow, particularly in safety-sensitive sectors such as the automotive and aerospace industry. The continuous development of standards and the introduction of new standards affect product manufacturing processes, as well as market entry strategies. Compliance with these standards is not just a legal necessity but also helps the company win consumers’ trust and thus gain an advantage over rivals.

In contrast, market dynamics have problems like the cost restrictions. The manufacturers have to find a balance between providing budget-friendly solutions and retaining profitability in their market, which is highly competitive at times. Cost-saving manufacturing methods, mass production and supply chain optimization emerge as determining factors for solving these problems.

In addition, macroeconomic factors and geopolitics play a significant role in the volatility of market dynamics. Economic slowdowns and concerns about the stability of foreign trade may affect the global demand for optical position sensors.

The market dynamics are highly influenced by the new market entrants and competition. As more players enter the optical position sensor market, competition intensifies. Established companies must continuously innovate to maintain their market share, while new entrants strive to differentiate themselves through disruptive technologies or unique value propositions. Mergers, acquisitions, and strategic alliances become strategic tools for companies looking to strengthen their position in the market.

Author
Shubham Munde
Research Analyst Level II

With a technical background in information technology & semiconductors, Shubham has 4.5+ years of experience in market research and analytics with the tasks of data mining, analysis, and project execution. He is the POC for our clients, for their consulting projects running under the ICT/Semiconductor domain. Shubham holds a Bachelor’s in Information and Technology and a Master of Business Administration (MBA). Shubham has executed over 150 research projects for our clients under the brand name Market Research Future in the last 2 years. His core skill is building the research respondent relation for gathering the primary information from industry and market estimation for niche markets. He is having expertise in conducting secondary & primary research, market estimations, market projections, competitive analysis, analysing current market trends and market dynamics, deep-dive analysis on market scenarios, consumer behaviour, technological impact analysis, consulting, analytics, etc. He has worked on fortune 500 companies' syndicate and consulting projects along with several government projects. He has worked on the projects of top tech brands such as IBM, Google, Microsoft, AWS, Meta, Oracle, Cisco Systems, Samsung, Accenture, VMware, Schneider Electric, Dell, HP, Ericsson, and so many others. He has worked on Metaverse, Web 3.0, Zero-Trust security, cyber-security, blockchain, quantum computing, robotics, 5G technology, High-Performance computing, data centers, AI, automation, IT equipment, sensors, semiconductors, consumer electronics and so many tech domain projects.

Leave a Comment

FAQs

What is the projected market valuation for the Optical Position Sensor Market in 2035?

The Optical Position Sensor Market is projected to reach a valuation of 6.163 USD Billion by 2035.

What was the market valuation for the Optical Position Sensor Market in 2024?

In 2024, the Optical Position Sensor Market was valued at 2.111 USD Billion.

What is the expected CAGR for the Optical Position Sensor Market during the forecast period 2025 - 2035?

The expected CAGR for the Optical Position Sensor Market during the forecast period 2025 - 2035 is 10.23%.

Which companies are considered key players in the Optical Position Sensor Market?

Key players in the Optical Position Sensor Market include Honeywell, Omron, Texas Instruments, and STMicroelectronics.

What are the two main types of position sensors in the market, and how do they compare in valuation?

Linear Position Sensors were valued at 0.845 USD Billion in 2024, while Rotary Position Sensors had a valuation of 1.266 USD Billion.

How do the contact and non-contact types of optical position sensors compare in terms of market valuation?

In 2024, the Non-Contact Type was valued at 1.055 USD Billion, whereas the Contact Type had a valuation of 1.056 USD Billion.

Market Summary

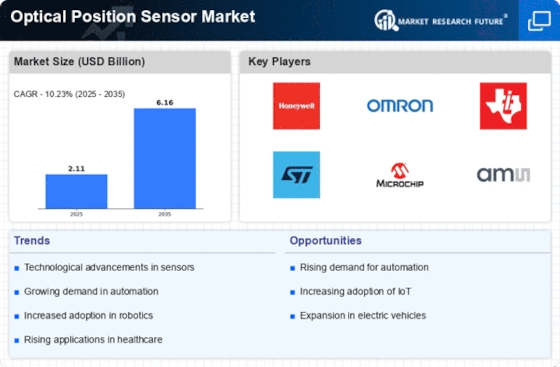
As per MRFR analysis, the Optical Position Sensor Market Size was estimated at 2.111 USD Billion in 2024. The Optical Position Sensor industry is projected to grow from 2.326 USD Billion in 2025 to 6.163 USD Billion by 2035, exhibiting a compound annual growth rate (CAGR) of 10.23 during the forecast period 2025 - 2035.

Key Market Trends & Highlights

The Optical Position Sensor Market is experiencing robust growth driven by technological advancements and increasing applications across various sectors.

  • The market is witnessing a notable integration of optical position sensors in automation processes, particularly in North America. Miniaturization of components is becoming a prevalent trend, enhancing the functionality of linear position sensors, which remain the largest segment. Energy efficiency is a growing focus, especially in the Asia-Pacific region, where rotary position sensors are rapidly gaining traction. Rising demand in robotics and expansion in automotive applications are key drivers propelling market growth.

Market Size & Forecast

2024 Market Size 2.111 (USD Billion)
2035 Market Size 6.163 (USD Billion)
CAGR (2025 - 2035) 10.23%
Largest Regional Market Share in 2024 North America

Major Players

<p>Honeywell (US), Omron (JP), Texas Instruments (US), STMicroelectronics (CH), Microchip Technology (US), ams AG (AT), Renesas Electronics (JP), Broadcom Inc. (US), Infineon Technologies (DE)</p>

Market Trends

The Optical Position Sensor Market is currently experiencing a notable evolution, driven by advancements in technology and increasing demand across various sectors. The integration of optical position sensors in automation and robotics is particularly prominent, as industries seek to enhance precision and efficiency in their operations. Furthermore, the growing trend towards miniaturization of electronic components is likely to propel the adoption of these sensors in compact devices, thereby expanding their application range. As industries continue to embrace smart technologies, the Optical Position Sensor Market appears poised for substantial growth, with innovations in sensor design and functionality playing a crucial role in shaping its future. In addition, the rising emphasis on energy efficiency and sustainability is influencing the development of optical position sensors. Manufacturers are increasingly focusing on creating sensors that not only meet performance standards but also contribute to reducing energy consumption. This shift towards eco-friendly solutions may lead to the emergence of new market players and technologies, fostering a competitive landscape. Overall, the Optical Position Sensor Market is on a trajectory of transformation, characterized by technological advancements and a growing awareness of environmental considerations, which could redefine its dynamics in the coming years.

Integration in Automation

The Optical Position Sensor Market is witnessing a surge in the integration of sensors within automation systems. This trend is driven by the need for enhanced accuracy and reliability in industrial processes. As industries adopt smart manufacturing practices, the demand for precise position sensing solutions is likely to increase, facilitating improved operational efficiency.

Miniaturization of Components

Another notable trend is the miniaturization of optical position sensors, which allows for their incorporation into smaller devices. This development is particularly relevant in consumer electronics and medical applications, where space constraints are prevalent. The ability to produce compact sensors may lead to broader adoption across various sectors.

Focus on Energy Efficiency

The growing emphasis on energy efficiency is shaping the Optical Position Sensor Market. Manufacturers are increasingly developing sensors that not only perform effectively but also minimize energy consumption. This focus on sustainability may drive innovation and attract new entrants to the market, fostering a more competitive environment.

Optical position sensor Market Market Drivers

Rising Demand in Robotics

The Optical Position Sensor Market is experiencing a notable surge in demand due to the increasing integration of optical sensors in robotics applications. As industries adopt automation, the need for precise positioning and movement tracking becomes paramount. According to recent data, the robotics sector is projected to grow at a compound annual growth rate of over 20% in the coming years. This growth is likely to drive the adoption of optical position sensors, which offer high accuracy and reliability. Furthermore, advancements in sensor technology are enabling the development of more sophisticated robotic systems, which in turn fuels the demand for optical position sensors. The Optical Position Sensor Market is thus positioned to benefit significantly from this trend, as manufacturers seek to enhance the capabilities of their robotic solutions.

Growth in Consumer Electronics

The Optical Position Sensor Market is benefiting from the growth in consumer electronics, where the demand for precise positioning and touchless control is escalating. Devices such as smartphones, tablets, and smart home appliances increasingly incorporate optical position sensors to enhance user experience and functionality. Market analysis suggests that the consumer electronics segment is expected to grow at a rate of around 10% annually, driven by the rising trend of smart devices. This growth indicates a robust opportunity for the Optical Position Sensor Market, as manufacturers strive to integrate advanced sensing technologies into their products to meet consumer expectations for innovation and performance.

Expansion in Automotive Applications

The Optical Position Sensor Market is witnessing substantial growth driven by the expansion of automotive applications. With the automotive sector increasingly focusing on advanced driver-assistance systems (ADAS) and autonomous vehicles, the demand for precise positioning sensors is on the rise. Optical position sensors are integral to various automotive functions, including steering, braking, and throttle control. Market data indicates that the automotive segment is expected to account for a significant share of the optical position sensor market, with a projected growth rate of approximately 15% annually. This trend suggests that as vehicles become more automated and connected, the reliance on optical position sensors will intensify, thereby propelling the Optical Position Sensor Market forward.

Increased Focus on Industrial Automation

The Optical Position Sensor Market is significantly influenced by the increased focus on industrial automation across various sectors. As manufacturers seek to enhance productivity and reduce operational costs, the adoption of automation technologies is becoming more prevalent. Optical position sensors are essential for ensuring accurate positioning in automated systems, which include assembly lines and material handling equipment. Recent statistics indicate that the industrial automation market is projected to grow at a compound annual growth rate of approximately 12%. This trend suggests that the Optical Position Sensor Market will likely experience substantial growth as industries invest in automation solutions that require reliable and precise positioning capabilities.

Technological Advancements in Sensor Design

Technological advancements in sensor design are playing a crucial role in shaping the Optical Position Sensor Market. Innovations such as improved light source technologies and enhanced signal processing algorithms are leading to the development of more efficient and accurate optical position sensors. These advancements not only improve performance but also reduce the size and cost of sensors, making them more accessible to a wider range of applications. As industries seek to optimize their operations, the demand for high-performance optical position sensors is likely to increase. The Optical Position Sensor Market stands to gain from these technological improvements, as they enable manufacturers to offer more competitive products that meet the evolving needs of various sectors.

Market Segment Insights

Optical position sensor Market Type Insights

<p>The Optical position sensor Market segmentation, based on type includes Linear Position Sensors, Rotary Position Sensors. Rotary position sensors are the most common type of optical position sensors. Rotary position sensors detect an object's angular position and are extensively employed in applications such as automotive steering systems, robotics, and <a href="https://www.marketresearchfuture.com/reports/factory-industrial-automation-sme-smb-market-34181">industrial automation</a>. These sensors are known for their great accuracy and dependability, and they are becoming increasingly vital as more sectors implement automation and robotics technology.</p>

Optical position sensor Market Contract Type Insights

<p>The Optical position sensor Market segmentation, based on Contract Type, includes Non-Contact Type, Contact Type. One of the fastest-growing categories of the Optical Position Sensor Market is the non-contract segment. This category comprises sensors that are sold without a long-term commitment, giving clients additional flexibility and affordability. Small and medium-sized enterprises, which may lack the resources to invest in long-term contracts, are particularly fond of the non-contract segment.</p>

<p>Source: Secondary Research, Primary Research, MRFR Database and Analyst Review</p>

Optical position sensor Market Output Insights

<p>The Optical position sensor Market is divided into two output segments: digital output and analogue output. During the predicted period, the digital output is expected to increase quicker. Because digital optical sensors provide greater reliability, energy efficiency, performance, ease of design, and compactness, their demand is likely to rise in the future years.</p>

Optical position sensor Market Application Insights

<p>Machine Tools, Robotics, Motion Systems, Material Handling, Test Equipment, and Others are the application segments of the Optical position sensor Market. The robotics category holds the biggest market share. Robotics is a prominent industry that uses optical position sensors, and demand for these sensors is developing rapidly as automation and robotics technologies become more widely used. Optical position sensors are utilized in a wide range of robotics applications, such as robotic arms, drones, and self-driving cars.</p>

Optical position sensor Market End-User Insights

<p>Manufacturing, Automotive, Aerospace, Packaging, Healthcare, Electronics, and Others are the end-user segments of the Optical position sensor Market. During the forecast period, the automotive industry is predicted to grow at the fastest rate. One of the primary reasons for the increase in the market for optical sensors in the automotive sector is that they are utilized in a variety of camera-enabled systems such as autonomous driving, improved safety systems, and in-vehicle infotainment (IVI) systems, among others. These sensors include capabilities like 3D gesture recognition, vehicle-to-everything (V2X) connectivity, and interior lighting control applications, among others.</p>

Get more detailed insights about Optical position sensor Market Research Report – Global Forecast till 2035

Regional Insights

North America : Technological Innovation Leader

North America is the largest market for optical position sensors, holding approximately 40% of the global market share. The region's growth is driven by advancements in automation, increasing demand for smart devices, and stringent regulatory standards promoting safety and efficiency. The presence of major technology firms and a robust manufacturing base further catalyze market expansion. The United States leads the market, followed by Canada, with significant contributions from key players like Honeywell, Texas Instruments, and Broadcom. The competitive landscape is characterized by continuous innovation and strategic partnerships, enhancing product offerings and market reach. The focus on IoT and smart manufacturing is expected to drive further growth in the coming years.

Europe : Regulatory Compliance Focus

Europe is the second-largest market for optical position sensors, accounting for around 30% of the global share. The region's growth is fueled by stringent regulations aimed at enhancing safety and efficiency in various industries, including automotive and industrial automation. The European Union's initiatives to promote smart technologies and sustainability are also significant drivers. Leading countries in this region include Germany, France, and the UK, with a strong presence of key players like Infineon Technologies and STMicroelectronics. The competitive landscape is marked by a focus on innovation, with companies investing heavily in R&D to meet regulatory standards and consumer demands. The emphasis on energy-efficient solutions is expected to shape market dynamics in the near future.

Asia-Pacific : Emerging Market Potential

Asia-Pacific is witnessing rapid growth in the optical position sensor market, holding approximately 25% of the global share. The region's expansion is driven by increasing industrial automation, rising consumer electronics demand, and government initiatives to boost manufacturing capabilities. Countries like China and India are at the forefront, with significant investments in technology and infrastructure. China is the largest market in the region, followed by Japan and India, with key players like Omron and Renesas Electronics leading the charge. The competitive landscape is evolving, with local manufacturers emerging alongside established global firms. The focus on smart cities and IoT applications is expected to further accelerate market growth in the coming years.

Middle East and Africa : Resource-Rich Opportunities

The Middle East and Africa region is gradually emerging in the optical position sensor market, holding about 5% of the global share. The growth is primarily driven by increasing investments in infrastructure, smart city projects, and the adoption of automation in various sectors. Countries like the UAE and South Africa are leading the way, with government initiatives aimed at enhancing technological capabilities. The competitive landscape is characterized by a mix of local and international players, with companies exploring opportunities in diverse sectors such as oil and gas, automotive, and consumer electronics. The region's unique challenges and opportunities present a dynamic environment for market growth, with a focus on innovation and sustainability expected to shape future trends.

Key Players and Competitive Insights

Leading market players are investing heavily in research and development in order to expand their product lines, which will help the Optical position sensor Market, grow even more. Market participants are also undertaking a variety of strategic activities to expand their global footprint, with important market developments including new product launches, contractual agreements, mergers and acquisitions, higher investments, and collaboration with other organizations. To expand and survive in a more competitive and rising market climate, Optical position sensor industry must offer cost-effective items.

Manufacturing locally to minimize operational costs is one of the key business tactics used by manufacturers in the global Optical position sensor industry to benefit clients and increase the market sector. In recent years, the Optical position sensor industry has offered some of the most significant advantages to medicine. Major players in the Optical position sensor Market, including Honeywell International, Inc. (US), Balluff GmbH (Germany), Sensata Technologies (US), Hamamastu Photonics K.K. (Japan), and Bourns Inc. (US) and others, are attempting to increase market demand by investing in research and development operations.

Sony Group Corporation is a Japanese multinational conglomerate headquartered in Minato, Tokyo. As a major technology corporation, it is one of the world's largest makers of consumer and professional electronic equipment, as well as the largest video game console manufacturer and publisher. It is one of the major music firms (largest music publisher and second largest record label) and the third largest film studio through Sony Entertainment, making it one of the most comprehensive media corporations.

Osram Opto Semiconductors GmbH, based in Regensburg, Germany, was a wholly owned subsidiary of Osram GmbH, the world's second largest maker of optoelectronic semiconductors after Nichia, with Cree Inc. coming in third. Osram and Infineon Technologies formed the company in 1999 as a joint venture. Osram Opto Semiconductors was acquired by AMS-Osram International GmbH in 2021 and is now part of the AMS Osram Group.

In April 2019, Osram Opto Semiconductors has stated that it would participate in a new project that will run through 2021 and will investigate the fundamentals of high-resolution visualization solutions employing LEDs (micro LEDs) and optical sensors. The Bavarian State Ministry for Economic Affairs, Regional Development, and Energy is funding the initiative, which began in November 2018. With an initial demonstrator, the project is planned to be finished in October 2021.  

Key Companies in the Optical position sensor Market market include

Industry Developments

June 2019, InGaAs, an area image sensor for hyperspectral cameras capable of detecting short-wavelength infrared light up to 2.55 m, was introduced by Hamamatsu Photonics. It has the world's longest detectable wavelength using this sort of area image sensor.

July 2020, Microsoft has submitted a patent for a'multidimesional'optical heart rate sensor, which could improve accuracy. The heart rate sensor is dubbed multidimensional because it may possibly measure heart rate, pulse wave velocity, blood and tissue oxygenation, and other variables, including blood pressure proxies.

Future Outlook

Optical position sensor Market Future Outlook

<p>The Optical Position Sensor Market is projected to grow at a 10.23% CAGR from 2024 to 2035, driven by advancements in automation, IoT integration, and demand for precision in various industries.</p>

New opportunities lie in:

  • <p>Development of smart manufacturing solutions utilizing optical sensors for real-time monitoring.</p><p>Expansion into automotive applications for enhanced safety and navigation systems.</p><p>Integration of optical position sensors in consumer electronics for improved user interfaces.</p>

<p>By 2035, the market is expected to be robust, driven by innovation and diverse applications.</p>

Market Segmentation

Optical position sensor Market Type Outlook

  • Linear Position Sensors
  • Rotary Position Sensors

Optical position sensor Market Output Outlook

  • Digital Output
  • Analog Output

Optical position sensor Market End-User Outlook

  • Manufacturing
  • Automotive
  • Aerospace
  • Packaging
  • Healthcare
  • Electronics
  • Others

Optical position sensor Market Application Outlook

  • Machine Tools
  • Robotics
  • Motion Systems
  • Material Handling
  • Test Equipment
  • Others

Optical position sensor Market Contract Type Outlook

  • Non-Contact Type
  • Contact Type

Report Scope

MARKET SIZE 20242.111(USD Billion)
MARKET SIZE 20252.326(USD Billion)
MARKET SIZE 20356.163(USD Billion)
COMPOUND ANNUAL GROWTH RATE (CAGR)10.23% (2024 - 2035)
REPORT COVERAGERevenue Forecast, Competitive Landscape, Growth Factors, and Trends
BASE YEAR2024
Market Forecast Period2025 - 2035
Historical Data2019 - 2024
Market Forecast UnitsUSD Billion
Key Companies ProfiledMarket analysis in progress
Segments CoveredMarket segmentation analysis in progress
Key Market OpportunitiesIntegration of advanced automation technologies drives demand in the Optical Position Sensor Market.
Key Market DynamicsTechnological advancements drive demand for optical position sensors in automation and robotics applications across various industries.
Countries CoveredNorth America, Europe, APAC, South America, MEA

FAQs

What is the projected market valuation for the Optical Position Sensor Market in 2035?

The Optical Position Sensor Market is projected to reach a valuation of 6.163 USD Billion by 2035.

What was the market valuation for the Optical Position Sensor Market in 2024?

In 2024, the Optical Position Sensor Market was valued at 2.111 USD Billion.

What is the expected CAGR for the Optical Position Sensor Market during the forecast period 2025 - 2035?

The expected CAGR for the Optical Position Sensor Market during the forecast period 2025 - 2035 is 10.23%.

Which companies are considered key players in the Optical Position Sensor Market?

Key players in the Optical Position Sensor Market include Honeywell, Omron, Texas Instruments, and STMicroelectronics.

What are the two main types of position sensors in the market, and how do they compare in valuation?

Linear Position Sensors were valued at 0.845 USD Billion in 2024, while Rotary Position Sensors had a valuation of 1.266 USD Billion.

How do the contact and non-contact types of optical position sensors compare in terms of market valuation?

In 2024, the Non-Contact Type was valued at 1.055 USD Billion, whereas the Contact Type had a valuation of 1.056 USD Billion.

  1. SECTION I: EXECUTIVE SUMMARY AND KEY HIGHLIGHTS
    1. EXECUTIVE SUMMARY
      1. Market Overview
      2. Key Findings
      3. Market Segmentation
      4. Competitive Landscape
      5. Challenges and Opportunities
      6. Future Outlook 2
  2. SECTION II: SCOPING, METHODOLOGY AND MARKET STRUCTURE
    1. MARKET INTRODUCTION
      1. Definition
      2. Scope of the study
    2. RESEARCH METHODOLOGY
      1. Overview
      2. Data Mining
      3. Secondary Research
      4. Primary Research
      5. Forecasting Model
      6. Market Size Estimation
      7. Data Triangulation
      8. Validation 3
  3. SECTION III: QUALITATIVE ANALYSIS
    1. MARKET DYNAMICS
      1. Overview
      2. Drivers
      3. Restraints
      4. Opportunities
    2. MARKET FACTOR ANALYSIS
      1. Value chain Analysis
      2. Porter's Five Forces Analysis
      3. COVID-19 Impact Analysis
  4. SECTION IV: QUANTITATIVE ANALYSIS
    1. Semiconductor & Electronics, BY Type (USD Billion)
      1. Linear Position Sensors
      2. Rotary Position Sensors
    2. Semiconductor & Electronics, BY Contract Type (USD Billion)
      1. Non-Contact Type
      2. Contact Type
    3. Semiconductor & Electronics, BY Output (USD Billion)
      1. Digital Output
      2. Analog Output
    4. Semiconductor & Electronics, BY Application (USD Billion)
      1. Machine Tools
      2. Robotics
      3. Motion Systems
      4. Material Handling
      5. Test Equipment
      6. Others
    5. Semiconductor & Electronics, BY End-User (USD Billion)
      1. Manufacturing
      2. Automotive
      3. Aerospace
      4. Packaging
      5. Healthcare
      6. Electronics
      7. Others
    6. Semiconductor & Electronics, BY Region (USD Billion)
      1. North America
      2. Europe
      3. APAC
      4. South America
      5. MEA
  5. SECTION V: COMPETITIVE ANALYSIS
    1. Competitive Landscape
      1. Overview
      2. Competitive Analysis
      3. Market share Analysis
      4. Major Growth Strategy in the Semiconductor & Electronics
      5. Competitive Benchmarking
      6. Leading Players in Terms of Number of Developments in the Semiconductor & Electronics
      7. Key developments and growth strategies
      8. Major Players Financial Matrix
    2. Company Profiles
      1. Honeywell (US)
      2. Omron (JP)
      3. Texas Instruments (US)
      4. STMicroelectronics (CH)
      5. Microchip Technology (US)
      6. ams AG (AT)
      7. Renesas Electronics (JP)
      8. Broadcom Inc. (US)
      9. Infineon Technologies (DE)
    3. Appendix
      1. References
      2. Related Reports 6 LIST OF FIGURES
    4. MARKET SYNOPSIS
    5. NORTH AMERICA MARKET ANALYSIS
    6. US MARKET ANALYSIS BY TYPE
    7. US MARKET ANALYSIS BY CONTRACT TYPE
    8. US MARKET ANALYSIS BY OUTPUT
    9. US MARKET ANALYSIS BY APPLICATION
    10. US MARKET ANALYSIS BY END-USER
    11. CANADA MARKET ANALYSIS BY TYPE
    12. CANADA MARKET ANALYSIS BY CONTRACT TYPE
    13. CANADA MARKET ANALYSIS BY OUTPUT
    14. CANADA MARKET ANALYSIS BY APPLICATION
    15. CANADA MARKET ANALYSIS BY END-USER
    16. EUROPE MARKET ANALYSIS
    17. GERMANY MARKET ANALYSIS BY TYPE
    18. GERMANY MARKET ANALYSIS BY CONTRACT TYPE
    19. GERMANY MARKET ANALYSIS BY OUTPUT
    20. GERMANY MARKET ANALYSIS BY APPLICATION
    21. GERMANY MARKET ANALYSIS BY END-USER
    22. UK MARKET ANALYSIS BY TYPE
    23. UK MARKET ANALYSIS BY CONTRACT TYPE
    24. UK MARKET ANALYSIS BY OUTPUT
    25. UK MARKET ANALYSIS BY APPLICATION
    26. UK MARKET ANALYSIS BY END-USER
    27. FRANCE MARKET ANALYSIS BY TYPE
    28. FRANCE MARKET ANALYSIS BY CONTRACT TYPE
    29. FRANCE MARKET ANALYSIS BY OUTPUT
    30. FRANCE MARKET ANALYSIS BY APPLICATION
    31. FRANCE MARKET ANALYSIS BY END-USER
    32. RUSSIA MARKET ANALYSIS BY TYPE
    33. RUSSIA MARKET ANALYSIS BY CONTRACT TYPE
    34. RUSSIA MARKET ANALYSIS BY OUTPUT
    35. RUSSIA MARKET ANALYSIS BY APPLICATION
    36. RUSSIA MARKET ANALYSIS BY END-USER
    37. ITALY MARKET ANALYSIS BY TYPE
    38. ITALY MARKET ANALYSIS BY CONTRACT TYPE
    39. ITALY MARKET ANALYSIS BY OUTPUT
    40. ITALY MARKET ANALYSIS BY APPLICATION
    41. ITALY MARKET ANALYSIS BY END-USER
    42. SPAIN MARKET ANALYSIS BY TYPE
    43. SPAIN MARKET ANALYSIS BY CONTRACT TYPE
    44. SPAIN MARKET ANALYSIS BY OUTPUT
    45. SPAIN MARKET ANALYSIS BY APPLICATION
    46. SPAIN MARKET ANALYSIS BY END-USER
    47. REST OF EUROPE MARKET ANALYSIS BY TYPE
    48. REST OF EUROPE MARKET ANALYSIS BY CONTRACT TYPE
    49. REST OF EUROPE MARKET ANALYSIS BY OUTPUT
    50. REST OF EUROPE MARKET ANALYSIS BY APPLICATION
    51. REST OF EUROPE MARKET ANALYSIS BY END-USER
    52. APAC MARKET ANALYSIS
    53. CHINA MARKET ANALYSIS BY TYPE
    54. CHINA MARKET ANALYSIS BY CONTRACT TYPE
    55. CHINA MARKET ANALYSIS BY OUTPUT
    56. CHINA MARKET ANALYSIS BY APPLICATION
    57. CHINA MARKET ANALYSIS BY END-USER
    58. INDIA MARKET ANALYSIS BY TYPE
    59. INDIA MARKET ANALYSIS BY CONTRACT TYPE
    60. INDIA MARKET ANALYSIS BY OUTPUT
    61. INDIA MARKET ANALYSIS BY APPLICATION
    62. INDIA MARKET ANALYSIS BY END-USER
    63. JAPAN MARKET ANALYSIS BY TYPE
    64. JAPAN MARKET ANALYSIS BY CONTRACT TYPE
    65. JAPAN MARKET ANALYSIS BY OUTPUT
    66. JAPAN MARKET ANALYSIS BY APPLICATION
    67. JAPAN MARKET ANALYSIS BY END-USER
    68. SOUTH KOREA MARKET ANALYSIS BY TYPE
    69. SOUTH KOREA MARKET ANALYSIS BY CONTRACT TYPE
    70. SOUTH KOREA MARKET ANALYSIS BY OUTPUT
    71. SOUTH KOREA MARKET ANALYSIS BY APPLICATION
    72. SOUTH KOREA MARKET ANALYSIS BY END-USER
    73. MALAYSIA MARKET ANALYSIS BY TYPE
    74. MALAYSIA MARKET ANALYSIS BY CONTRACT TYPE
    75. MALAYSIA MARKET ANALYSIS BY OUTPUT
    76. MALAYSIA MARKET ANALYSIS BY APPLICATION
    77. MALAYSIA MARKET ANALYSIS BY END-USER
    78. THAILAND MARKET ANALYSIS BY TYPE
    79. THAILAND MARKET ANALYSIS BY CONTRACT TYPE
    80. THAILAND MARKET ANALYSIS BY OUTPUT
    81. THAILAND MARKET ANALYSIS BY APPLICATION
    82. THAILAND MARKET ANALYSIS BY END-USER
    83. INDONESIA MARKET ANALYSIS BY TYPE
    84. INDONESIA MARKET ANALYSIS BY CONTRACT TYPE
    85. INDONESIA MARKET ANALYSIS BY OUTPUT
    86. INDONESIA MARKET ANALYSIS BY APPLICATION
    87. INDONESIA MARKET ANALYSIS BY END-USER
    88. REST OF APAC MARKET ANALYSIS BY TYPE
    89. REST OF APAC MARKET ANALYSIS BY CONTRACT TYPE
    90. REST OF APAC MARKET ANALYSIS BY OUTPUT
    91. REST OF APAC MARKET ANALYSIS BY APPLICATION
    92. REST OF APAC MARKET ANALYSIS BY END-USER
    93. SOUTH AMERICA MARKET ANALYSIS
    94. BRAZIL MARKET ANALYSIS BY TYPE
    95. BRAZIL MARKET ANALYSIS BY CONTRACT TYPE
    96. BRAZIL MARKET ANALYSIS BY OUTPUT
    97. BRAZIL MARKET ANALYSIS BY APPLICATION
    98. BRAZIL MARKET ANALYSIS BY END-USER
    99. MEXICO MARKET ANALYSIS BY TYPE
    100. MEXICO MARKET ANALYSIS BY CONTRACT TYPE
    101. MEXICO MARKET ANALYSIS BY OUTPUT
    102. MEXICO MARKET ANALYSIS BY APPLICATION
    103. MEXICO MARKET ANALYSIS BY END-USER
    104. ARGENTINA MARKET ANALYSIS BY TYPE
    105. ARGENTINA MARKET ANALYSIS BY CONTRACT TYPE
    106. ARGENTINA MARKET ANALYSIS BY OUTPUT
    107. ARGENTINA MARKET ANALYSIS BY APPLICATION
    108. ARGENTINA MARKET ANALYSIS BY END-USER
    109. REST OF SOUTH AMERICA MARKET ANALYSIS BY TYPE
    110. REST OF SOUTH AMERICA MARKET ANALYSIS BY CONTRACT TYPE
    111. REST OF SOUTH AMERICA MARKET ANALYSIS BY OUTPUT
    112. REST OF SOUTH AMERICA MARKET ANALYSIS BY APPLICATION
    113. REST OF SOUTH AMERICA MARKET ANALYSIS BY END-USER
    114. MEA MARKET ANALYSIS
    115. GCC COUNTRIES MARKET ANALYSIS BY TYPE
    116. GCC COUNTRIES MARKET ANALYSIS BY CONTRACT TYPE
    117. GCC COUNTRIES MARKET ANALYSIS BY OUTPUT
    118. GCC COUNTRIES MARKET ANALYSIS BY APPLICATION
    119. GCC COUNTRIES MARKET ANALYSIS BY END-USER
    120. SOUTH AFRICA MARKET ANALYSIS BY TYPE
    121. SOUTH AFRICA MARKET ANALYSIS BY CONTRACT TYPE
    122. SOUTH AFRICA MARKET ANALYSIS BY OUTPUT
    123. SOUTH AFRICA MARKET ANALYSIS BY APPLICATION
    124. SOUTH AFRICA MARKET ANALYSIS BY END-USER
    125. REST OF MEA MARKET ANALYSIS BY TYPE
    126. REST OF MEA MARKET ANALYSIS BY CONTRACT TYPE
    127. REST OF MEA MARKET ANALYSIS BY OUTPUT
    128. REST OF MEA MARKET ANALYSIS BY APPLICATION
    129. REST OF MEA MARKET ANALYSIS BY END-USER
    130. KEY BUYING CRITERIA OF SEMICONDUCTOR & ELECTRONICS
    131. RESEARCH PROCESS OF MRFR
    132. DRO ANALYSIS OF SEMICONDUCTOR & ELECTRONICS
    133. DRIVERS IMPACT ANALYSIS: SEMICONDUCTOR & ELECTRONICS
    134. RESTRAINTS IMPACT ANALYSIS: SEMICONDUCTOR & ELECTRONICS
    135. SUPPLY / VALUE CHAIN: SEMICONDUCTOR & ELECTRONICS
    136. SEMICONDUCTOR & ELECTRONICS, BY TYPE, 2024 (% SHARE)
    137. SEMICONDUCTOR & ELECTRONICS, BY TYPE, 2024 TO 2035 (USD Billion)
    138. SEMICONDUCTOR & ELECTRONICS, BY CONTRACT TYPE, 2024 (% SHARE)
    139. SEMICONDUCTOR & ELECTRONICS, BY CONTRACT TYPE, 2024 TO 2035 (USD Billion)
    140. SEMICONDUCTOR & ELECTRONICS, BY OUTPUT, 2024 (% SHARE)
    141. SEMICONDUCTOR & ELECTRONICS, BY OUTPUT, 2024 TO 2035 (USD Billion)
    142. SEMICONDUCTOR & ELECTRONICS, BY APPLICATION, 2024 (% SHARE)
    143. SEMICONDUCTOR & ELECTRONICS, BY APPLICATION, 2024 TO 2035 (USD Billion)
    144. SEMICONDUCTOR & ELECTRONICS, BY END-USER, 2024 (% SHARE)
    145. SEMICONDUCTOR & ELECTRONICS, BY END-USER, 2024 TO 2035 (USD Billion)
    146. BENCHMARKING OF MAJOR COMPETITORS 7 LIST OF TABLES
    147. LIST OF ASSUMPTIONS
    148. North America MARKET SIZE ESTIMATES; FORECAST
      1. BY TYPE, 2025-2035 (USD Billion)
      2. BY CONTRACT TYPE, 2025-2035 (USD Billion)
      3. BY OUTPUT, 2025-2035 (USD Billion)
      4. BY APPLICATION, 2025-2035 (USD Billion)
      5. BY END-USER, 2025-2035 (USD Billion)
    149. US MARKET SIZE ESTIMATES; FORECAST
      1. BY TYPE, 2025-2035 (USD Billion)
      2. BY CONTRACT TYPE, 2025-2035 (USD Billion)
      3. BY OUTPUT, 2025-2035 (USD Billion)
      4. BY APPLICATION, 2025-2035 (USD Billion)
      5. BY END-USER, 2025-2035 (USD Billion)
    150. Canada MARKET SIZE ESTIMATES; FORECAST
      1. BY TYPE, 2025-2035 (USD Billion)
      2. BY CONTRACT TYPE, 2025-2035 (USD Billion)
      3. BY OUTPUT, 2025-2035 (USD Billion)
      4. BY APPLICATION, 2025-2035 (USD Billion)
      5. BY END-USER, 2025-2035 (USD Billion)
    151. Europe MARKET SIZE ESTIMATES; FORECAST
      1. BY TYPE, 2025-2035 (USD Billion)
      2. BY CONTRACT TYPE, 2025-2035 (USD Billion)
      3. BY OUTPUT, 2025-2035 (USD Billion)
      4. BY APPLICATION, 2025-2035 (USD Billion)
      5. BY END-USER, 2025-2035 (USD Billion)
    152. Germany MARKET SIZE ESTIMATES; FORECAST
      1. BY TYPE, 2025-2035 (USD Billion)
      2. BY CONTRACT TYPE, 2025-2035 (USD Billion)
      3. BY OUTPUT, 2025-2035 (USD Billion)
      4. BY APPLICATION, 2025-2035 (USD Billion)
      5. BY END-USER, 2025-2035 (USD Billion)
    153. UK MARKET SIZE ESTIMATES; FORECAST
      1. BY TYPE, 2025-2035 (USD Billion)
      2. BY CONTRACT TYPE, 2025-2035 (USD Billion)
      3. BY OUTPUT, 2025-2035 (USD Billion)
      4. BY APPLICATION, 2025-2035 (USD Billion)
      5. BY END-USER, 2025-2035 (USD Billion)
    154. France MARKET SIZE ESTIMATES; FORECAST
      1. BY TYPE, 2025-2035 (USD Billion)
      2. BY CONTRACT TYPE, 2025-2035 (USD Billion)
      3. BY OUTPUT, 2025-2035 (USD Billion)
      4. BY APPLICATION, 2025-2035 (USD Billion)
      5. BY END-USER, 2025-2035 (USD Billion)
    155. Russia MARKET SIZE ESTIMATES; FORECAST
      1. BY TYPE, 2025-2035 (USD Billion)
      2. BY CONTRACT TYPE, 2025-2035 (USD Billion)
      3. BY OUTPUT, 2025-2035 (USD Billion)
      4. BY APPLICATION, 2025-2035 (USD Billion)
      5. BY END-USER, 2025-2035 (USD Billion)
    156. Italy MARKET SIZE ESTIMATES; FORECAST
      1. BY TYPE, 2025-2035 (USD Billion)
      2. BY CONTRACT TYPE, 2025-2035 (USD Billion)
      3. BY OUTPUT, 2025-2035 (USD Billion)
      4. BY APPLICATION, 2025-2035 (USD Billion)
      5. BY END-USER, 2025-2035 (USD Billion)
    157. Spain MARKET SIZE ESTIMATES; FORECAST
      1. BY TYPE, 2025-2035 (USD Billion)
      2. BY CONTRACT TYPE, 2025-2035 (USD Billion)
      3. BY OUTPUT, 2025-2035 (USD Billion)
      4. BY APPLICATION, 2025-2035 (USD Billion)
      5. BY END-USER, 2025-2035 (USD Billion)
    158. Rest of Europe MARKET SIZE ESTIMATES; FORECAST
      1. BY TYPE, 2025-2035 (USD Billion)
      2. BY CONTRACT TYPE, 2025-2035 (USD Billion)
      3. BY OUTPUT, 2025-2035 (USD Billion)
      4. BY APPLICATION, 2025-2035 (USD Billion)
      5. BY END-USER, 2025-2035 (USD Billion)
    159. APAC MARKET SIZE ESTIMATES; FORECAST
      1. BY TYPE, 2025-2035 (USD Billion)
      2. BY CONTRACT TYPE, 2025-2035 (USD Billion)
      3. BY OUTPUT, 2025-2035 (USD Billion)
      4. BY APPLICATION, 2025-2035 (USD Billion)
      5. BY END-USER, 2025-2035 (USD Billion)
    160. China MARKET SIZE ESTIMATES; FORECAST
      1. BY TYPE, 2025-2035 (USD Billion)
      2. BY CONTRACT TYPE, 2025-2035 (USD Billion)
      3. BY OUTPUT, 2025-2035 (USD Billion)
      4. BY APPLICATION, 2025-2035 (USD Billion)
      5. BY END-USER, 2025-2035 (USD Billion)
    161. India MARKET SIZE ESTIMATES; FORECAST
      1. BY TYPE, 2025-2035 (USD Billion)
      2. BY CONTRACT TYPE, 2025-2035 (USD Billion)
      3. BY OUTPUT, 2025-2035 (USD Billion)
      4. BY APPLICATION, 2025-2035 (USD Billion)
      5. BY END-USER, 2025-2035 (USD Billion)
    162. Japan MARKET SIZE ESTIMATES; FORECAST
      1. BY TYPE, 2025-2035 (USD Billion)
      2. BY CONTRACT TYPE, 2025-2035 (USD Billion)
      3. BY OUTPUT, 2025-2035 (USD Billion)
      4. BY APPLICATION, 2025-2035 (USD Billion)
      5. BY END-USER, 2025-2035 (USD Billion)
    163. South Korea MARKET SIZE ESTIMATES; FORECAST
      1. BY TYPE, 2025-2035 (USD Billion)
      2. BY CONTRACT TYPE, 2025-2035 (USD Billion)
      3. BY OUTPUT, 2025-2035 (USD Billion)
      4. BY APPLICATION, 2025-2035 (USD Billion)
      5. BY END-USER, 2025-2035 (USD Billion)
    164. Malaysia MARKET SIZE ESTIMATES; FORECAST
      1. BY TYPE, 2025-2035 (USD Billion)
      2. BY CONTRACT TYPE, 2025-2035 (USD Billion)
      3. BY OUTPUT, 2025-2035 (USD Billion)
      4. BY APPLICATION, 2025-2035 (USD Billion)
      5. BY END-USER, 2025-2035 (USD Billion)
    165. Thailand MARKET SIZE ESTIMATES; FORECAST
      1. BY TYPE, 2025-2035 (USD Billion)
      2. BY CONTRACT TYPE, 2025-2035 (USD Billion)
      3. BY OUTPUT, 2025-2035 (USD Billion)
      4. BY APPLICATION, 2025-2035 (USD Billion)
      5. BY END-USER, 2025-2035 (USD Billion)
    166. Indonesia MARKET SIZE ESTIMATES; FORECAST
      1. BY TYPE, 2025-2035 (USD Billion)
      2. BY CONTRACT TYPE, 2025-2035 (USD Billion)
      3. BY OUTPUT, 2025-2035 (USD Billion)
      4. BY APPLICATION, 2025-2035 (USD Billion)
      5. BY END-USER, 2025-2035 (USD Billion)
    167. Rest of APAC MARKET SIZE ESTIMATES; FORECAST
      1. BY TYPE, 2025-2035 (USD Billion)
      2. BY CONTRACT TYPE, 2025-2035 (USD Billion)
      3. BY OUTPUT, 2025-2035 (USD Billion)
      4. BY APPLICATION, 2025-2035 (USD Billion)
      5. BY END-USER, 2025-2035 (USD Billion)
    168. South America MARKET SIZE ESTIMATES; FORECAST
      1. BY TYPE, 2025-2035 (USD Billion)
      2. BY CONTRACT TYPE, 2025-2035 (USD Billion)
      3. BY OUTPUT, 2025-2035 (USD Billion)
      4. BY APPLICATION, 2025-2035 (USD Billion)
      5. BY END-USER, 2025-2035 (USD Billion)
    169. Brazil MARKET SIZE ESTIMATES; FORECAST
      1. BY TYPE, 2025-2035 (USD Billion)
      2. BY CONTRACT TYPE, 2025-2035 (USD Billion)
      3. BY OUTPUT, 2025-2035 (USD Billion)
      4. BY APPLICATION, 2025-2035 (USD Billion)
      5. BY END-USER, 2025-2035 (USD Billion)
    170. Mexico MARKET SIZE ESTIMATES; FORECAST
      1. BY TYPE, 2025-2035 (USD Billion)
      2. BY CONTRACT TYPE, 2025-2035 (USD Billion)
      3. BY OUTPUT, 2025-2035 (USD Billion)
      4. BY APPLICATION, 2025-2035 (USD Billion)
      5. BY END-USER, 2025-2035 (USD Billion)
    171. Argentina MARKET SIZE ESTIMATES; FORECAST
      1. BY TYPE, 2025-2035 (USD Billion)
      2. BY CONTRACT TYPE, 2025-2035 (USD Billion)
      3. BY OUTPUT, 2025-2035 (USD Billion)
      4. BY APPLICATION, 2025-2035 (USD Billion)
      5. BY END-USER, 2025-2035 (USD Billion)
    172. Rest of South America MARKET SIZE ESTIMATES; FORECAST
      1. BY TYPE, 2025-2035 (USD Billion)
      2. BY CONTRACT TYPE, 2025-2035 (USD Billion)
      3. BY OUTPUT, 2025-2035 (USD Billion)
      4. BY APPLICATION, 2025-2035 (USD Billion)
      5. BY END-USER, 2025-2035 (USD Billion)
    173. MEA MARKET SIZE ESTIMATES; FORECAST
      1. BY TYPE, 2025-2035 (USD Billion)
      2. BY CONTRACT TYPE, 2025-2035 (USD Billion)
      3. BY OUTPUT, 2025-2035 (USD Billion)
      4. BY APPLICATION, 2025-2035 (USD Billion)
      5. BY END-USER, 2025-2035 (USD Billion)
    174. GCC Countries MARKET SIZE ESTIMATES; FORECAST
      1. BY TYPE, 2025-2035 (USD Billion)
      2. BY CONTRACT TYPE, 2025-2035 (USD Billion)
      3. BY OUTPUT, 2025-2035 (USD Billion)
      4. BY APPLICATION, 2025-2035 (USD Billion)
      5. BY END-USER, 2025-2035 (USD Billion)
    175. South Africa MARKET SIZE ESTIMATES; FORECAST
      1. BY TYPE, 2025-2035 (USD Billion)
      2. BY CONTRACT TYPE, 2025-2035 (USD Billion)
      3. BY OUTPUT, 2025-2035 (USD Billion)
      4. BY APPLICATION, 2025-2035 (USD Billion)
      5. BY END-USER, 2025-2035 (USD Billion)
    176. Rest of MEA MARKET SIZE ESTIMATES; FORECAST
      1. BY TYPE, 2025-2035 (USD Billion)
      2. BY CONTRACT TYPE, 2025-2035 (USD Billion)
      3. BY OUTPUT, 2025-2035 (USD Billion)
      4. BY APPLICATION, 2025-2035 (USD Billion)
      5. BY END-USER, 2025-2035 (USD Billion)
    177. PRODUCT LAUNCH/PRODUCT DEVELOPMENT/APPROVAL
    178. ACQUISITION/PARTNERSHIP

Optical position sensor Market Segmentation

Optical position sensor Market By Type Outlook (USD Billion, 2018-2032)

Linear Position Sensors

Rotary Position Sensors

Optical position sensor Market By Contact Type Outlook (USD Billion, 2018-2032)

Non-Contact Type

Contact Type

Optical position sensor Market By Output Outlook (USD Billion, 2018-2032)

Digital Output

Analog Output

Optical position sensor Market By Application Outlook (USD Billion, 2018-2032)

Machine Tools

Robotics

Motion Systems

Material Handling

Test Equipment

Others (Inspection Systems and Measurement)

Optical position sensor Market By End-User Outlook (USD Billion, 2018-2032)

Manufacturing

Automative

Aerospace

Packaging

Healthcare

Electronics

Others (Power and Mining Industries)

Optical position sensor Market Regional Outlook (USD Billion, 2018-2032)

North America Outlook (USD Billion, 2018-2032)

North America Optical position sensor Market By Type

Linear Position Sensors

Rotary Position Sensors

North America Optical position sensor Market By Contact Type

Non-Contact Type

Contact Type

North America Optical position sensor Market By Output

Digital Output

Analog Output

North America Optical position sensor Market By Application

Machine Tools

Robotics

Motion Systems

Material Handling

Test Equipment

Others (Inspection Systems and Measurement)

North America Optical position sensor Market By End-User Industries

Manufacturing

Automative

Aerospace

Packaging

Healthcare

Electronics

Others (Power and Mining Industries)

US Outlook (USD Billion, 2018-2032)

US Optical position sensor Market By Type

Linear Position Sensors

Rotary Position Sensors

US Optical position sensor Market By Contact Type

Non-Contact Type

Contact Type

US Optical position sensor Market By Output

Digital Output

Analog Output

US Optical position sensor Market By Application

Machine Tools

Robotics

Motion Systems

Material Handling

Test Equipment

Others (Inspection Systems and Measurement)

US Optical position sensor Market By End-User Industries

Manufacturing

Automative

Aerospace

Packaging

Healthcare

Electronics

Others (Power and Mining Industries)

CANADA Outlook (USD Billion, 2018-2032)

CANADA Optical position sensor Market By Type

Linear Position Sensors

Rotary Position Sensors

CANADA Optical position sensor Market By Contact Type

Non-Contact Type

Contact Type

CANADA Optical position sensor Market By Output

Digital Output

Analog Output

CANADA Optical position sensor Market By Application

Machine Tools

Robotics

Motion Systems

Material Handling

Test Equipment

Others (Inspection Systems and Measurement)

CANADA Optical position sensor Market By End-User Industries

Manufacturing

Automative

Aerospace

Packaging

Healthcare

Electronics

Others (Power and Mining Industries)

Europe Outlook (USD Billion, 2018-2032)

Europe Optical position sensor Market By Type

Linear Position Sensors

Rotary Position Sensors

Europe Optical position sensor Market By Contact Type

Non-Contact Type

Contact Type

Europe Optical position sensor Market By Output

Digital Output

Analog Output

Europe Optical position sensor Market By Application

Machine Tools

Robotics

Motion Systems

Material Handling

Test Equipment

Others (Inspection Systems and Measurement)

Europe Optical position sensor Market By End-User Industries

Manufacturing

Automative

Aerospace

Packaging

Healthcare

Electronics

Others (Power and Mining Industries)

Germany Outlook (USD Billion, 2018-2032)

Germany Optical position sensor Market By Type

Linear Position Sensors

Rotary Position Sensors

Germany Optical position sensor Market By Contact Type

Non-Contact Type

Contact Type

Germany Optical position sensor Market By Output

Digital Output

Analog Output

Germany Optical position sensor Market By Application

Machine Tools

Robotics

Motion Systems

Material Handling

Test Equipment

Others (Inspection Systems and Measurement)

Germany Optical position sensor Market By End-User Industries

Manufacturing

Automative

Aerospace

Packaging

Healthcare

Electronics

Others (Power and Mining Industries)

France Outlook (USD Billion, 2018-2032)

France Optical position sensor Market By Type

Linear Position Sensors

Rotary Position Sensors

France Optical position sensor Market By Contact Type

Non-Contact Type

Contact Type

France Optical position sensor Market By Output

Digital Output

Analog Output

France Optical position sensor Market By Application

Machine Tools

Robotics

Motion Systems

Material Handling

Test Equipment

Others (Inspection Systems and Measurement)

France Optical position sensor Market By End-User Industries

Manufacturing

Automative

Aerospace

Packaging

Healthcare

Electronics

Others (Power and Mining Industries)

UK Outlook (USD Billion, 2018-2032)

UK Optical position sensor Market By Type

Linear Position Sensors

Rotary Position Sensors

UK Optical position sensor Market By Contact Type

Non-Contact Type

Contact Type

UK Optical position sensor Market By Output

Digital Output

Analog Output

UK Optical position sensor Market By Application

Machine Tools

Robotics

Motion Systems

Material Handling

Test Equipment

Others (Inspection Systems and Measurement)

UK Optical position sensor Market By End-User Industries

Manufacturing

Automative

Aerospace

Packaging

Healthcare

Electronics

Others (Power and Mining Industries)

ITALY Outlook (USD Billion, 2018-2032)

ITALY Optical position sensor Market By Type

Linear Position Sensors

Rotary Position Sensors

ITALY Optical position sensor Market By Contact Type

Non-Contact Type

Contact Type

ITALY Optical position sensor Market By Output

Digital Output

Analog Output

ITALY Optical position sensor Market By Application

Machine Tools

Robotics

Motion Systems

Material Handling

Test Equipment

Others (Inspection Systems and Measurement)

ITALY Optical position sensor Market By End-User Industries

Manufacturing

Automative

Aerospace

Packaging

Healthcare

Electronics

Others (Power and Mining Industries)

SPAIN Outlook (USD Billion, 2018-2032)

Spain Optical position sensor Market By Type

Linear Position Sensors

Rotary Position Sensors

Spain Optical position sensor Market By Contact Type

Non-Contact Type

Contact Type

Spain Optical position sensor Market By Output

Digital Output

Analog Output

Spain Optical position sensor Market By Application

Machine Tools

Robotics

Motion Systems

Material Handling

Test Equipment

Others (Inspection Systems and Measurement)

Spain Optical position sensor Market By End-User Industries

Manufacturing

Automative

Aerospace

Packaging

Healthcare

Electronics

Others (Power and Mining Industries)

Rest Of Europe Outlook (USD Billion, 2018-2032)

Rest Of Europe Optical position sensor Market By Type

Linear Position Sensors

Rotary Position Sensors

REST OF EUROPE Optical position sensor Market By Contact Type

Non-Contact Type

Contact Type

REST OF EUROPE Optical position sensor Market By Output

Digital Output

Analog Output

REST OF EUROPE Optical position sensor Market By Application

Machine Tools

Robotics

Motion Systems

Material Handling

Test Equipment

Others (Inspection Systems and Measurement)

Rest Of Europe Optical position sensor Market By End-User Industries

Manufacturing

Automative

Aerospace

Packaging

Healthcare

Electronics

Others (Power and Mining Industries)

Asia-Pacific Outlook (USD Billion, 2018-2032)

Asia-Pacific Optical position sensor Market By Type

Linear Position Sensors

Rotary Position Sensors

Asia-Pacific Optical position sensor Market By Contact Type

Non-Contact Type

Contact Type

Asia-Pacific Optical position sensor Market By Output

Digital Output

Analog Output

Asia-Pacific Optical position sensor Market By Application

Machine Tools

Robotics

Motion Systems

Material Handling

Test Equipment

Others (Inspection Systems and Measurement)

Asia-Pacific Optical position sensor Market By End-User Industries

Manufacturing

Automative

Aerospace

Packaging

Healthcare

Electronics

Others (Power and Mining Industries)

China Outlook (USD Billion, 2018-2032)

China Optical position sensor Market By Type

Linear Position Sensors

Rotary Position Sensors

China Optical position sensor Market By Contact Type

Non-Contact Type

Contact Type

China Optical position sensor Market By Output

Digital Output

Analog Output

China Optical position sensor Market By Application

Machine Tools

Robotics

Motion Systems

Material Handling

Test Equipment

Others (Inspection Systems and Measurement)

China Optical position sensor Market By End-User Industries

Manufacturing

Automative

Aerospace

Packaging

Healthcare

Electronics

Others (Power and Mining Industries)

Japan Outlook (USD Billion, 2018-2032)

Japan Optical position sensor Market By Type

Linear Position Sensors

Rotary Position Sensors

Japan Optical position sensor Market By Contact Type

Non-Contact Type

Contact Type

Japan Optical position sensor Market By Output

Digital Output

Analog Output

Japan Optical position sensor Market By Application

Machine Tools

Robotics

Motion Systems

Material Handling

Test Equipment

Others (Inspection Systems and Measurement)

Japan Optical position sensor Market By End-User Industries

Manufacturing

Automative

Aerospace

Packaging

Healthcare

Electronics

Others (Power and Mining Industries)

India Outlook (USD Billion, 2018-2032)

India Optical position sensor Market By Type

Linear Position Sensors

Rotary Position Sensors

India Optical position sensor Market By Contact Type

Non-Contact Type

Contact Type

India Optical position sensor Market By Output

Digital Output

Analog Output

India Optical position sensor Market By Application

Machine Tools

Robotics

Motion Systems

Material Handling

Test Equipment

Others (Inspection Systems and Measurement)

India Optical position sensor Market By End-User Industries

Manufacturing

Automative

Aerospace

Packaging

Healthcare

Electronics

Others (Power and Mining Industries)

Australia Outlook (USD Billion, 2018-2032)

Australia Optical position sensor Market By Type

Linear Position Sensors

Rotary Position Sensors

Australia Optical position sensor Market By Contact Type

Non-Contact Type

Contact Type

Australia Optical position sensor Market By Output

Digital Output

Analog Output

Australia Optical position sensor Market By Application

Machine Tools

Robotics

Motion Systems

Material Handling

Test Equipment

Others (Inspection Systems and Measurement)

Australia Optical position sensor Market By End-User Industries

Manufacturing

Automative

Aerospace

Packaging

Healthcare

Electronics

Others (Power and Mining Industries)

Rest of Asia-Pacific Outlook (USD Billion, 2018-2032)

Rest of Asia-Pacific Optical position sensor Market By Type

Linear Position Sensors

Rotary Position Sensors

Rest of Asia-Pacific Optical position sensor Market By Contact Type

Non-Contact Type

Contact Type

Rest of Asia-Pacific Optical position sensor Market By Output

Digital Output

Analog Output

Rest of Asia-Pacific Optical position sensor Market By Application

Machine Tools

Robotics

Motion Systems

Material Handling

Test Equipment

Others (Inspection Systems and Measurement)

Rest of Asia-Pacific Optical position sensor Market By End-User Industries

Manufacturing

Automative

Aerospace

Packaging

Healthcare

Electronics

Others (Power and Mining Industries)

Rest of the World Outlook (USD Billion, 2018-2032)

Rest of the World Optical position sensor Market By Type

Linear Position Sensors

Rotary Position Sensors

Rest of the World Optical position sensor Market By Contact Type

Non-Contact Type

Contact Type

Rest of the World Optical position sensor Market By Output

Digital Output

Analog Output

Rest of the World Optical position sensor Market By Application

Machine Tools

Robotics

Motion Systems

Material Handling

Test Equipment

Others (Inspection Systems and Measurement)

Rest of the World Optical position sensor Market By End-User Industries

Manufacturing

Automative

Aerospace

Packaging

Healthcare

Electronics

Others (Power and Mining Industries)

Middle East Outlook (USD Billion, 2018-2032)

Middle East Optical position sensor Market By Type

Linear Position Sensors

Rotary Position Sensors

Middle East Optical position sensor Market By Contact Type

Non-Contact Type

Contact Type

Middle East Optical position sensor Market By Output

Digital Output

Analog Output

Middle East Optical position sensor Market By Application

Machine Tools

Robotics

Motion Systems

Material Handling

Test Equipment

Others (Inspection Systems and Measurement)

Middle East Optical position sensor Market By End-User Industries

Manufacturing

Automative

Aerospace

Packaging

Healthcare

Electronics

Others (Power and Mining Industries)

Africa Outlook (USD Billion, 2018-2032)

Africa Optical position sensor Market By Type

Linear Position Sensors

Rotary Position Sensors

Africa Optical position sensor Market By Contact Type

Non-Contact Type

Contact Type

Africa Optical position sensor Market By Output

Digital Output

Analog Output

Africa Optical position sensor Market By Application

Machine Tools

Robotics

Motion Systems

Material Handling

Test Equipment

Others (Inspection Systems and Measurement)

Africa Optical position sensor Market By End-User Industries

Manufacturing

Automative

Aerospace

Packaging

Healthcare

Electronics

Others (Power and Mining Industries)

Latin America Outlook (USD Billion, 2018-2032)

Latin America Optical position sensor Market By Type

Linear Position Sensors

Rotary Position Sensors

Latin America Optical position sensor Market By Contact Type

Non-Contact Type

Contact Type

Latin America Optical position sensor Market By Output

Digital Output

Analog Output

Latin America Optical position sensor Market By Application

Machine Tools

Robotics

Motion Systems

Material Handling

Test Equipment

Others (Inspection Systems and Measurement)

Latin Optical position sensor Market By End-User Industries

Manufacturing

Automative

Aerospace

Packaging

Healthcare

Electronics

Others (Power and Mining Industries)

Infographic

Free Sample Request

Kindly complete the form below to receive a free sample of this Report

Get Free Sample

Customer Strories

“I am very pleased with how market segments have been defined in a relevant way for my purposes (such as "Portable Freezers & refrigerators" and "last-mile"). In general the report is well structured. Thanks very much for your efforts.”

Victoria Milne

Founder

Compare Licence

×
Features License Type
Single User Multiuser License Enterprise User
Price $4,950 $5,950 $7,250
Maximum User Access Limit 1 User Upto 10 Users Unrestricted Access Throughout the Organization
Free Customization
Direct Access to Analyst
Deliverable Format
Platform Access
Discount on Next Purchase 10% 15% 15%
Printable Versions