×
Hero Background
English
Chinese
French
Japanese
Korean
German
Spanish

Organic Chemicals Market Share

ID: MRFR/CnM/9293-HCR
100 Pages
Chitranshi Jaiswal
October 2025

Organic Chemicals Market Research Report Information By Source (Natural and Synthetic), By Type (Aliphatic, Aromatic, and Carbonyl), By Application (Food & Beverages, Agrochemicals, Pharmaceuticals, Personal Care & Cosmetics, and Plastics Polymers), and By Region (North America, Europe, Asia-Pacific, and Rest Of The World) –Market Forecast Till 2035

Share:
Download PDF ×

We do not share your information with anyone. However, we may send you emails based on your report interest from time to time. You may contact us at any time to opt-out.

Organic Chemicals Market Infographic
Purchase Options

Market Share

Organic Chemicals Market Share Analysis

Market share positioning strategies are essential for firms to establish a unique brand, draw in clients, and keep a competitive advantage in the highly competitive Organic Chemicals Market. The following guidelines clarify the main tactics used by market participants to proactively position themselves in this dynamic market: Product Innovation and Differentiation: Using innovation and differentiation to set items apart is a key tactic. To differentiate themselves in the market, businesses spend money on R&D to produce original formulas, innovative chemical processes, and environmentally responsible substitutes. Emphasis on Chemical Specialties: It is a wise strategic move to focus on producing specialized or specialty chemicals. Businesses can become authorities in their domain, serving specialized applications and building a loyal clientele by focusing on particular chemical categories. Sustainability and Green Chemistry: A popular approach is to use the concepts of sustainability and green chemistry. Businesses that implement sustainable methods and present themselves as environmentally conscious win over customers and satisfy the rising demand for green products. Adoption of Bio-based Chemicals: Using bio-based chemicals is part of the market positioning strategy. Businesses that create organic alternatives and use renewable feedstocks are in line with customer demands for green products, which helps them gain market share. Strategic Collaborations and Partnerships: Establishing these kind of relationships is essential. Companies may get access to new technology, pool resources, and strengthen their market position by forming mutually advantageous alliances with other industry participants. Global Expansion Initiatives: Increasing your geographic reach is a calculated tactic to reach a wider audience. Businesses may access growing markets, diversify their clientele, and reduce the risks brought on by regional economic swings by proactively entering new nations or areas. Customer-Centric strategy: For market share positioning, a customer-centric strategy must be used. Businesses may cultivate brand loyalty and obtain a competitive edge by comprehending and meeting the demands of their customers, offering superior customer service, and fostering strong connections.

Author
Chitranshi Jaiswal
Research Analyst Level I

In her 3 years of experience in the market research field, she has handled critical cross-domain projects. She has an in-depth knowledge of market estimation & analysis, problem-solving, primary as well as secondary research, and team management.She holds an engineering degree and is an MBA professional from a well-known university, capable of evaluating the market and competitive conditions. An exceptional strategist with excellent communication skills and a passion for delivering cutting-edge & practical insights for the market. Proficient in multi-tasking, and can successfully deal with competing demands, while maintaining complete confidentiality. Generated business through active client and project development, networking, and high-quality responses. Her knowledge and skills have helped in making solid business decisions, securing funding from investors, and avoiding business failures.

Leave a Comment

FAQs

What is the projected market valuation of the Organic Chemicals Market by 2035?

The Organic Chemicals Market is projected to reach a valuation of 26.2 USD Billion by 2035.

What was the market valuation of the Organic Chemicals Market in 2024?

In 2024, the Organic Chemicals Market had a valuation of 13.06 USD Billion.

What is the expected CAGR for the Organic Chemicals Market during the forecast period 2025 - 2035?

The expected CAGR for the Organic Chemicals Market during the forecast period 2025 - 2035 is 6.53%.

Which companies are considered key players in the Organic Chemicals Market?

Key players in the Organic Chemicals Market include BASF, Dow, SABIC, LyondellBasell, and Eastman Chemical Company.

What are the projected valuations for natural and synthetic organic chemicals by 2035?

By 2035, natural organic chemicals are projected to reach 10.84 USD Billion, while synthetic organic chemicals may reach 15.36 USD Billion.

How do the valuations of aliphatic, aromatic, and carbonyl organic chemicals compare by 2035?

By 2035, aliphatic organic chemicals are projected at 9.0 USD Billion, aromatic at 10.0 USD Billion, and carbonyl at 7.2 USD Billion.

What applications are driving growth in the Organic Chemicals Market?

Key applications driving growth include pharmaceuticals, agrochemicals, and food and beverages, with projected valuations of 8.0, 6.0, and 5.0 USD Billion respectively by 2035.

Market Summary

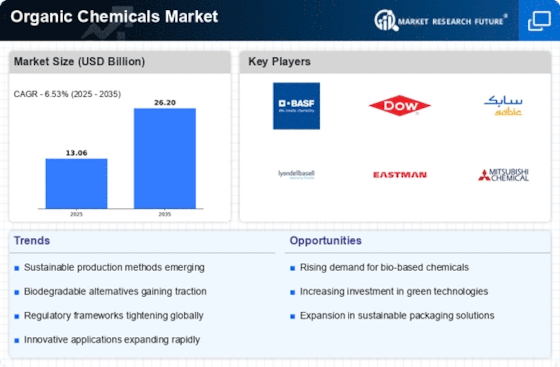
As per MRFR analysis, the Organic Chemicals Market Size was estimated at 13.06 USD Billion in 2024. The Organic Chemicals industry is projected to grow from 13.91 USD Billion in 2025 to 26.2 USD Billion by 2035, exhibiting a compound annual growth rate (CAGR) of 6.53 during the forecast period 2025 - 2035.

Key Market Trends & Highlights

The Organic Chemicals Market is poised for robust growth driven by sustainability and innovation.

  • North America remains the largest market for organic chemicals, driven by strong industrial demand and regulatory frameworks.
  • The Asia-Pacific region is emerging as the fastest-growing market, fueled by rapid industrialization and increasing consumer awareness.
  • Natural organic chemicals dominate the market, while synthetic organic chemicals are experiencing the fastest growth due to technological advancements.
  • Rising demand for eco-friendly products and regulatory support for green chemistry are key drivers propelling market expansion.

Market Size & Forecast

2024 Market Size 13.06 (USD Billion)
2035 Market Size 26.2 (USD Billion)
CAGR (2025 - 2035) 6.53%
Largest Regional Market Share in 2024 North America

Major Players

<p>BASF (DE), Dow (US), SABIC (SA), LyondellBasell (US), Eastman Chemical Company (US), Mitsubishi Chemical Corporation (JP), AkzoNobel (NL), Solvay (BE), Covestro (DE), Huntsman Corporation (US)</p>

Market Trends

The Organic Chemicals Market is currently experiencing a dynamic evolution, driven by various factors that influence production and consumption patterns. The increasing demand for sustainable and eco-friendly products appears to be reshaping the landscape, as consumers and industries alike prioritize environmentally responsible choices. This shift is likely to encourage manufacturers to innovate and develop organic chemical solutions that align with these preferences. Furthermore, regulatory frameworks are becoming more stringent, compelling companies to adopt greener practices and reduce their environmental footprint. As a result, the market is witnessing a gradual transition towards bio-based feedstocks and processes, which may enhance the overall sustainability of organic chemicals. In addition to sustainability, technological advancements are playing a crucial role in the Organic Chemicals Market. Innovations in production techniques and the integration of digital technologies are streamlining operations and improving efficiency. This trend suggests that companies are increasingly investing in research and development to enhance their product offerings and meet the evolving needs of consumers. Moreover, the globalization of trade is facilitating the exchange of organic chemicals across borders, potentially expanding market reach and fostering competition. Overall, the Organic Chemicals Market is poised for growth, driven by sustainability initiatives, technological progress, and global trade dynamics.

Sustainability Initiatives

The Organic Chemicals Market is witnessing a notable shift towards sustainability, as both consumers and industries prioritize eco-friendly products. This trend encourages manufacturers to innovate and develop organic chemical solutions that align with environmental considerations.

Technological Advancements

Technological progress is significantly impacting the Organic Chemicals Market, with innovations in production techniques enhancing efficiency. Companies are increasingly investing in research and development to improve their offerings and adapt to changing consumer demands.

Global Trade Dynamics

The globalization of trade is facilitating the exchange of organic chemicals across borders, potentially expanding market reach. This trend fosters competition and encourages companies to adapt their strategies to meet diverse market needs.

Organic Chemicals Market Market Drivers

Regulatory Support for Green Chemistry

Regulatory frameworks are increasingly favoring the use of organic chemicals, which is a significant driver for the Organic Chemicals Market. Governments worldwide are implementing stringent regulations aimed at reducing the environmental impact of chemical production. These regulations often promote the adoption of green chemistry principles, which encourage the use of renewable resources and minimize hazardous substances. As a result, companies that invest in organic chemical production are likely to benefit from incentives and support, fostering growth in this sector. The regulatory landscape is expected to evolve, further bolstering the Organic Chemicals Market as businesses adapt to comply with these new standards.

Rising Demand for Eco-Friendly Products

The Organic Chemicals Market is experiencing a notable increase in demand for eco-friendly products. Consumers are becoming increasingly aware of environmental issues, leading to a shift towards sustainable alternatives. This trend is reflected in the growing preference for organic chemicals in various applications, including agriculture, personal care, and cleaning products. According to recent data, the organic chemicals segment is projected to grow at a compound annual growth rate of approximately 5.2% over the next five years. This shift not only aligns with consumer preferences but also encourages manufacturers to innovate and develop greener products, thereby enhancing their market position within the Organic Chemicals Market.

Expanding Applications Across Industries

The versatility of organic chemicals is driving their adoption across various industries, which is a key factor in the growth of the Organic Chemicals Market. From pharmaceuticals to agriculture, organic chemicals are finding applications that enhance product performance and sustainability. For example, the use of organic solvents in the pharmaceutical industry is increasing due to their lower toxicity and environmental impact. Additionally, the agricultural sector is increasingly utilizing organic pesticides and fertilizers, which are perceived as safer alternatives. This broadening scope of applications is expected to contribute to a robust growth trajectory for the Organic Chemicals Market, as diverse sectors seek to incorporate organic solutions.

Increased Investment in Research and Development

Investment in research and development is a significant driver for the Organic Chemicals Market. Companies are recognizing the importance of innovation in maintaining competitive advantage and meeting evolving consumer demands. Increased funding for R&D initiatives is leading to the discovery of new organic compounds and improved production methods. This focus on innovation is crucial, as it allows companies to develop products that align with sustainability goals and regulatory requirements. As a result, the Organic Chemicals Market is likely to witness a surge in new product offerings and enhanced production capabilities, further solidifying its position in the broader chemical market.

Technological Innovations in Production Processes

Technological advancements are playing a crucial role in shaping the Organic Chemicals Market. Innovations in production processes, such as biocatalysis and advanced separation techniques, are enhancing efficiency and reducing costs. These technologies enable manufacturers to produce organic chemicals with lower energy consumption and waste generation. For instance, the implementation of continuous flow chemistry has been shown to improve reaction efficiency and product yield. As these technologies become more accessible, they are likely to drive the growth of the Organic Chemicals Market, allowing companies to meet the increasing demand for sustainable products while maintaining profitability.

Market Segment Insights

Organic Chemicals Market Source Insights

<p>The global organic chemicals market segmentation, based on source, includes natural and synthetic. The natural segment dominated the market, accounting for 35% of market revenue (3.95 Billion). The majority of organic compounds found in nature contain carbon. The segment's growth is projected to be fueled by the increasing emphasis on natural products and the depletion of fossil fuels.</p>

Organic Chemicals Market Distribution Type Insights

<p>The global organic chemicals market segmentation, based on type, includes <a href="https://www.marketresearchfuture.com/reports/aliphatic-hydrocarbon-market-5625">aliphatic</a>, aromatic, and carbonyl. The aromatic category generated the most income (41.2%). They are also known as arenes or aromatics. The two <a href="https://www.marketresearchfuture.com/reports/aromatic-compound-market-35105">aromatic compounds</a> that are most often used are toluene and benzene. Many are used as nonpolar solvents and chemicals for organic synthesis.</p>

Organic Chemicals Market Distribution Application Insights

<p>The global organic chemicals market segmentation, based on application, includes food and beverages, agrochemicals, pharmaceuticals, personal care, cosmetics, plastics and polymers. The food and beverages category generated the most income (36.5%). Due to the rising demand for fortified food and beverages, the food and beverage segment accounted for the largest market. Organic chemicals are frequently used in manufacturing food, beverages, and feed.&nbsp;</p>

<p>Figure 1: Organic Chemicals Market, by Application, 2024 &amp; 2032 (USD Billion)</p>

<p>Source: Secondary Research, Primary Research, Market Research Future Database, and Analyst Review</p>

Get more detailed insights about Organic Chemicals Market Research Report—Global Forecast till 2035

Regional Insights

North America : Innovation and Demand Growth

North America is the largest market for organic chemicals, holding approximately 40% of the global share. The region's growth is driven by robust demand from the automotive, construction, and consumer goods sectors. Regulatory support for sustainable practices and innovation in chemical processes further catalyzes market expansion. The U.S. and Canada are the primary contributors, with significant investments in R&D and production facilities. The competitive landscape is dominated by key players such as Dow, BASF, and LyondellBasell, which leverage advanced technologies to enhance production efficiency. The presence of established companies fosters a dynamic environment for innovation, while emerging startups are also making strides in specialty chemicals. The region's focus on sustainability and eco-friendly products is shaping future trends in the organic chemicals market.

Europe : Sustainability and Innovation Focus

Europe is a significant player in the organic chemicals market, accounting for around 30% of the global share. The region's growth is propelled by stringent environmental regulations and a strong emphasis on sustainability. Countries like Germany and France are at the forefront, driving demand for bio-based chemicals and innovative solutions that align with the European Green Deal. Regulatory frameworks are increasingly supportive of sustainable practices, enhancing market dynamics. Leading countries such as Germany, France, and the Netherlands host major chemical companies like BASF and AkzoNobel, which are investing heavily in green technologies. The competitive landscape is characterized by a mix of established firms and innovative startups focusing on sustainable products. The region's commitment to reducing carbon footprints and promoting circular economy principles is shaping the future of the organic chemicals market.

Asia-Pacific : Rapid Growth and Expansion

Asia-Pacific is rapidly emerging as a powerhouse in the organic chemicals market, holding approximately 25% of the global share. The region's growth is driven by increasing industrialization, urbanization, and rising demand from sectors such as automotive and electronics. Countries like China and India are leading this growth, supported by favorable government policies and investments in infrastructure and manufacturing capabilities. China is the largest market in the region, with significant contributions from local players and multinational corporations. The competitive landscape is marked by a mix of established companies and new entrants, focusing on innovation and cost-effective production methods. The presence of key players like Mitsubishi Chemical and SABIC further strengthens the market, as they adapt to changing consumer preferences and regulatory requirements.

Middle East and Africa : Resource-Rich and Growing Market

The Middle East and Africa region is an emerging frontier in the organic chemicals market, accounting for about 5% of the global share. The growth is primarily driven by the availability of natural resources and increasing investments in petrochemical industries. Countries like Saudi Arabia and the UAE are leading the charge, leveraging their oil and gas resources to expand chemical production capabilities and meet rising domestic and international demand. The competitive landscape is evolving, with key players such as SABIC and local firms investing in new technologies and sustainable practices. The region's focus on diversifying its economy beyond oil is fostering growth in the organic chemicals sector. As infrastructure improves and regulatory frameworks become more supportive, the market is poised for significant expansion in the coming years.

Key Players and Competitive Insights

Leading market players are investing heavily in research and development to expand their product lines, which will help the organic chemicals market, grow even more. Participants in the market are also engaging in a variety of strategic initiatives to footprint, with important market developments including new product launches, contracts, acquisitions, heftier investments, and cooperation with other parties organizations. To expand and survive in a more competitive and rising market climate, the organic chemicals industry must offer cost-effective items.

Manufacturing locally to minimize operational costs is one of the key business tactics manufacturers use in the global organic chemicals industry to benefit clients and increase the market sector. In recent years, the organic chemicals industry has offered some of the most significant advantages to medicine. Major players in the Organic Chemicals Market, Global organic chemicals market leaders include Cargill (US), Eastman Chemical Company (US), BASF SE (Germany), Koninklijke DSM N.V. (Netherlands), Royal Dutch Shell (Netherlands), PPG Industries (US), AkzoNobel (Netherlands), Sinopec (China), ExxonMobil (US), Ineos (UK), Reliance Industries (India), LyondellBasell Industries (Netherlands), and The Dow Company (US).

BASF SE is a chemical company. Chemicals, plastics, performance goods, practical solutions, agricultural solutions, and oil and gas are among the six business segments that the company engages in. In addition to offering items for these industries, BASF also offers a variety of system solutions and services. These include products for the chemical, automotive, construction, agriculture, oil, plastics, electrical, electronics, furniture, and paper sectors. A new production line for propionic acid with a capacity of 30 kilotons per year was created in May 2019 by BASF-YPC Company Limited, a joint venture between BASF and Sinopec owned equally by both companies.

Akzo Nobel N.V. manufactures specialty chemicals. The business sells decorative paints, coatings, surfactants, polymers, pulp and paper, bleaching and oxidizing, salt chlorine, and other chemical goods. Products from Akzo Nobel are available for purchase by customers worldwide. AkzoNobel, a producer of performance coatings, said in January 2018 that its facility in Los Reyes, Mexico, would be upgraded and its manufacturing capacity would be increased.

Key Companies in the Organic Chemicals Market market include

Industry Developments

August 2019: The chemical intermediates division of Huntsman Corporation will be purchased by Indorama Ventures, a Thai-based petrochemical firm, for US$ 2.1 billion.

January 2019: A joint venture between BP and Lotte called Lotte BP Chemical Company Limited has agreed to increase production capacity in Ulsan, South Korea. The factory is anticipated to raise its annual production capacity to 650 kilotons by adding a 100,000-tonne capacity for acetic acid.

November 2018: The acetic acid production at Clear Lake, Texas, will increase to 2,000 kilotons per year by the end of 2021, according to an announcement by Celanese Corporation, a multinational specialty chemicals manufacturer.

Future Outlook

Organic Chemicals Market Future Outlook

<p>The Organic Chemicals Market is projected to grow at a 6.53% CAGR from 2024 to 2035, driven by increasing demand for sustainable products and technological advancements.</p>

New opportunities lie in:

  • <p>Development of bio-based organic chemicals for eco-friendly applications.</p>
  • <p>Investment in advanced manufacturing technologies to enhance production efficiency.</p>
  • <p>Expansion into emerging markets with tailored organic chemical solutions.</p>

<p>By 2035, the Organic Chemicals Market is expected to achieve robust growth, positioning itself as a leader in sustainable chemical solutions.</p>

Market Segmentation

Organic Chemicals Market Type Outlook

  • Aliphatic
  • Aromatic
  • Carbonyl

Organic Chemicals Market Source Outlook

  • Natural
  • Synthetic

Organic Chemicals Market Application Outlook

  • Food and Beverages
  • Agrochemicals
  • Pharmaceuticals
  • Personal Care and Cosmetics
  • Plastics and Polymers

Report Scope

MARKET SIZE 202413.06(USD Billion)
MARKET SIZE 202513.91(USD Billion)
MARKET SIZE 203526.2(USD Billion)
COMPOUND ANNUAL GROWTH RATE (CAGR)6.53% (2024 - 2035)
REPORT COVERAGERevenue Forecast, Competitive Landscape, Growth Factors, and Trends
BASE YEAR2024
Market Forecast Period2025 - 2035
Historical Data2019 - 2024
Market Forecast UnitsUSD Billion
Key Companies ProfiledMarket analysis in progress
Segments CoveredMarket segmentation analysis in progress
Key Market OpportunitiesGrowing demand for sustainable and biodegradable organic chemicals in various industries presents significant market opportunities.
Key Market DynamicsRising demand for sustainable organic chemicals drives innovation and regulatory adaptations across various industries.
Countries CoveredNorth America, Europe, APAC, South America, MEA

FAQs

What is the projected market valuation of the Organic Chemicals Market by 2035?

The Organic Chemicals Market is projected to reach a valuation of 26.2 USD Billion by 2035.

What was the market valuation of the Organic Chemicals Market in 2024?

In 2024, the Organic Chemicals Market had a valuation of 13.06 USD Billion.

What is the expected CAGR for the Organic Chemicals Market during the forecast period 2025 - 2035?

The expected CAGR for the Organic Chemicals Market during the forecast period 2025 - 2035 is 6.53%.

Which companies are considered key players in the Organic Chemicals Market?

Key players in the Organic Chemicals Market include BASF, Dow, SABIC, LyondellBasell, and Eastman Chemical Company.

What are the projected valuations for natural and synthetic organic chemicals by 2035?

By 2035, natural organic chemicals are projected to reach 10.84 USD Billion, while synthetic organic chemicals may reach 15.36 USD Billion.

How do the valuations of aliphatic, aromatic, and carbonyl organic chemicals compare by 2035?

By 2035, aliphatic organic chemicals are projected at 9.0 USD Billion, aromatic at 10.0 USD Billion, and carbonyl at 7.2 USD Billion.

What applications are driving growth in the Organic Chemicals Market?

Key applications driving growth include pharmaceuticals, agrochemicals, and food and beverages, with projected valuations of 8.0, 6.0, and 5.0 USD Billion respectively by 2035.

  1. SECTION I: EXECUTIVE SUMMARY AND KEY HIGHLIGHTS
    1. EXECUTIVE SUMMARY
      1. Market Overview
      2. Key Findings
      3. Market Segmentation
      4. Competitive Landscape
      5. Challenges and Opportunities
      6. Future Outlook
  2. SECTION II: SCOPING, METHODOLOGY AND MARKET STRUCTURE
    1. MARKET INTRODUCTION
      1. Definition
      2. Scope of the study
    2. RESEARCH METHODOLOGY
      1. Overview
      2. Data Mining
      3. Secondary Research
      4. Primary Research
      5. Forecasting Model
      6. Market Size Estimation
      7. Data Triangulation
      8. Validation
  3. SECTION III: QUALITATIVE ANALYSIS
    1. MARKET DYNAMICS
      1. Overview
      2. Drivers
      3. Restraints
      4. Opportunities
    2. MARKET FACTOR ANALYSIS
      1. Value chain Analysis
      2. Porter's Five Forces Analysis
      3. COVID-19 Impact Analysis
  4. SECTION IV: QUANTITATIVE ANALYSIS
    1. Chemicals and Materials, BY Source (USD Billion)
      1. Natural
      2. Synthetic
    2. Chemicals and Materials, BY Type (USD Billion)
      1. Aliphatic
      2. Aromatic
      3. Carbonyl
    3. Chemicals and Materials, BY Application (USD Billion)
      1. Food and Beverages
      2. Agrochemicals
      3. Pharmaceuticals
      4. Personal Care and Cosmetics
      5. Plastics and Polymers
    4. Chemicals and Materials, BY Region (USD Billion)
      1. North America
      2. Europe
      3. APAC
      4. South America
      5. MEA
  5. SECTION V: COMPETITIVE ANALYSIS
    1. Competitive Landscape
      1. Overview
      2. Competitive Analysis
      3. Market share Analysis
      4. Major Growth Strategy in the Chemicals and Materials
      5. Competitive Benchmarking
      6. Leading Players in Terms of Number of Developments in the Chemicals and Materials
      7. Key developments and growth strategies
      8. Major Players Financial Matrix
    2. Company Profiles
      1. BASF (DE)
      2. Dow (US)
      3. SABIC (SA)
      4. LyondellBasell (US)
      5. Eastman Chemical Company (US)
      6. Mitsubishi Chemical Corporation (JP)
      7. AkzoNobel (NL)
      8. Solvay (BE)
      9. Covestro (DE)
      10. Huntsman Corporation (US)
    3. Appendix
      1. References
      2. Related Reports
  6. LIST OF FIGURES
    1. MARKET SYNOPSIS
    2. NORTH AMERICA MARKET ANALYSIS
    3. US MARKET ANALYSIS BY SOURCE
    4. US MARKET ANALYSIS BY TYPE
    5. US MARKET ANALYSIS BY APPLICATION
    6. CANADA MARKET ANALYSIS BY SOURCE
    7. CANADA MARKET ANALYSIS BY TYPE
    8. CANADA MARKET ANALYSIS BY APPLICATION
    9. EUROPE MARKET ANALYSIS
    10. GERMANY MARKET ANALYSIS BY SOURCE
    11. GERMANY MARKET ANALYSIS BY TYPE
    12. GERMANY MARKET ANALYSIS BY APPLICATION
    13. UK MARKET ANALYSIS BY SOURCE
    14. UK MARKET ANALYSIS BY TYPE
    15. UK MARKET ANALYSIS BY APPLICATION
    16. FRANCE MARKET ANALYSIS BY SOURCE
    17. FRANCE MARKET ANALYSIS BY TYPE
    18. FRANCE MARKET ANALYSIS BY APPLICATION
    19. RUSSIA MARKET ANALYSIS BY SOURCE
    20. RUSSIA MARKET ANALYSIS BY TYPE
    21. RUSSIA MARKET ANALYSIS BY APPLICATION
    22. ITALY MARKET ANALYSIS BY SOURCE
    23. ITALY MARKET ANALYSIS BY TYPE
    24. ITALY MARKET ANALYSIS BY APPLICATION
    25. SPAIN MARKET ANALYSIS BY SOURCE
    26. SPAIN MARKET ANALYSIS BY TYPE
    27. SPAIN MARKET ANALYSIS BY APPLICATION
    28. REST OF EUROPE MARKET ANALYSIS BY SOURCE
    29. REST OF EUROPE MARKET ANALYSIS BY TYPE
    30. REST OF EUROPE MARKET ANALYSIS BY APPLICATION
    31. APAC MARKET ANALYSIS
    32. CHINA MARKET ANALYSIS BY SOURCE
    33. CHINA MARKET ANALYSIS BY TYPE
    34. CHINA MARKET ANALYSIS BY APPLICATION
    35. INDIA MARKET ANALYSIS BY SOURCE
    36. INDIA MARKET ANALYSIS BY TYPE
    37. INDIA MARKET ANALYSIS BY APPLICATION
    38. JAPAN MARKET ANALYSIS BY SOURCE
    39. JAPAN MARKET ANALYSIS BY TYPE
    40. JAPAN MARKET ANALYSIS BY APPLICATION
    41. SOUTH KOREA MARKET ANALYSIS BY SOURCE
    42. SOUTH KOREA MARKET ANALYSIS BY TYPE
    43. SOUTH KOREA MARKET ANALYSIS BY APPLICATION
    44. MALAYSIA MARKET ANALYSIS BY SOURCE
    45. MALAYSIA MARKET ANALYSIS BY TYPE
    46. MALAYSIA MARKET ANALYSIS BY APPLICATION
    47. THAILAND MARKET ANALYSIS BY SOURCE
    48. THAILAND MARKET ANALYSIS BY TYPE
    49. THAILAND MARKET ANALYSIS BY APPLICATION
    50. INDONESIA MARKET ANALYSIS BY SOURCE
    51. INDONESIA MARKET ANALYSIS BY TYPE
    52. INDONESIA MARKET ANALYSIS BY APPLICATION
    53. REST OF APAC MARKET ANALYSIS BY SOURCE
    54. REST OF APAC MARKET ANALYSIS BY TYPE
    55. REST OF APAC MARKET ANALYSIS BY APPLICATION
    56. SOUTH AMERICA MARKET ANALYSIS
    57. BRAZIL MARKET ANALYSIS BY SOURCE
    58. BRAZIL MARKET ANALYSIS BY TYPE
    59. BRAZIL MARKET ANALYSIS BY APPLICATION
    60. MEXICO MARKET ANALYSIS BY SOURCE
    61. MEXICO MARKET ANALYSIS BY TYPE
    62. MEXICO MARKET ANALYSIS BY APPLICATION
    63. ARGENTINA MARKET ANALYSIS BY SOURCE
    64. ARGENTINA MARKET ANALYSIS BY TYPE
    65. ARGENTINA MARKET ANALYSIS BY APPLICATION
    66. REST OF SOUTH AMERICA MARKET ANALYSIS BY SOURCE
    67. REST OF SOUTH AMERICA MARKET ANALYSIS BY TYPE
    68. REST OF SOUTH AMERICA MARKET ANALYSIS BY APPLICATION
    69. MEA MARKET ANALYSIS
    70. GCC COUNTRIES MARKET ANALYSIS BY SOURCE
    71. GCC COUNTRIES MARKET ANALYSIS BY TYPE
    72. GCC COUNTRIES MARKET ANALYSIS BY APPLICATION
    73. SOUTH AFRICA MARKET ANALYSIS BY SOURCE
    74. SOUTH AFRICA MARKET ANALYSIS BY TYPE
    75. SOUTH AFRICA MARKET ANALYSIS BY APPLICATION
    76. REST OF MEA MARKET ANALYSIS BY SOURCE
    77. REST OF MEA MARKET ANALYSIS BY TYPE
    78. REST OF MEA MARKET ANALYSIS BY APPLICATION
    79. KEY BUYING CRITERIA OF CHEMICALS AND MATERIALS
    80. RESEARCH PROCESS OF MRFR
    81. DRO ANALYSIS OF CHEMICALS AND MATERIALS
    82. DRIVERS IMPACT ANALYSIS: CHEMICALS AND MATERIALS
    83. RESTRAINTS IMPACT ANALYSIS: CHEMICALS AND MATERIALS
    84. SUPPLY / VALUE CHAIN: CHEMICALS AND MATERIALS
    85. CHEMICALS AND MATERIALS, BY SOURCE, 2024 (% SHARE)
    86. CHEMICALS AND MATERIALS, BY SOURCE, 2024 TO 2035 (USD Billion)
    87. CHEMICALS AND MATERIALS, BY TYPE, 2024 (% SHARE)
    88. CHEMICALS AND MATERIALS, BY TYPE, 2024 TO 2035 (USD Billion)
    89. CHEMICALS AND MATERIALS, BY APPLICATION, 2024 (% SHARE)
    90. CHEMICALS AND MATERIALS, BY APPLICATION, 2024 TO 2035 (USD Billion)
    91. BENCHMARKING OF MAJOR COMPETITORS
  7. LIST OF TABLES
    1. LIST OF ASSUMPTIONS
    2. North America MARKET SIZE ESTIMATES; FORECAST
      1. BY SOURCE, 2025-2035 (USD Billion)
      2. BY TYPE, 2025-2035 (USD Billion)
      3. BY APPLICATION, 2025-2035 (USD Billion)
    3. US MARKET SIZE ESTIMATES; FORECAST
      1. BY SOURCE, 2025-2035 (USD Billion)
      2. BY TYPE, 2025-2035 (USD Billion)
      3. BY APPLICATION, 2025-2035 (USD Billion)
    4. Canada MARKET SIZE ESTIMATES; FORECAST
      1. BY SOURCE, 2025-2035 (USD Billion)
      2. BY TYPE, 2025-2035 (USD Billion)
      3. BY APPLICATION, 2025-2035 (USD Billion)
    5. Europe MARKET SIZE ESTIMATES; FORECAST
      1. BY SOURCE, 2025-2035 (USD Billion)
      2. BY TYPE, 2025-2035 (USD Billion)
      3. BY APPLICATION, 2025-2035 (USD Billion)
    6. Germany MARKET SIZE ESTIMATES; FORECAST
      1. BY SOURCE, 2025-2035 (USD Billion)
      2. BY TYPE, 2025-2035 (USD Billion)
      3. BY APPLICATION, 2025-2035 (USD Billion)
    7. UK MARKET SIZE ESTIMATES; FORECAST
      1. BY SOURCE, 2025-2035 (USD Billion)
      2. BY TYPE, 2025-2035 (USD Billion)
      3. BY APPLICATION, 2025-2035 (USD Billion)
    8. France MARKET SIZE ESTIMATES; FORECAST
      1. BY SOURCE, 2025-2035 (USD Billion)
      2. BY TYPE, 2025-2035 (USD Billion)
      3. BY APPLICATION, 2025-2035 (USD Billion)
    9. Russia MARKET SIZE ESTIMATES; FORECAST
      1. BY SOURCE, 2025-2035 (USD Billion)
      2. BY TYPE, 2025-2035 (USD Billion)
      3. BY APPLICATION, 2025-2035 (USD Billion)
    10. Italy MARKET SIZE ESTIMATES; FORECAST
      1. BY SOURCE, 2025-2035 (USD Billion)
      2. BY TYPE, 2025-2035 (USD Billion)
      3. BY APPLICATION, 2025-2035 (USD Billion)
    11. Spain MARKET SIZE ESTIMATES; FORECAST
      1. BY SOURCE, 2025-2035 (USD Billion)
      2. BY TYPE, 2025-2035 (USD Billion)
      3. BY APPLICATION, 2025-2035 (USD Billion)
    12. Rest of Europe MARKET SIZE ESTIMATES; FORECAST
      1. BY SOURCE, 2025-2035 (USD Billion)
      2. BY TYPE, 2025-2035 (USD Billion)
      3. BY APPLICATION, 2025-2035 (USD Billion)
    13. APAC MARKET SIZE ESTIMATES; FORECAST
      1. BY SOURCE, 2025-2035 (USD Billion)
      2. BY TYPE, 2025-2035 (USD Billion)
      3. BY APPLICATION, 2025-2035 (USD Billion)
    14. China MARKET SIZE ESTIMATES; FORECAST
      1. BY SOURCE, 2025-2035 (USD Billion)
      2. BY TYPE, 2025-2035 (USD Billion)
      3. BY APPLICATION, 2025-2035 (USD Billion)
    15. India MARKET SIZE ESTIMATES; FORECAST
      1. BY SOURCE, 2025-2035 (USD Billion)
      2. BY TYPE, 2025-2035 (USD Billion)
      3. BY APPLICATION, 2025-2035 (USD Billion)
    16. Japan MARKET SIZE ESTIMATES; FORECAST
      1. BY SOURCE, 2025-2035 (USD Billion)
      2. BY TYPE, 2025-2035 (USD Billion)
      3. BY APPLICATION, 2025-2035 (USD Billion)
    17. South Korea MARKET SIZE ESTIMATES; FORECAST
      1. BY SOURCE, 2025-2035 (USD Billion)
      2. BY TYPE, 2025-2035 (USD Billion)
      3. BY APPLICATION, 2025-2035 (USD Billion)
    18. Malaysia MARKET SIZE ESTIMATES; FORECAST
      1. BY SOURCE, 2025-2035 (USD Billion)
      2. BY TYPE, 2025-2035 (USD Billion)
      3. BY APPLICATION, 2025-2035 (USD Billion)
    19. Thailand MARKET SIZE ESTIMATES; FORECAST
      1. BY SOURCE, 2025-2035 (USD Billion)
      2. BY TYPE, 2025-2035 (USD Billion)
      3. BY APPLICATION, 2025-2035 (USD Billion)
    20. Indonesia MARKET SIZE ESTIMATES; FORECAST
      1. BY SOURCE, 2025-2035 (USD Billion)
      2. BY TYPE, 2025-2035 (USD Billion)
      3. BY APPLICATION, 2025-2035 (USD Billion)
    21. Rest of APAC MARKET SIZE ESTIMATES; FORECAST
      1. BY SOURCE, 2025-2035 (USD Billion)
      2. BY TYPE, 2025-2035 (USD Billion)
      3. BY APPLICATION, 2025-2035 (USD Billion)
    22. South America MARKET SIZE ESTIMATES; FORECAST
      1. BY SOURCE, 2025-2035 (USD Billion)
      2. BY TYPE, 2025-2035 (USD Billion)
      3. BY APPLICATION, 2025-2035 (USD Billion)
    23. Brazil MARKET SIZE ESTIMATES; FORECAST
      1. BY SOURCE, 2025-2035 (USD Billion)
      2. BY TYPE, 2025-2035 (USD Billion)
      3. BY APPLICATION, 2025-2035 (USD Billion)
    24. Mexico MARKET SIZE ESTIMATES; FORECAST
      1. BY SOURCE, 2025-2035 (USD Billion)
      2. BY TYPE, 2025-2035 (USD Billion)
      3. BY APPLICATION, 2025-2035 (USD Billion)
    25. Argentina MARKET SIZE ESTIMATES; FORECAST
      1. BY SOURCE, 2025-2035 (USD Billion)
      2. BY TYPE, 2025-2035 (USD Billion)
      3. BY APPLICATION, 2025-2035 (USD Billion)
    26. Rest of South America MARKET SIZE ESTIMATES; FORECAST
      1. BY SOURCE, 2025-2035 (USD Billion)
      2. BY TYPE, 2025-2035 (USD Billion)
      3. BY APPLICATION, 2025-2035 (USD Billion)
    27. MEA MARKET SIZE ESTIMATES; FORECAST
      1. BY SOURCE, 2025-2035 (USD Billion)
      2. BY TYPE, 2025-2035 (USD Billion)
      3. BY APPLICATION, 2025-2035 (USD Billion)
    28. GCC Countries MARKET SIZE ESTIMATES; FORECAST
      1. BY SOURCE, 2025-2035 (USD Billion)
      2. BY TYPE, 2025-2035 (USD Billion)
      3. BY APPLICATION, 2025-2035 (USD Billion)
    29. South Africa MARKET SIZE ESTIMATES; FORECAST
      1. BY SOURCE, 2025-2035 (USD Billion)
      2. BY TYPE, 2025-2035 (USD Billion)
      3. BY APPLICATION, 2025-2035 (USD Billion)
    30. Rest of MEA MARKET SIZE ESTIMATES; FORECAST
      1. BY SOURCE, 2025-2035 (USD Billion)
      2. BY TYPE, 2025-2035 (USD Billion)
      3. BY APPLICATION, 2025-2035 (USD Billion)
    31. PRODUCT LAUNCH/PRODUCT DEVELOPMENT/APPROVAL
    32. ACQUISITION/PARTNERSHIP

Organic Chemicals Source Outlook (USD Billion, 2018-2032)

Natural

Synthetic

Organic Chemicals Type Outlook (USD Billion, 2018-2032)

Aliphatic

Aromatic

Carbonyl

Organic Chemicals Application Outlook (USD Billion, 2018-2032)

Food And Beverages

Agrochemicals

Pharmaceuticals

Personal Care And Cosmetics

Plastics And Polymers

Organic Chemicals Regional Outlook (USD Billion, 2018-2032)

North America Outlook (USD Billion, 2018-2032)

North America Organic Chemicals by Source

Natural

Synthetic

Submarine

North America Organic Chemicals by Type

Aliphatic

Aromatic

Carbonyl

Clamps

Conductors

Others

North America Organic Chemicals by Application

Food And Beverages

Agrochemicals

Pharmaceuticals

Personal Care And Cosmetics

Plastics And Polymers

US Outlook (USD Billion, 2018-2032)

US Organic Chemicals by Source

Natural

Synthetic

Submarine

US Organic Chemicals by Type

Aliphatic

Aromatic

Carbonyl

Clamps

Conductors

Others

US Organic Chemicals by Application

Food And Beverages

Agrochemicals

Pharmaceuticals

Personal Care And Cosmetics

Plastics And Polymers

CANADA Outlook (USD Billion, 2018-2032)

CANADA Organic Chemicals by Source

Natural

Synthetic

Submarine

CANADA Organic Chemicals by Type

Aliphatic

Aromatic

Carbonyl

Clamps

Conductors

Others

CANADA Organic Chemicals by Application

Food And Beverages

Agrochemicals

Pharmaceuticals

Personal Care And Cosmetics

Plastics And Polymers

Europe Outlook (USD Billion, 2018-2032)

Europe Organic Chemicals by Source

Natural

Synthetic

Submarine

Europe Organic Chemicals by Type

Aliphatic

Aromatic

Carbonyl

Clamps

Conductors

Others

Europe Organic Chemicals by Application

Food And Beverages

Agrochemicals

Pharmaceuticals

Personal Care And Cosmetics

Plastics And Polymers

Germany Outlook (USD Billion, 2018-2032)

Germany Organic Chemicals by Source

Natural

Synthetic

Submarine

Germany Organic Chemicals by Type

Aliphatic

Aromatic

Carbonyl

Clamps

Conductors

Others

Germany Organic Chemicals by Application

Food And Beverages

Agrochemicals

Pharmaceuticals

Personal Care And Cosmetics

Plastics And Polymers

France Outlook (USD Billion, 2018-2032)

France Organic Chemicals by Source

Natural

Synthetic

Submarine

France Organic Chemicals by Type

Aliphatic

Aromatic

Carbonyl

Clamps

Conductors

Others

France Organic Chemicals by Application

Food And Beverages

Agrochemicals

Pharmaceuticals

Personal Care And Cosmetics

Plastics And Polymers

UK Outlook (USD Billion, 2018-2032)

UK Organic Chemicals by Source

Natural

Synthetic

Submarine

UK Organic Chemicals by Type

Aliphatic

Aromatic

Carbonyl

Clamps

Conductors

Others

UK Organic Chemicals by Application

Food And Beverages

Agrochemicals

Pharmaceuticals

Personal Care And Cosmetics

Plastics And Polymers

ITALY Outlook (USD Billion, 2018-2032)

ITALY Organic Chemicals by Source

Natural

Synthetic

Submarine

ITALY Organic Chemicals by Type

Aliphatic

Aromatic

Carbonyl

Clamps

Conductors

Others

ITALY Organic Chemicals by Application

Food And Beverages

Agrochemicals

Pharmaceuticals

Personal Care And Cosmetics

Plastics And Polymers

SPAIN Outlook (USD Billion, 2018-2032)

Spain Organic Chemicals by Source

Natural

Synthetic

Submarine

Spain Organic Chemicals by Type

Aliphatic

Aromatic

Carbonyl

Clamps

Conductors

Others

Spain Organic Chemicals by Application

Food And Beverages

Agrochemicals

Pharmaceuticals

Personal Care And Cosmetics

Plastics And Polymers

Rest Of Europe Outlook (USD Billion, 2018-2032)

Rest Of Europe Organic Chemicals by Source

Natural

Synthetic

Submarine

REST OF EUROPE Organic Chemicals by Type

Aliphatic

Aromatic

Carbonyl

Clamps

Conductors

Others

REST OF EUROPE Organic Chemicals by Application

Food And Beverages

Agrochemicals

Pharmaceuticals

Personal Care And Cosmetics

Plastics And Polymers

Asia-Pacific Outlook (USD Billion, 2018-2032)

Asia-Pacific Organic Chemicals by Source

Natural

Synthetic

Submarine

Asia-Pacific Organic Chemicals by Type

Aliphatic

Aromatic

Carbonyl

Clamps

Conductors

Others

Asia-Pacific Organic Chemicals by Application

Food And Beverages

Agrochemicals

Pharmaceuticals

Personal Care And Cosmetics

Plastics And Polymers

China Outlook (USD Billion, 2018-2032)

China Organic Chemicals by Source

Natural

Synthetic

Submarine

China Organic Chemicals by Type

Aliphatic

Aromatic

Carbonyl

Clamps

Conductors

Others

China Organic Chemicals by Application

Food And Beverages

Agrochemicals

Pharmaceuticals

Personal Care And Cosmetics

Plastics And Polymers

Japan Outlook (USD Billion, 2018-2032)

Japan Organic Chemicals by Source

Natural

Synthetic

Submarine

Japan Organic Chemicals by Type

Aliphatic

Aromatic

Carbonyl

Clamps

Conductors

Others

Japan Organic Chemicals by Application

Food And Beverages

Agrochemicals

Pharmaceuticals

Personal Care And Cosmetics

Plastics And Polymers

India Outlook (USD Billion, 2018-2032)

India Organic Chemicals by Source

Natural

Synthetic

Submarine

India Organic Chemicals by Type

Aliphatic

Aromatic

Carbonyl

Clamps

Conductors

Others

India Organic Chemicals by Application

Food And Beverages

Agrochemicals

Pharmaceuticals

Personal Care And Cosmetics

Plastics And Polymers

Australia Outlook (USD Billion, 2018-2032)

Australia Organic Chemicals by Source

Natural

Synthetic

Submarine

Australia Organic Chemicals by Type

Aliphatic

Aromatic

Carbonyl

Clamps

Conductors

Others

Australia Organic Chemicals by Application

Food And Beverages

Agrochemicals

Pharmaceuticals

Personal Care And Cosmetics

Plastics And Polymers

Rest of Asia-Pacific Outlook (USD Billion, 2018-2032)

Rest of Asia-Pacific Organic Chemicals by Source

Natural

Synthetic

Submarine

Rest of Asia-Pacific Organic Chemicals by Type

Aliphatic

Aromatic

Carbonyl

Clamps

Conductors

Others

Rest of Asia-Pacific Organic Chemicals by Application

Food And Beverages

Agrochemicals

Pharmaceuticals

Personal Care And Cosmetics

Plastics And Polymers

Rest of the World Outlook (USD Billion, 2018-2032)

Rest of the World Organic Chemicals by Source

Natural

Synthetic

Submarine

Rest of the World Organic Chemicals by Type

Aliphatic

Aromatic

Carbonyl

Clamps

Conductors

Others

Rest of the World Organic Chemicals by Application

Food And Beverages

Agrochemicals

Pharmaceuticals

Personal Care And Cosmetics

Plastics And Polymers

Middle East Outlook (USD Billion, 2018-2032)

Middle East Organic Chemicals by Source

Natural

Synthetic

Submarine

Middle East Organic Chemicals by Type

Aliphatic

Aromatic

Carbonyl

Clamps

Conductors

Others

Middle East Organic Chemicals by Application

Food And Beverages

Agrochemicals

Pharmaceuticals

Personal Care And Cosmetics

Plastics And Polymers

Africa Outlook (USD Billion, 2018-2032)

Africa Organic Chemicals by Source

Natural

Synthetic

Submarine

Africa Organic Chemicals by Type

Aliphatic

Aromatic

Carbonyl

Clamps

Conductors

Others

Africa Organic Chemicals by Application

Food And Beverages

Agrochemicals

Pharmaceuticals

Personal Care And Cosmetics

Plastics And Polymers

Latin America Outlook (USD Billion, 2018-2032)

Latin America Organic Chemicals by Source

Natural

Synthetic

Submarine

Latin America Organic Chemicals by Type

Aliphatic

Aromatic

Carbonyl

Clamps

Conductors

Others

Latin America Organic Chemicals by Application

Food And Beverages

Agrochemicals

Pharmaceuticals

Personal Care And Cosmetics

Plastics And Polymers

Infographic

Free Sample Request

Kindly complete the form below to receive a free sample of this Report

Get Free Sample

Customer Strories

“I am very pleased with how market segments have been defined in a relevant way for my purposes (such as "Portable Freezers & refrigerators" and "last-mile"). In general the report is well structured. Thanks very much for your efforts.”

Victoria Milne

Founder

Compare Licence

×
Features License Type
Single User Multiuser License Enterprise User
Price $4,950 $5,950 $7,250
Maximum User Access Limit 1 User Upto 10 Users Unrestricted Access Throughout the Organization
Free Customization
Direct Access to Analyst
Deliverable Format
Platform Access
Discount on Next Purchase 10% 15% 15%
Printable Versions