Pain management devices Market (2026 - 2035)

Pain Management Devices Market Research Report: Size, Share, Trend Analysis By Device Type (Stimulators, Analgesics Delivery Devices, Cryotherapy Devices, Radiofrequency Ablation Devices), By Therapeutic Area (Chronic Pain, Acute Pain, Postoperative Pain, Cancer Pain), By End Users (Hospitals, Home Care Settings, Ambulatory Surgical Centers, Physical Therapy Clinics), By Technology (Transcutaneous Electrical Nerve Stimulator, Intrathecal Drug Delivery Systems, Cryoablation Technology, Radiofrequency Technology) and By Regional (North America, Europe, South America, Asia Pacific, Middle East and Africa) - Growth Outlook & Industry Forecast Till 2035

Forecast Period
2026-2035
CAGR
10.1%
2025 Market Size
USD 12.34 Billion
2035 Market Size
USD 32.21 Billion
Healthcare ● Updated August 24, 2026 Report ID: MRFR/HC/0975-HCR | Pages: 200 | Author: Nidhi Mandole, Rahul Gotadki

Pain management devices Market Summary

The Pain Management Devices Market reached USD 12.34 billion in 2025 and is projected to grow to USD 32.21 billion by 2035, expanding at a compound annual growth rate (CAGR) of 10.1% between 2026 and 2035. Market value is expected to reach USD 13.55 billion in 2026 as the first year of the forecast period. This growth is being driven primarily by sustained federal investment in non-opioid pain science and stabilized U.S. reimbursement for device-based procedures, alongside a broader technology shift toward sensor-based, closed-loop pain management systems.

The U.S. National Institutes of Health (NIH) HEAL Initiative has committed more than USD 4 billion since 2018 to non-opioid pain science, much of it flowing toward device-based therapy development. This funding has directly accelerated the clinical pipeline for neurostimulation and ablation technologies. At the same time, reimbursement has caught up with the technology: the Centers for Medicare & Medicaid Services (CMS) now assigns stable facility payment to percutaneous ablation and neurostimulation implants, removing the pricing ambiguity that had previously stalled hospital adoption of these devices.

Technology is also reshaping the pain management device landscape. Fixed-stimulation, open-loop implants that do not account for patient position are being replaced by sensor-based systems that measure evoked compound action potentials and modulate output thousands of times per second. At the same time, legacy volumetric infusion pumps are being replaced with dose-error-reduction platforms featuring wireless formulary updates; Baxter alone has invested considerably in its Novum IQ line since receiving FDA certification.

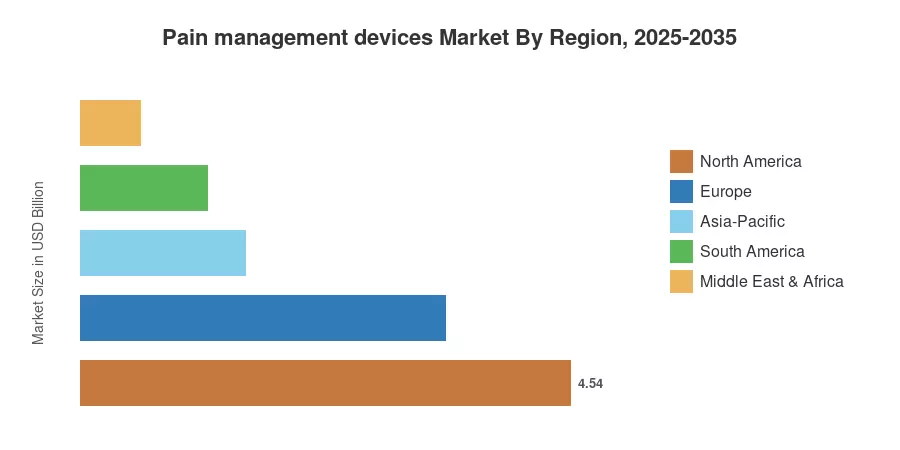
By region, North America holds the largest share of the Pain Management Devices Market, at around 36.8%, supported by the deepest implant reimbursement base in the world. Asia-Pacific is the fastest-growing region, with a projected CAGR of 12.4% through 2035. Europe holds the second-largest position, with more than USD 3.38 billion in 2025 revenue, driven by NICE-directed monitoring of long-term opioid prescribing in the United Kingdom. Over the next decade, market leadership is expected to belong to companies that can combine hardware accuracy with credible clinical outcomes data.


Key Report Takeaways

• By Product Type

  • Neurostimulation devices command 55.2% of Pain Management Devices Market revenue, the single largest product concentration in the study.
  • Ablation devices post the strongest product-level growth at an 11.8% CAGR through 2035
  • Infusion pumps generated approximately USD 3.41 billion in 2025

• By Application

  • Musculoskeletal indications account for 38.4% of demand across the Pain Management Devices Market.
  • Neuropathic pain applications expand at a 10.9% CAGR, the fastest application-level rate.
  • Cancer pain contributed roughly USD 2.31 billion in 2025

• By Geography

Market Size and Forecast (2021–2035)

The figures below are based on aggregated audited device segment disclosures from public filings, national procedure volume registries, hospital capital spend surveys and distributor channel inspections in 41 countries. Historical years are reconciled to reported revenue; projected years are based on procedure-volume elasticity against reimbursement and implant penetration assumptions.
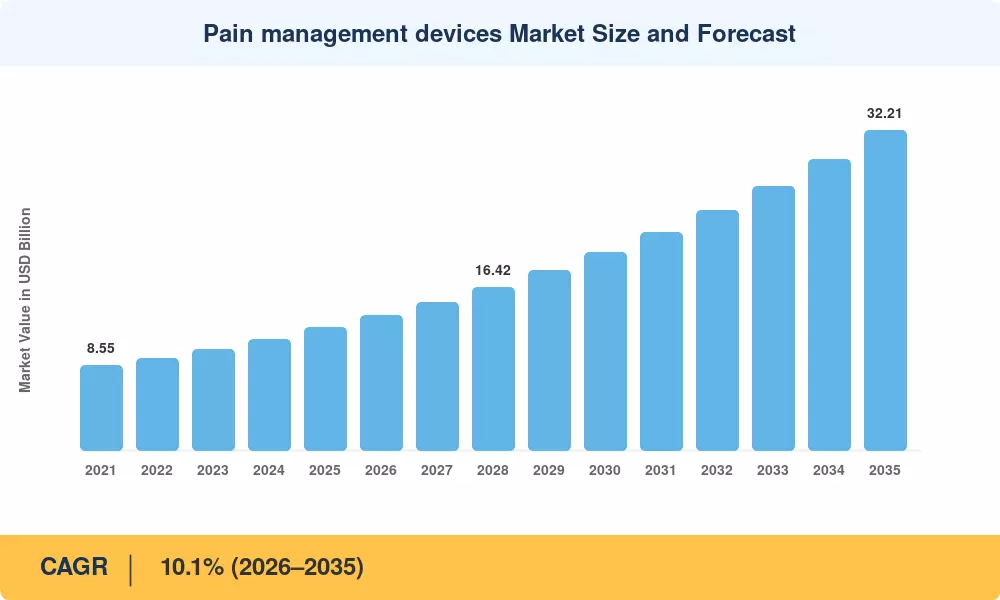
Pain management devices Market Size and Forecast
Our Impact
Enabled $4.3B Revenue Impact for Fortune 500 and Leading Multinationals
Partnering with 2000+ Global Organizations Each Year
30K+ Citations by Top-Tier Firms in the Industry

Driver Impact Analysis

Driver ~% Impact on CAGR Geographic Relevance Impact Timeline
Opioid-reduction policy and prescribing limits 2.4 North America, Europe Short-term (≤2 yr)
Aging population and osteoarthritis burden 2.1 Global Long-term (≥4 yr)
Closed-loop and sensing-enabled implants 1.8 North America, Europe Medium-term (2–4 yr)
Reimbursement expansion for ablation 1.5 North America Short-term (≤2 yr)
Ambulatory surgical center migration 1.2 North America, Asia-Pacific Medium-term (2–4 yr)
Asia-Pacific hospital infrastructure spend 1.1 Asia-Pacific Long-term (≥4 yr)
Infusion safety mandates and pump replacement 0.9 Global Medium-term (2–4 yr)


Opioid-Reduction Policy as Demand Engine

Prescribing reform reshaped clinical pathways faster than any technology cycle. CDC surveillance places chronic pain prevalence among U.S. adults at roughly 24.3%, with about 8.5% reporting high-impact chronic pain that limits daily activity [3]. When guideline pressure pushed clinicians away from long-term opioid therapy, interventional referrals absorbed the overflow, and device manufacturers captured procedures that previously never left the pharmacy. The NIH HEAL Initiative's multi-billion-dollar commitment reinforced the shift by funding comparative-effectiveness evidence that payers now cite in coverage determinations [5].

Demographic Weight of Musculoskeletal Disease

WHO estimates that roughly 1.71 billion people live with musculoskeletal conditions globally, with low back pain the single largest contributor to years lived with disability [4]. Populations over 65 in Japan, Italy and Germany already exceed 22%, and each additional decade of life raises implant candidacy materially. Growth in the Pain Management Devices Market therefore carries an unusually durable demographic floor — demand does not depend on discretionary spending cycles.

Closed-Loop Feedback and Device Differentiation

Sensing changed the competitive question from "how much stimulation" to "how well controlled." Devices that measure neural response and titrate output in real time — a category FDA has cleared through multiple premarket approvals since 2022 — report higher responder rates in pivotal trials than fixed-output predecessors [1]. Manufacturers now compete on algorithm quality and data capture, not pulse generator size, which raises switching costs and lengthens the useful life of installed platforms.

Reimbursement Clarity in Interventional Procedures

Payment stability matters more than payment level. CMS fee-schedule treatment of percutaneous ablation and neurostimulation trials gave hospital finance committees the predictability they needed to approve capital [2]. Facilities that once treated implant programs as loss leaders now model contribution margin, and that reframing accelerated purchasing across the Pain Management Devices Market throughout 2024 and 2025.


Restraints Impact Analysis

Restraint weightings reflect analyst assessment of drag on realized growth. They are directional indicators, not subtractive inputs to the headline CAGR.

Restraint ~% Drag on CAGR Geographic Relevance Impact Timeline
High implant and procedure cost -1.6 Emerging markets Long-term (≥4 yr)
EU MDR recertification burden -1.1 Europe Medium-term (2–4 yr)
Explant, revision and lead migration rates -0.9 Global Medium-term (2–4 yr)
Shortage of trained interventional specialists -0.8 Asia-Pacific, MEA Long-term (≥4 yr)
Infusion pump recall and safety scrutiny -0.6 North America, Europe Short-term (≤2 yr)


Cost Barriers Outside High-Income Systems

A spinal implant system plus procedure can exceed USD 30,000 in the United States, and even heavily discounted emerging-market pricing sits far above what most out-of-pocket payers can absorb. World Bank data show health expenditure below 4% of GDP across much of South Asia and Sub-Saharan Africa [14]. Until tiered pricing and local manufacturing mature, volume in these geographies stays concentrated in private tertiary centers.

Regulatory Recertification Drag in Europe

Transitioning legacy CE marks under Regulation (EU) 2017/745 consumed notified-body capacity and forced manufacturers to rebuild clinical evidence files for products already in routine use [12]. Several mid-tier suppliers rationalized catalogs rather than fund recertification, thinning choice for European buyers. The bottleneck eases across 2027–2028, but it has already deferred launch timelines by 12 to 24 months for a meaningful slice of the Pain Management Devices Market.

Revision Burden and Clinical Confidence

Lead migration, infection and loss of efficacy still drive revision surgeries at rates clinicians consider non-trivial, and IASP working groups continue to flag heterogeneous long-term outcome reporting as a barrier to guideline strength [6]. Every revision erodes referral confidence and hands payers an argument for prior authorization.


Pain management devices Market Opportunities

Ambulatory and Office-Based Procedure Migration

Shifting trials and permanent implants out of hospital operating rooms compresses cost per case by an estimated 30–40% while freeing inpatient capacity. Payment policy already supports the move [2], and vendors that package sterile disposables, imaging compatibility and streamlined programming for smaller sites will capture the fastest-turning accounts.

India and Southeast Asia Capacity Build-Out

India's regulatory framework under CDSCO has progressively brought neurostimulation and infusion devices into a defined risk-class system, giving multinationals a clearer registration path [17]. Combined with rapid private hospital chain expansion, this creates a genuine white-space opportunity: procedure penetration per million population remains under one-tenth of North American levels.

Longitudinal Data as a Revenue Stream

Implants now generate continuous therapy-usage telemetry. Manufacturers can convert that into outcomes-linked contracting, remote-programming subscriptions and real-world evidence packages sold to payers and pharmaceutical partners. Opioid-sparing care pathways become auditable, which is precisely what value-based contracts require.

Cancer Pain and Intrathecal Delivery Expansion

Rising survivorship extends the duration of cancer-related pain management. Intrathecal drug delivery, historically underused, offers dose reduction of one to two orders of magnitude versus systemic administration. Oncology networks integrating palliative pathways represent an addressable pocket the Pain Management Devices Market has not yet fully monetized.

Non-Invasive and Wearable Adjuncts

Transcutaneous and peripheral nerve stimulation wearables occupy the gap between pharmacotherapy and implantation. Lower regulatory friction and direct-to-consumer channels shorten payback, and successful wearable users convert into implant candidates at higher rates — an effective funnel for premium portfolios.


Pain management devices Market Future Outlook

Algorithmic Therapy Management

By 2030, most premium implants will run adaptive algorithms that adjust stimulation against posture, activity and neural feedback without clinician intervention. Manufacturers will ship model updates over the air the way software firms ship releases, and regulatory frameworks for predetermined change control plans — already piloted by FDA — will determine how fast that cadence can move [1].

Outcomes-Linked Commercial Models

Payers increasingly want risk shared. Expect warranty structures where a portion of implant price is contingent on documented pain-score improvement at 12 months, underwritten by device telemetry. OECD analysis of value-based procurement in health systems shows steady adoption momentum across member states [13], and pain devices are unusually well suited because outcomes are measurable and continuously captured.

Miniaturization and Battery Economics

Rechargeable pulse generators already exceed 10-year service life, and next-generation devices target smaller implant footprints with wireless power. Longer intervals between replacement surgeries reduce lifetime revenue per patient — a genuine tension for incumbents — but expand the eligible population by lowering surgical burden. Net effect on the Pain Management Devices Market is expansionary through 2035.

Evidence Standardization and Guideline Convergence

IASP and national bodies are converging on common outcome instruments for interventional pain therapy [6]. Standardized reporting will separate genuinely differentiated platforms from marketing claims, likely consolidating share toward the four or five vendors with the deepest randomized evidence. Guideline convergence will also accelerate coverage decisions in Europe and Asia-Pacific.


Pain management devices Market Segmentation

By Product Type

Segment Metric (2025) Primary Demand Driver
Neurostimulation Devices 55.2% share Closed-loop clinical superiority
Infusion Pumps USD 3.41 Billion Safety-mandated fleet replacement
Ablation Devices 11.8% CAGR Reimbursed vertebrogenic indications


Neurostimulation anchors the Pain Management Devices Market because it addresses the largest refractory population and carries the highest average selling price. Spinal cord stimulation dominates within the category, though dorsal root ganglion and peripheral nerve stimulation are taking share in focal indications. Ablation is the growth story: radiofrequency and basivertebral nerve procedures are shorter, cheaper and increasingly performed outside hospitals, which compounds volume faster than implant categories can match.

By Application

Segment Metric (2025) Primary Demand Driver
Musculoskeletal 38.4% share Low back pain prevalence
Neuropathic Pain 10.9% CAGR Diabetic neuropathy incidence
Cancer Pain USD 2.31 Billion Survivorship duration
Facial Pain & Migraine 11.3% share Neuromodulation adjuncts
Others 7.5% share Post-surgical and visceral pain


Musculoskeletal indications dominate for the simplest reason — low back pain is the world's leading cause of disability [19]. Neuropathic applications grow faster, tracking global diabetes prevalence and the painful diabetic neuropathy population that fixed-output devices historically served poorly.

By End-User

Segment Metric (2025) Primary Demand Driver
Hospitals and Clinics 58.6% share Implant surgical infrastructure
Physiotherapy Centers 22.9% share Non-invasive modality adoption
Others 12.4% CAGR ASC and home-care migration


Hospitals retain the majority because permanent implantation still requires surgical suites and imaging. The "Others" bucket — ambulatory surgical centers and home care — is where the Pain Management Devices Market is structurally shifting, driven by cost pressure and patient preference for same-day discharge.


Regional Market Share Analysis

Region Metric (2025) Primary Investment Themes
North America 36.8% share Closed-loop implants, ASC migration
Europe USD 3.38 Billion MDR compliance, opioid stewardship
Asia-Pacific 12.4% CAGR Capacity build-out, local manufacturing
South America 9.6% CAGR Private hospital expansion
Middle East & Africa 4.5% share Tertiary center investment
Total USD 12.34 Billion

Regional performance across the Pain Management Devices Market reflects three variables: implant reimbursement depth, interventional specialist density, and hospital capital availability.


North America

Country Metric Key Driver
US 87.4% of region Medicare coverage breadth
Canada USD 0.38 Billion Provincial procedure funding
Mexico 10.2% CAGR Private insurance penetration


American demand rests on a reimbursement architecture no other market matches. CMS fee-schedule stability, combined with commercial payer alignment on ablation for vertebrogenic and sacroiliac pain, converted experimental procedures into standard practice within three years [2]. Canada moves slower — provincial budgets ration implant volumes — while Mexico's growth comes almost entirely from private tertiary networks in Mexico City, Monterrey and Guadalajara.

Europe

Country Metric Key Driver
Germany 24.1% of region DRG-funded implant volumes
UK USD 0.61 Billion NHS elective recovery programme
France 15.3% of region Sécurité Sociale coverage
Italy USD 0.36 Billion Aging population burden
Spain 8.9% CAGR Regional health service tenders
Nordic Countries 7.4% of region Digital health integration
Russia 6.2% of region Domestic substitution policy
Rest of Europe 9.1% CAGR CEE capacity expansion


Britain's approach illustrates the European pattern. NICE guideline NG193 discouraged initiating long-term opioids for chronic primary pain, redirecting patients toward interventional and multidisciplinary pathways [15], while NHS England's elective recovery funding created procedural capacity to absorb them [18]. Germany's DRG system remains the region's most reliable implant funder.

Asia-Pacific

Country Metric Key Driver
China 31.6% of region Provincial procurement reform
India 14.2% CAGR Private hospital chain growth
Japan USD 0.74 Billion Aging demographic profile
South Korea 11.8% of region Reimbursement listing speed
ASEAN 13.1% CAGR Medical tourism corridors
Rest of Asia-Pacific 6.4% of region Tertiary care investment


Japan's PMDA has accelerated approvals for neurostimulation platforms already cleared elsewhere, shortening lag from years to months [16]. China's volume-based procurement cuts unit pricing but multiplies units, and multinationals that localize manufacturing preserve margin. India remains the region's steepest growth curve, and it is where the Pain Management Devices Market has the widest gap between clinical need and installed capacity.

South America

Country Metric Key Driver
Brazil 61.3% of region ANVISA registration throughput
Argentina USD 0.11 Billion Private clinic demand
Rest of South America 8.7% CAGR Chile and Colombia expansion


Brazilian supplementary health plans fund the overwhelming majority of implants, and São Paulo's concentration of interventional pain fellowships gives the country a specialist base its neighbors lack. Currency volatility remains the principal commercial risk, pushing vendors toward local-currency contracting and consignment inventory models.

Middle East & Africa

Country Metric Key Driver
Saudi Arabia 32.8% of region Vision 2030 health investment
UAE USD 0.13 Billion Medical tourism positioning
South Africa 15.4% of region Private hospital groups
Egypt 9.8% CAGR Universal health insurance rollout
Rest of MEA 11.2% of region Gulf tertiary care build-out


Saudi Arabia's health-sector transformation programme funds specialty centers with explicit interventional pain capability, and SFDA guidance has streamlined device registration for products holding FDA or CE approval [21]. Across the rest of the region, penetration tracks private insurance coverage almost linearly.


Pain management devices Market By Region, 2025-2035

Competitive Benchmarking

Concentration falls in the moderate band with estimated HHI of between 950 and 1,100 and top-five revenue share of approximately 56%–61%. Three implant specialists run the high-value neurostimulation core; infusion is divided among varied hospital-supply firms. A vast tail of ablation and wearable specialists under the leaders maintains the entire system competitive, not oligopolistic.

Company Est. Revenue Share Range Key Offerings for Pain Management Devices Market Strategic Positioning
Medtronic plc ~17–21% SCS systems, intrathecal drug delivery pumps Broadest implant portfolio; scale advantage [7]
Abbott Laboratories ~12–15% SCS, DRG stimulation, radiofrequency ablation Strong neuromodulation depth [8]
Boston Scientific ~11–14% SCS platforms, basivertebral ablation Aggressive acquisition-led expansion [9]
Baxter International ~7–9% Smart infusion pumps, PCA systems Infusion safety leadership [11]
B. Braun SE ~5–7% Infusion systems, regional anesthesia Strong European hospital base
Becton Dickinson ~4–6% Infusion pumps, dose-error reduction software Integrated medication management
Globus Medical (Nevro) ~3–5% High-frequency SCS platforms Spine-plus-neuromodulation bundling [10]
Stryker Corporation ~3–5% Radiofrequency ablation, interventional spine Procedure-adjacent portfolio pull-through
Avanos Medical ~2–4% Cooled RF ablation, nerve blocks Focused interventional specialist
ICU Medical ~2–4% Infusion pumps and consumables Post-integration channel scale
Saluda Medical ~1–2% Closed-loop evoked-compound-action-potential SCS Evidence-led premium challenger


Recent News & Developments

  • Boston Scientific (November 2023): Completed acquisition of Relievant Medsystems, adding basivertebral nerve ablation for vertebrogenic low back pain and opening an entirely new reimbursed procedure category [9]
  • Medtronic (April 2024): Received FDA approval for a rechargeable closed-loop spinal cord stimulation system using evoked-response sensing, its most significant neuromodulation launch of the decade [1][7]
  • Stryker (2024): Acquired Vertos Medical, bringing a minimally invasive lumbar spinal stenosis procedure into its interventional spine portfolio and reinforcing ambulatory-site strategy
  • Baxter International (2024): Advanced U.S. rollout of its next-generation large-volume infusion platform following FDA clearance, targeting replacement of aging hospital pump fleets [11]
  • Globus Medical (April 2025): Closed its acquisition of Nevro, combining high-frequency stimulation technology with a large spine surgery channel and reshaping mid-tier competitive dynamics [10]
  • European Commission (2024–2025): Extended MDR transition deadlines for legacy devices, easing near-term supply disruption while preserving the recertification requirement [12]
  • CMS (November 2025): Finalized physician fee schedule provisions maintaining payment stability for percutaneous ablation and neurostimulation trial procedures [2]
  • NIH HEAL Initiative (2025): Expanded funding for non-opioid pain device trials, including pragmatic comparative-effectiveness studies designed for payer evidence needs [5]


Pain management devices Market Report Scope

Parameter Detail
Market Scope Global Pain Management Devices Market by product type, application, end-user and geography
Study Period 2021–2035 (Historical 2021–2024; Base Year 2025; Forecast 2026–2035)
CAGR 10.1% (2026–2035)
Market Size Checkpoints USD 12.34 Billion (2025); USD 13.55 Billion (2026); USD 32.21 Billion (2035)
Fastest Growing Segments Ablation Devices (product); Neuropathic Pain (application); Others – ASC/Home Care (end-user)
Companies Profiled 11 major players including Medtronic, Abbott, Boston Scientific, Baxter, B. Braun, BD, Globus Medical, Stryker, Avanos, ICU Medical, Saluda Medical
Valuation Currency USD (Billion), constant 2025 exchange rates

FAQs

What due diligence should investors run before backing a neuromodulation startup?
Verify randomized evidence quality and payer coverage pathway first — device clearance without reimbursement produces no revenue. Check freedom-to-operate against incumbent patent estates, which are dense in this field [1].
How do hospitals typically structure procurement in the Pain Management Devices Market?
Most large systems use multi-year committed-volume agreements tied to implant families, with pricing tiers triggered by annual unit thresholds. Consignment inventory and physician-preference carve-outs remain common negotiation points [7].
What distinguishes closed-loop stimulation from conventional open-loop systems in practice?
Feedback-driven devices measure neural response and adjust output continuously, maintaining therapy through posture changes. Open-loop systems deliver fixed parameters, which often requires patient-initiated reprogramming [1].
Which integration challenges arise when adding smart infusion pumps to hospital IT?
Interoperability with the electronic health record and drug library synchronization consume most implementation effort. Facilities routinely underestimate pharmacy time required to build and validate formulary datasets [11].
How should buyers in the Pain Management Devices Market assess total cost of ownership?
Model replacement surgery intervals, programming visit frequency, and revision rates alongside device price. Rechargeable systems cost more upfront but frequently reduce ten-year cost per patient [7].
What regulatory nuance affects software updates to implanted devices?
Manufacturers increasingly submit predetermined change control plans so algorithm updates can ship without new premarket submissions. Regions differ on acceptance, which fragments global release schedules [1][12].
Where is the Pain Management Devices Market seeing genuinely new clinical use cases?
Peripheral nerve stimulation for post-surgical and post-amputation pain is expanding fastest among emerging indications. Temporary 60-day implant protocols are drawing referrals that never previously reached interventional clinics [5].      
Author
Author
Author Profile
Nidhi Mandole LinkedIn
Senior Research Analyst
She is an extremely curious individual currently working in Healthcare and Medical Devices Domain. Nidhi is comfortably versed in data centric research backed by healthcare educational background. She leverages extensive data mining and analytics tools such as Primary and Secondary Research, Statistical Analysis, Machine Learning, Data Modelling. Her key role also involves Technical Sales Support, Client Interaction and Project management within the Healthcare team. Lastly, she showcases extensive affinity towards learning new skills and remain fascinated in implementing them.
Co-Author
Co-Author Profile
Rahul Gotadki LinkedIn
Research Manager
He holds an experience of about 9+ years in Market Research and Business Consulting, working under the spectrum of Life Sciences and Healthcare domains. Rahul conceptualizes and implements a scalable business strategy and provides strategic leadership to the clients. His expertise lies in market estimation, competitive intelligence, pipeline analysis, customer assessment, etc.
Share::
Request Free Sample

Research Approach


Secondary Research

The secondary research process involved comprehensive analysis of regulatory databases, peer-reviewed clinical journals, medical device registries, and authoritative health organizations specific to interventional pain management and neuromodulation therapies. Key sources included the US Food & Drug Administration (FDA) Center for Devices and Radiological Health (CDRH) and the Global Unique Device Identification Database (GUDID), European Medicines Agency (EMA) Medical Device Coordination Group, Therapeutic Goods Administration (TGA) Australia, Pharmaceuticals and Medical Devices Agency (PMDA) Japan, and National Medical Products Administration (NMPA) China. Clinical and epidemiological data were sourced from the National Institutes of Health (NIH) National Institute of Neurological Disorders and Stroke (NINDS), Centers for Disease Control and Prevention (CDC) National Center for Health Statistics Chronic Pain Surveillance, Agency for Healthcare Research and Quality (AHRQ) Healthcare Cost and Utilization Project (HCUP), and World Health Organization (WHO) International Classification of Diseases (ICD-11) chronic pain classifications. Professional medical societies provided procedural standards and adoption data, including the International Association for the Study of Pain (IASP), American Academy of Pain Medicine (AAPM), North American Neuromodulation Society (NANS), International Neuromodulation Society (INS), American Society of Interventional Pain Physicians (ASIPP), American Society of Regional Anesthesia and Pain Medicine (ASRA), and European Pain Federation (EFIC). Reimbursement and policy research utilized Centers for Medicare & Medicaid Services (CMS) National Coverage Determinations (NCDs) and Local Coverage Determinations (LCDs), private payer medical policies, and health economic evaluations from the National Center for Biotechnology Information (NCBI)/PubMed and ClinicalTrials.gov. These sources were used to collect device safety surveillance data, chronic pain epidemiology statistics, neuromodulation procedure volumes, regulatory clearance trajectories, and competitive product pipelines for spinal cord stimulators, peripheral nerve stimulators, transcutaneous electrical nerve stimulation (TENS) units, implantable infusion pumps, radiofrequency ablation generators and cannulas, and cryotherapy/ultrasound pain relief devices.


Primary Research

As part of the main research process, stakeholders from both the supply and demand sides were interviewed to get both qualitative and quantitative information about device development roadmaps, clinical trial endpoints, and post-market surveillance outcomes. CEOs, Vice Presidents of R&D, directors of regulatory affairs, and marketing heads from neuromodulation device makers, infusion pump OEMs, and RF ablation technology providers were some of the supply-side sources. Board-certified pain management specialists, anesthesiologists, interventional radiologists, orthopedic surgeons, neurosurgeons, medical directors of ambulatory surgery centers (ASCs) and pain clinics, and procurement officers from hospitals and specialty pain treatment centers were some of the sources of demand. For both acute and chronic pain applications, primary research supported market segmentation and FDA PMA and 510(k) clearance timelines. It also found barriers to clinical adoption, changes in reimbursement coding (CPT analysis), and trends in ASP erosion.

Primary Respondent Breakdown:

By Designation: C-level Primaries (32%), Director Level (35%), Others (33%)

By Region: North America (40%), Europe (25%), Asia-Pacific (28%), Rest of World (7%)


Market Size Estimation

Global market valuation was derived through device shipment tracking, implant procedural data, and manufacturer revenue reconciliation across implantable and non-implantable pain management modalities. The methodology included:

Identification of 60+ key manufacturers across North America, Europe, Asia-Pacific, and Latin America specializing in neuromodulation, infusion therapy, and ablation technologies

Product mapping across neurostimulation devices (spinal cord stimulators, peripheral nerve stimulators, dorsal root ganglion stimulators, TENS units), intrathecal infusion pumps, radiofrequency ablation generators and consumables, cryotherapy systems, and therapeutic ultrasound devices

Analysis of reported and modeled annual revenues specific to pain management device portfolios, including neuromodulation systems, refillable implantable pumps, and disposable RF cannulas/electrodes

Coverage of manufacturers representing 70-75% of global market share in 2024, with particular emphasis on major neuromodulation conglomerates and specialized RF ablation players

Extrapolation using bottom-up (implant volumes × device ASP by country; procedure counts for RF ablation, SCS trials, and pump refills) and top-down (publicly reported segment revenues for major medtech conglomerates) approaches to derive segment-specific valuations for implantable electrical stimulators, external TENS devices, infusion therapy systems, and thermal/ablation modalities

Share::
Request Free Sample
Download Free Sample

Kindly complete the form below to receive a free sample of this Report

* Please use a valid business email

Share::
Request Free Sample
Download PDF ×

We do not share your information with anyone. However, we may send you emails based on your report interest from time to time. You may contact us at any time to opt-out.
















