Palm Oil Market (2026 - 2035)

Palm Oil Market Size, Share, Industry Trend & Analysis Research Report By Product Type (Crude Palm Oil, RBD Palm Oil, Palm Kernel Oil), By Nature (Conventional, Organic), By End Use (Retail, Industrial), By Geography (North America, Europe, Asia-Pacific, South America, Middle East & Africa) - Forecast to 2035
ID: MRFR/FnB/3797-HCR
200 Pages
Snehal Singh
Last Updated: July 11, 2026
Palm Oil Market
Market Size
Forecast Period2026-2035
CAGR (2026-2035)4.72%
2025 Market SizeUSD 76.18 Billion
2035 Market SizeUSD 119.54 Billion
Key Players
Wilmar International
Sime Darby Plantation
Golden Agri-Resources
IOI Corporation
Musim Mas
FGV Holdings
Opportunities
  • African Palm-Belt Expansion
  • Specialty Fats and Cocoa Butter Equivalents
  • Digital Traceability and Carbon-Credit Monetization

Palm Oil Market Summary

The Palm Oil Market was valued at USD 76.18 billion in 2025 and is projected to reach USD 79.46 billion in 2026 before climbing to USD 119.54 billion by 2035, advancing at a CAGR of 4.72% during the 2026โ€“2035 forecast window. This trajectory reflects the commodity's deep integration into global food systems, personal care manufacturing, and the fast-expanding oleochemical sector. Government-backed biodiesel blending mandates across Southeast Asia โ€” Indonesia's B40 program alone absorbs over 11 million metric tons of crude palm oil annually [2] โ€” continue to underpin demand volumes that few alternative vegetable oils can match.

Sustainable palm oil production is reshaping the industry's operational DNA. Legacy plantation practices centered on slash-and-burn land clearing are giving way to precision-agriculture models that deploy satellite monitoring, drone-based canopy analysis, and IoT-enabled soil sensors. The Roundtable on Sustainable Palm Oil (RSPO) has certified over 4.8 million hectares globally, with RSPO-certified palm oil now commanding a 7โ€“12% price premium over conventional grades [3]. Major FMCG buyers have pledged full traceability by 2030, channeling an estimated USD 2.4 billion in supply-chain digitization investments through 2028 [4].

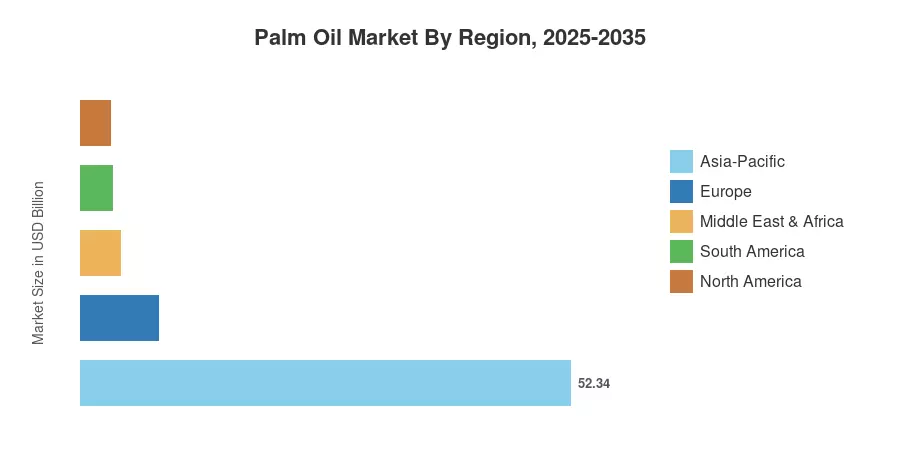
Asia-Pacific dominates the Palm Oil Market with roughly 68.7% of global revenue, anchored by Indonesia and Malaysia's combined output of over 85% of the world's supply. The Middle East & Africa region stands as the fastest-growing geography, posting a projected CAGR of 5.64% through 2035, driven by population growth and rising edible-oil consumption in Sub-Saharan Africa Europe represents the second-largest import bloc, though regulatory headwinds from the EU Deforestation Regulation will increasingly shape trade flows over the coming decade.

ย 

Key Report Takeaways

โ€ข By Product Type

  • RBD palm oil captured a leading 42.3% revenue share of the Palm Oil Market in 2025, reflecting its dominance in frying, bakery, and confectionery applications
  • Palm kernel extraction volumes are forecast to grow at a CAGR of 5.93% through 2035, propelled by rising demand for lauric-acid derivatives in cosmetics and surfactants
  • Crude palm oil refining capacity expansions across Indonesia and India accounted for over USD 1.8 billion in capital expenditure commitments during 2023โ€“2025

โ€ข By Nature

  • Conventional palm oil held 84.6% of the Palm Oil Market in 2025, though tightening deforestation regulations are gradually eroding its share
  • Organic-certified output is advancing at a 6.37% CAGR through 2035, the fastest pace within the nature segmentation

โ€ข By End Use

  • Retail channels represented 51.4% of the Palm Oil Market demand in 2025
  • Industrial end-use segments are expanding at a 7.08% CAGR through 2035 as oleochemical and biofuel applications scale

โ€ข By Region

  • Asia-Pacific commanded approximately USD 52.34 billion of the Palm Oil Market in 2025
  • The Middle East & Africa region will register the highest CAGR at 5.64% through 2035

ย 

Market Size and Forecast (2021โ€“2035)

MARKET RESEARCH FUTURE (MRFR)'s market sizing integrates primary interviews with plantation operators, refiners, and commodity traders alongside secondary data from FAO, USDA, and national palm oil boards. Base-year (2025) revenue is triangulated using import-export volumes, average CPO benchmark pricing, and downstream value-addition estimates.
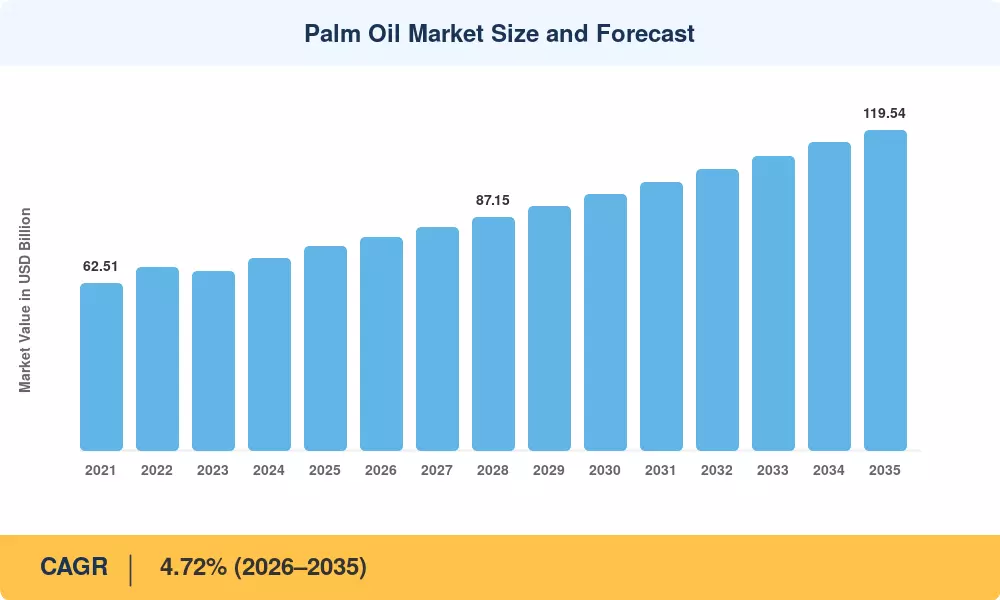
Palm Oil Market Size and Forecast
Our Impact
Enabled $4.3B Revenue Impact for Fortune 500 and Leading Multinationals
Partnering with 2000+ Global Organizations Each Year
30K+ Citations by Top-Tier Firms in the Industry

Driver Impact Analysis

Driver ~% Impact on CAGR Geographic Relevance Impact Timeline
Biodiesel blending mandates ~22% Asia-Pacific, South America Short-term
Food processing & bakery demand ~18% Global Medium-term
Oleochemical diversification ~16% Asia-Pacific, Europe Medium-term
Population growth in Africa ~14% Middle East & Africa Long-term
Sustainable palm oil production certifications ~12% Global Medium-term
Crude palm oil refining capacity additions ~10% Asia-Pacific, South Asia Short-term
Palm kernel extraction for cosmetics ~8% Europe, North America Long-term

ย 

Biodiesel Blending Mandates

About 13.5 million tons of crude palm oil will be absorbed yearly by Indonesia's mandated B40 program, which is expected to be fully implemented by 2026. This represents a 23% increase over 2023 consumption under the B35 regime [2]. The supply-demand balance is further tightened by Brazil's growing biodiesel ambitions and Malaysia's B20 plan. By creating a price floor that encourages ongoing capital investment in crude palm oil refining infrastructure throughout Southeast Asia, these regulations change palm oil from a strictly food-grade commodity into a dual-purpose energy feedstock.

Food Processing and Bakery Demand

Due to its oxidative stability and cheaper cost compared to soybean and sunflower alternatives, palm oil continues to be the primary frying and shortening medium, with global packaged-food sales surpassing USD 3.5 trillion in 2024 [5]. The fatty acid makeup of palm oil, which is balanced between unsaturated and saturated chains, provides the textural characteristics needed by manufacturers of baked goods and confections. In FY2024, edible oil imports from India alone climbed by 11% year over year, with palm oil making up about 60% of all vegetable oil imports [12].

Oleochemical Diversification

Oleochemical plants in Malaysia and Indonesia processed over 8 million tons of palm-based feedstock in 2024, producing fatty alcohols, glycerin, and methyl esters used in detergents, lubricants, and personal-care formulations [9]. The shift toward bio-based surfactants is accelerating palm kernel extraction volumes, as lauric acid from palm kernel oil replaces petrochemical-derived alternatives. BASF, Evonik, and Wilmar have collectively committed over USD 1.2 billion to new oleochemical capacity through 2028 [13].

RSPO Certification and Traceability Demand

Consumer-goods companies representing over 40% of global palm oil consumption have adopted RSPO-certified palm oil procurement policies, creating a structural demand channel for sustainably sourced supply [3]. RSPO-certified volumes grew 14% year-over-year in 2024, reaching 21.4 million metric tons of certified sustainable output. This certification premium incentivizes smallholders to adopt sustainable palm oil production practices, with World Bank-backed programs funding traceability platforms across West Africa and Central America [14].

ย 

Restraints Impact Analysis

Restraint ~% Negative Impact on CAGR Geographic Relevance Impact Timeline
EU Deforestation Regulation (EUDR) ~ โ€“0.35% Europe, Asia-Pacific Short-term
Land-use and deforestation restrictions ~ โ€“0.28% Southeast Asia, Africa Long-term
Price volatility and El Niรฑo disruptions ~ โ€“0.22% Global Short-term
Health perception and trans-fat regulations ~ โ€“0.15% North America, Europe Medium-term
Competing vegetable oils (soy, rapeseed) ~ โ€“0.12% Global Medium-term

ย 

EU Deforestation Regulation

The EU Deforestation Regulation (EUDR), effective from December 2024 with extended compliance deadlines into 2026, requires importers to demonstrate that palm oil commodities are deforestation-free and legally produced [7]. Compliance costs are estimated at USD 150โ€“300 per ton for smallholder-origin supply chains, potentially squeezing margins for exporters serving European markets. This regulation could redirect 2โ€“3 million tons of non-certified palm oil away from European ports toward less-regulated destinations in South Asia and Africa.

El Niรฑoโ€“Driven Price Volatility

The 2023โ€“2024 El Niรฑo cycle reduced FFB (fresh fruit bunch) yields by 8โ€“12% across key growing regions in Sumatra and Sabah, triggering CPO price spikes above USD 1,100 per metric ton [6]. Such volatility discourages long-term procurement contracts from food processors, who increasingly hedge by diversifying into soybean and sunflower oils. Climate models project more frequent and intense El Niรฑo events through 2035, compounding supply-side uncertainty for the Palm Oil Market.

Health Perception Challenges

Public health organizations in North America and Europe are still concerned about the saturated fat content of palm oil, which has about 50% palmitic acid in its fatty acid makeup [16]. Several European merchants have adopted "palm oilโ€“free" labels in response to the WHO's 2024 guidelines, which propose reducing saturated-fat intake to less than 10% of daily calories. These health views limit the expansion of premium consumer categories in developed economies, but they have little effect on overall worldwide demand.

ย 

Palm Oil Market Opportunities

African Palm-Belt Expansion

West and Central African nations โ€” Nigeria, Ghana, Cameroon, and the Democratic Republic of Congo โ€” possess over 200 million hectares of suitable but underutilized palm-cultivation land [11]. With domestic consumption growing at 6โ€“8% annually and current production meeting barely 40% of local demand, greenfield plantation development represents a multi-billion-dollar investment opportunity. International development finance from the IFC and AfDB is targeting over USD 800 million in palm oil value-chain projects through 2030

Specialty Fats and Cocoa Butter Equivalents

Derivatives from fractionated palm oil are gaining market share in the USD 7.3 billion specialty-fats sector, taking the place of cocoa butter in the production of chocolate and acting as the foundation for spreads without dairy [10]. Improvements in enzymatic interesterification enable producers to customize the fatty acid composition of palm oil for particular melting-point profiles, creating avenues for high-end confections and plant-based foods

Digital Traceability and Carbon-Credit Monetization

Blockchain-based traceability platforms enable plantation operators to generate verifiable deforestation-free credentials and access voluntary carbon markets. Sustainable palm oil production operations that demonstrate measurable carbon sequestration through cover-cropping and peatland restoration can monetize credits valued at USD 12โ€“25 per ton of COโ‚‚ equivalent [14]. This dual revenue model โ€” commodity sales plus carbon credits โ€” improves the financial viability of RSPO-certified palm oil cultivation, particularly for smallholders

Oleochemical Bio-Surfactants

The global shift away from petrochemical-based surfactants is creating a USD 2.8 billion incremental opportunity for palm kernel extractionโ€“derived lauric and oleic acids in household and industrial cleaning products [9]. European REACH regulations and U.S. EPA green-chemistry guidelines favor plant-derived alternatives, positioning palm-based oleochemicals for share gains through 2035

Indian Subcontinent Refining Hub

India's National Mission on Edible Oils targets raising domestic palm oil output to 1.1 million tons by 2030, while simultaneously expanding crude palm oil refining capacity in Gujarat and Andhra Pradesh [8]. SEZ-based refining clusters offer favorable tax treatment, attracting joint ventures between Indonesian suppliers and Indian processors. This structural shift from importing refined products to importing crude and refining domestically will reshape trade flows across the Palm Oil Market

ย 

Palm Oil Market Future Outlook

Precision Agriculture and Plantation Digitization

Satellite imagery, drone surveillance, and AI-driven yield prediction models will transform plantation management over the next decade. The FAO estimates that digital agriculture tools could improve smallholder palm oil yields by 15โ€“20%, narrowing the gap with large-estate productivity levels [18]. Precision fertilizer application and automated harvesting systems โ€” already piloted by Sime Darby and Golden Agri-Resources โ€” are expected to reach commercial scale by 2029, reducing labor costs by an estimated 25% while improving sustainable palm oil production metrics.

Circular Oleochemistry and Bio-Refinery Integration

Palm oil processing generates substantial byproducts โ€” empty fruit bunches, palm oil mill effluent, and fiber โ€” that bio-refinery concepts can convert into biomethane, biochar, and cellulosic ethanol [9]. IEA projections indicate that bio-refinery integration could add USD 40โ€“60 in value per ton of FFB processed by 2032, fundamentally altering the economics of crude palm oil refining operations [19]. Companies that master circular-economy models will capture disproportionate value as ESG-linked financing increasingly favors zero-waste operations.

Regulatory Convergence and Deforestation-Free Supply Chains

Beyond the EUDR, the UK, Australia, and Japan are developing similar deforestation-linked import regulations expected to take effect between 2027 and 2030 [7]. This regulatory convergence will drive universal adoption of geospatial traceability โ€” RSPO-certified palm oil volumes could double to over 40 million metric tons by 2032 as compliance becomes a market-entry requirement rather than a premium differentiator. Blockchain-verified supply chains will become table stakes across the Palm Oil Market.

Climate Adaptation and Genetic Innovation

Oil palm breeding programs at MPOB (Malaysian Palm Oil Board) and IOPRI (Indonesian Oil Palm Research Institute) are developing drought-tolerant and disease-resistant varieties capable of sustaining yields under projected 1.5โ€“2.0ยฐC warming scenarios [20]. CRISPR-based gene editing โ€” subject to regulatory approval in key producing countries โ€” could accelerate the development cycle from 15 years to 5 years. These genetic innovations directly influence palm oil fatty acid composition, enabling breeders to produce varieties with lower saturated-fat profiles that address health-perception restraints

ย 

Palm Oil Market Segmentation

By Product Type

Segment Key Metric Primary Demand Driver
Crude Palm Oil USD 24.72 Billion (2025) Biodiesel feedstock; refining input
RBD Palm Oil 42.3% share (2025) Frying, bakery, confectionery applications
Palm Kernel Oil 5.93% CAGR (2026โ€“2035) Cosmetics; lauric-acid oleochemicals

ย 

The Palm Oil Market's product-type segmentation reflects divergent end-use pathways. RBD palm oil dominates revenue share because crude palm oil refining operations convert the majority of raw CPO into refined grades for food applications. RBD palm oil's oxidative stability and neutral flavor profile make it the default choice for commercial frying, while its fractionation into olein and stearin fractions serves margarine and specialty-fat manufacturers [10]. Palm kernel extraction is the fastest-growing subsegment, driven by cosmetic-grade lauric acid demand and the shift toward bio-based surfactants in European and North American cleaning-product markets. Crude palm oil volumes remain substantial but are increasingly viewed as an intermediate rather than a final product, with integrated refiners capturing the value spread between CPO and RBD pricing.

By Nature

Segment Key Metric Primary Demand Driver
Conventional 84.6% share (2025) Cost advantage: established supply chains
Organic 6.37% CAGR (2026โ€“2035) RSPO certified palm oil demand; premium pricing

ย 

Conventional grades command the vast majority of the Palm Oil Market, reflecting the commodity's price-sensitive demand base in developing economies. Organic-certified palm oil, while still a niche segment, is experiencing accelerated growth as FMCG companies formalize sustainable palm oil production sourcing commitments. The organic subsegment benefits from a 15โ€“20% price premium that compensates growers for lower yields and higher certification costs, creating a financially viable pathway for smallholder participation in certified supply chains [3].

By End Use

Segment Key Metric Primary Demand Driver
Retail 51.4% share (2025) Cooking oil, margarine, and spreads
Industrial 7.08% CAGR (2026โ€“2035) Oleochemicals; biodiesel; animal feed

ย 

Retail remains the largest end-use channel within the Palm Oil Market, with cooking oil and margarine representing the primary consumption formats in Asia-Pacific and African households. Industrial applications are growing faster due to structural shifts โ€” biodiesel mandates, oleochemical expansion, and palm kernel extraction for personal-care ingredients collectively drive double-digit volume growth in non-food channels. The industrial subsegment's CAGR outpaces retail by over 200 basis points, signaling a long-term rebalancing of the Palm Oil Market's end-use composition toward higher-value technical applications [9].

ย 

Regional Market Share Analysis

Region Key Metric Primary Investment Themes
Asia-Pacific 68.7% share (2025) Plantation modernization; crude palm oil refining capacity expansion
Europe USD 8.38 Billion (2025) EUDR compliance; RSPO certified palm oil procurement
North America 4.16% CAGR (2026โ€“2035) Oleochemical bio-surfactants; palm kernel extraction for cosmetics
South America USD 3.42 Billion (2025) Biodiesel programs; Amazonian sustainable palm oil production
Middle East & Africa 5.64% CAGR (2026โ€“2035) Greenfield plantations: population-driven edible oil demand
Total USD 76.18 Billion (2025) โ€”

The Palm Oil Market exhibits pronounced geographic concentration, with Asia-Pacific's producer-exporter complex accounting for the overwhelming majority of value. Demand-side growth is diversifying toward Africa and the Middle East, where rising incomes and urbanization accelerate edible-oil consumption.

ย 

North America

Country Key Metric Key Driver
US 62.3% of regional revenue Oleochemical and personal-care demand
Canada 3.87% CAGR Sustainable sourcing mandates
Mexico USD 0.61 Billion Food-processing sector growth

ย 

North America's Palm Oil Market is shaped primarily by downstream demand for palm kernel extractionโ€“derived ingredients in cosmetics, detergents, and industrial lubricants. The U.S. imported approximately 1.6 million metric tons of palm oil and derivatives in 2024, with over 40% directed to non-food oleochemical applications [12]. Canadian retailers have increasingly adopted RSPO-certified palm oil targets, while Mexico's growing processed-food sector drives steady crude palm oil refining imports.

Europe

Country Key Metric Key Driver
Germany 21.7% of regional share Oleochemical manufacturing hub
UK USD 1.28 Billion Retail and food-service demand
France 4.23% CAGR Biofuel blending phase-out shifting to food channels
Italy USD 0.89 Billion Confectionery and bakery applications
Spain 3.91% CAGR Growing food-processing sector
Nordic Countries USD 0.52 Billion Sustainable procurement leadership
Russia 4.58% CAGR Price-sensitive edible-oil imports
Rest of Europe USD 1.47 Billion Mixed industrial and food demand

ย 

Europe's relationship with the Palm Oil Market is being redefined by the EUDR, which mandates full supply-chain traceability for palm oil imports effective 2026 [7]. Germany's oleochemical industry โ€” anchored by BASF and Henkel โ€” remains the region's largest consumer, while the UK food-service sector absorbs significant volumes for deep-frying applications. France's 2024 exclusion of palm oil from biofuel tax incentives redirected roughly 300,000 tons annually into food and technical channels [17].

Asia-Pacific

Country Key Metric Key Driver
China USD 9.87 Billion Food processing; oleochemical imports
India 5.48% CAGR National edible oil mission: refining expansion
Japan USD 2.14 Billion Specialty fats; confectionery demand
South Korea 3.96% CAGR Cosmetics and personal-care formulations
ASEAN 59.2% of regional share Plantation production; crude palm oil refining hubs
Rest of Asia-Pacific USD 1.83 Billion Emerging edible-oil demand

ย 

Asia-Pacific's grip on the Palm Oil Market reflects both supply-side dominance and massive domestic consumption. Indonesia and Malaysia โ€” the core of the ASEAN production complex โ€” together account for over 85% of global crude palm oil output [2]. India has emerged as the world's largest palm oil importer, with FY2024 imports exceeding 9.5 million metric tons. China's palm-based oleochemical sector is expanding rapidly, driven by government incentives for bio-based industrial chemicals [8].

South America

Country Key Metric Key Driver
Brazil 58.4% of regional share Biodiesel program; Amazon-basin cultivation
Argentina 4.12% CAGR Edible oil diversification from soybean
Rest of South America USD 0.68 Billion Colombia and Ecuador plantation growth

ย 

South America's Palm Oil Market presence is anchored by Brazil's dual role as a producer in Parรก state and a major consumer for biodiesel blending. Colombia โ€” the region's largest producer โ€” exported over 600,000 metric tons in 2024, with sustainable palm oil production certifications covering approximately 30% of national output [14]. Argentina's palm oil imports serve as a cost-effective complement to its dominant soybean-oil supply.

Middle East & Africa

Country Key Metric Key Driver
Saudi Arabia USD 1.12 Billion Food-service and institutional demand
UAE 4.93% CAGR Re-export hub; food processing
South Africa USD 0.74 Billion FMCG and the personal-care sector
Egypt 5.87% CAGR Population growth, subsidized cooking oil programs
Rest of MEA 47.3% of regional share West African domestic production and consumption

ย 

The Middle East & Africa region represents the fastest-growing segment of the Palm Oil Market, propelled by demographic expansion and urbanization across Sub-Saharan Africa. Nigeria โ€” Africa's largest palm oil producer and consumer โ€” faces a widening supply deficit projected at 1.5 million metric tons by 2030, attracting foreign direct investment into plantation development [11]. Gulf Cooperation Council states serve as major re-export platforms, importing crude palm oil for refining and distribution across the broader MENA region.

ย 

Palm Oil Market By Region, 2025-2035

Competitive Benchmarking

The Palm Oil Market operates at a medium level of concentration, with the top five players controlling an estimated 28โ€“35% of global revenue. The competitive structure blends large, vertically integrated plantation-to-refinery conglomerates with specialized downstream processors and trading houses. An estimated HHI (Herfindahl-Hirschman Index) of 600โ€“850 reflects this moderately fragmented landscape, where scale advantages in plantation ownership and crude palm oil refining coexist with niche differentiation in oleochemicals and specialty fats.

Company Est. Revenue Share Range Key Offerings for the Palm Oil Market Strategic Positioning
Wilmar International ~8โ€“11% Integrated plantation-to-consumer palm products Largest global palm oil trader; deep ASEAN footprint
Sime Darby Plantation ~5โ€“8% Upstream plantation; sustainable palm oil production RSPO leadership; premium certified volumes
Golden Agri-Resources ~4โ€“7% Plantation; crude palm oil refining; downstream brands Vertically integrated across Indonesia
IOI Corporation ~3โ€“5% Oleochemicals; specialty fats; palm kernel extraction European oleochemical partnerships
Musim Mas ~3โ€“5% Refining; biodiesel; oleochemicals Strong B2B supply to global FMCG
FGV Holdings ~2โ€“4% Plantation; downstream processing Malaysia's largest plantation landbank
Astra Agro Lestari ~2โ€“4% Upstream palm cultivation; CPO production Indonesian plantation scale
Cargill (palm division) ~2โ€“3% Trading; refining; sustainable sourcing Global supply-chain integration
Kuala Lumpur Kepong (KLK) ~2โ€“3% Oleochemicals; specialty fats; plantation Downstream value-addition focus
Olam Agri ~1โ€“3% Origination; refining; distribution African supply-chain expansion

ย 

ย 

Recent News & Developments

  • Wilmar International (March 2025): Commissioned a USD 340 million integrated oleochemical complex in Dumai, Indonesia, expanding palm kernel extraction capacity by 200,000 tons per year [13].
  • Indonesian Government (January 2025): Confirmed mandatory B40 biodiesel blending effective January 2026, projected to absorb an additional 2.5 million tons of crude palm oil annually from the domestic Palm Oil Market [2].
  • Sime Darby Plantation (November 2024): Achieved 100% RSPO certified palm oil traceability across its global supply chain, covering 590,000 hectares [3].
  • European Commission (September 2024): Extended EUDR compliance deadlines to June 2026 for large operators and December 2026 for SMEs, providing additional preparation time for sustainable palm oil production documentation [7].
  • Golden Agri-Resources (June 2024): Announced a strategic partnership with Neste to supply 500,000 tons of certified-sustainable feedstock annually for renewable diesel production through 2030 [22].
  • India Ministry of Agriculture (March 2024): Expanded the National Mission on Oil Palm to include 850,000 additional hectares in northeastern states, targeting 1.1 million metric tons of domestic crude palm oil production by 2030 [8].
  • IOI Corporation (January 2024): Opened a new specialty-fats plant in Rotterdam, focusing on cocoa butter equivalents derived from fractionated palm oil, investing EUR 95 million [10].
  • Musim Mas (October 2023): Launched a blockchain-based traceability platform covering 98% of its direct supply chain, enabling real-time monitoring of sustainable palm oil production compliance [14].

ย 

Palm Oil Market Report Scope

Parameter Detail
Market Scope Global Palm Oil Market covering crude palm oil, RBD palm oil, palm kernel oil, and derivatives
Study Period 2021โ€“2035
CAGR (Forecast) 4.72% (2026โ€“2035)
Base Year Market Size USD 76.18 Billion (2025)
Forecast End-Point USD 119.54 Billion (2035)
Fastest Growing Segment Palm Kernel Oil (by product type); Industrial (by end use); Middle East & Africa (by region)
Companies Profiled 10 (Wilmar, Sime Darby, Golden Agri-Resources, IOI, Musim Mas, FGV, Astra Agro Lestari, Cargill, KLK, Olam Agri)
Valuation Currency USD Billion

ย 

ย 

FAQs

How does the palm oil supply chain differ for food-grade versus oleochemical-grade buyers?
Food-grade buyers procure RBD palm oil through commodity exchanges and direct contracts with refiners, requiring food-safety certifications (HACCP, ISO 22000). Oleochemical buyers source crude palm oil or palm kernel oil and process it in-house into fatty acids and glycerin [9]. Procurement lead times for oleochemical grades are typically 30โ€“60 days longer due to specification testing.
What is the cost differential between RSPO-certified palm oil and conventional grades in the Palm Oil Market?
RSPO-certified palm oil trades at a 7โ€“12% premium over conventional CPO benchmark prices, translating to roughly USD 60โ€“100 per metric ton at current price levels [3]. This premium narrows as certified supply volumes scale toward projected 2032 targets.
How do El Niรฑo cycles specifically affect crude palm oil refining economics?
El Niรฑo reduces FFB yields by 8โ€“12%, tightening CPO supply and compressing refining margins as input costs rise faster than refined-product prices [6]. Refiners with diversified feedstock sourcing across multiple geographies mitigate this risk more effectively.
What role does palm kernel extraction play in the cosmetics value chain?
Palm kernel extraction produces lauric acid, the primary feedstock for sodium lauryl sulfate and other surfactants used in shampoos, cleansers, and soap bars [10]. Over 35% of global cosmetic-grade surfactant production relies on palm kernelโ€“derived inputs.
How are smallholders integrating into sustainable palm oil production certification programs?
Group certification schemes allow smallholders to pool resources for auditing and compliance costs, reducing per-farm expenses by 40โ€“60% compared to individual certification [3]. World Bank and IFC programs fund these cooperative models across Indonesia and West Africa.
What impact will India's domestic oil palm expansion have on the global Palm Oil Market?
India's National Mission targets 1.1 million metric tons of domestic CPO by 2030, potentially displacing 10โ€“12% of current imports [8]. However, yield ramp-up timelines suggest meaningful import substitution will not materialize before 2031โ€“2032.
How does palm oil fatty acid composition influence its competitiveness against soybean oil in food manufacturing?
Palm oil's 50:50 saturated-to-unsaturated ratio provides superior frying stability and shelf life compared to soybean oil's higher polyunsaturated content [16]. This composition eliminates the need for partial hydrogenation, avoiding trans-fat concerns that affect soybean-based alternatives. ย  ย 
Author
Author
Author Profile
Snehal Singh LinkedIn
Manager - Research
High acumen in analyzing complex macro & micro markets with more than 6 years of work experience in the field of market research. By implementing her analytical skills in forecasting and estimation into market research reports, she has expertise in Packaging, Construction, and Equipment domains. She handles a team size of 20-25 resources and ensures smooth running of the projects, associated marketing activities, and client servicing.

Research Approach

ย 

Secondary Research

The secondary research process involved comprehensive analysis of regulatory databases, trade statistics, governmental agricultural reports, and authoritative sustainability certifications. Key sources included the Roundtable on Sustainable Palm Oil (RSPO) Annual Communication of Progress (ACOP), Indonesian Palm Oil Association (GAPKI), Malaysian Palm Oil Board (MPOB), Council of Palm Oil Producing Countries (CPOPC), US Department of Agriculture (USDA) Foreign Agricultural Service, Food and Agriculture Organization of the United Nations (FAO), World Bank Commodity Markets Outlook, European Union Deforestation Regulation (EUDR) Database, Indonesian Ministry of Agriculture (Badan Pusat Statistik), Malaysian Ministry of Plantation and Commodities, US Energy Information Administration (EIA) for biofuel data, Intergovernmental Panel on Climate Change (IPCC) land use reports, International Labour Organization (ILO) palm oil sector reports, World Wildlife Fund (WWF) Palm Oil Scorecards, United States Environmental Protection Agency (EPA) Renewable Fuel Standards, and national customs databases from Indonesia, Malaysia, India, China, and the Netherlands. These sources were used to collect production volumes, trade flows, sustainability certification statistics, regulatory compliance data, labor standards assessments, and price trend analysis for crude palm oil (CPO), palm kernel oil (PKO), and derivative products including oleochemicals, biodiesel, and specialty fats.

ย 

Primary Research

To gather both qualitative and quantitative information, the primary research process involved interviewing players from both the supply and demand sides. Executives from integrated palm oil plantations, refineries, and oleochemical manufacturers made up the supply side, along with directors of plantation operations, VPs of sustainability, and supply chain managers. Procurement directors from food and beverage corporations (Ferrero, Unilever, Nestlรฉ, P&G), cosmetics ingredient suppliers, biofuel manufacturers, pharmaceutical industry purchasers, and commodities dealers from the trading centers of Rotterdam and Singapore made up the demand-side sources. Primary data was used to verify production yield estimates, sustainability certification premiums, inventory management methods, and changes in demand patterns for edible oil compared to industrial applications. It also uncovered insights into regulatory adaption tactics (EUDR/ISPO/MSPO), inventory management methodologies, and altering demand patterns.

Primary Respondent Breakdown:

By Designation: C-level Primaries (28%), Director Level (42%), Others (30%)

By Region: Asia-Pacific (45%), Europe (22%), North America (15%), Rest of World (18%)

By Value Chain Position: Upstream Plantations (35%), Midstream Refining/Oleochemicals (30%), Downstream FMCG/Retail (25%), Trading/Logistics (10%)

ย 

Market Size Estimation

Global market valuation was derived through production volume mapping and price realization analysis. The methodology included:

Identification of 60+ key stakeholders across Indonesia, Malaysia, Thailand, Nigeria, Colombia, and emerging production regions in Central America and Africa

Product mapping across crude palm oil (CPO), palm kernel oil (PKO), palm stearin, palm olein, palm kernel cake, and refined derivative categories (oleochemicals, biodiesel, specialty fats)

Analysis of reported and modeled annual revenues specific to palm oil business units, segregated by food versus industrial versus energy applications

Coverage of plantation groups and refiners representing 75-80% of global CPO production capacity in 2024

Extrapolation using bottom-up (hectarage ร— yield per hectare ร— extraction rate ร— CPO price by country) and top-down (company revenue validation against Bursa Malaysia and Indonesia Stock Exchange filings) approaches to derive segment-specific valuations. Additional modeling incorporated RSPO certification premiums, biodiesel blending mandate impacts (B30/B35/B40 policies), and oleochemical margin spreads to refine market value calculations across conventional versus certified sustainable supply chains.

Download Free Sample

Kindly complete the form below to receive a free sample of this Report

Download PDF ×

We do not share your information with anyone. However, we may send you emails based on your report interest from time to time. You may contact us at any time to opt-out.
















