• Cat-intel
  • MedIntelliX
  • Resources
  • About Us
  • Hero Background
    English
    Chinese
    French
    Japanese
    Korean
    German
    Spanish

    Perishable Goods Transportation Market Analysis

    ID: MRFR/PNT/10043-HCR
    128 Pages
    Snehal Singh
    October 2025

    Perishable Goods Transportation Market Research Report Information By Type (MPS, Dairy and Frozen Desserts, Vegetables & Fruits and Bakery & Confectionery), By Transportation Mode (Rail Transportation, Air Transportation, Marine Transportation and Road Transportation) And By Region (North America, Europe, Asia-Pacific, And Rest Of The World) –Market Forecast Till 2035

    Share:
    Download PDF ×

    We do not share your information with anyone. However, we may send you emails based on your report interest from time to time. You may contact us at any time to opt-out.

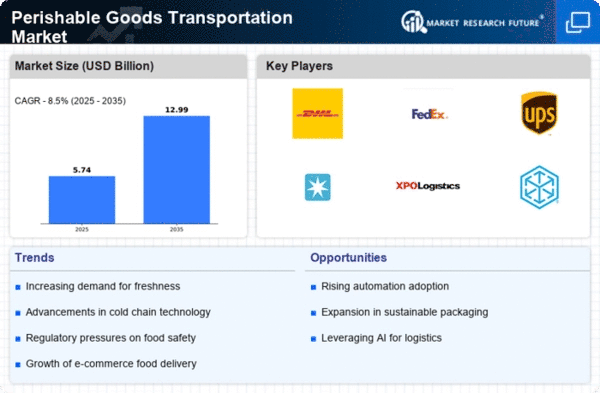
    Perishable Goods Transportation Market Infographic
    $ 4,950.0
    $ 5,950.0
    $ 7,250.0

    Market Analysis

    In-depth Analysis of Perishable Goods Transportation Market Industry Landscape

    The market dynamics of perishable goods transportation are experiencing significant changes influenced by a combination of factors that impact both the logistics and supply chain sectors. Perishable goods, including fresh produce, pharmaceuticals, and dairy products, require specialized transportation to maintain their quality and freshness throughout the supply chain. The market dynamics are characterized by advancements in cold chain technology, regulatory compliance, global trade patterns, and the increasing demand for efficient and reliable perishable goods transportation solutions. Advancements in cold chain technology play a crucial role in shaping the dynamic nature of the perishable goods transportation market. The development of state-of-the-art refrigeration and temperature-controlled systems ensures that perishable goods remain at optimal conditions during transportation. Innovations in monitoring and tracking technologies further enhance visibility into the cold chain, allowing for real-time data on temperature, humidity, and location. These technological advancements not only improve the efficiency and reliability of perishable goods transportation but also influence the market dynamics by setting higher standards for quality and safety throughout the supply chain. Regulatory compliance is a significant driver of market dynamics in the perishable goods transportation sector. Strict regulations govern the transportation of perishable goods, especially in the food and pharmaceutical industries, to ensure consumer safety and product integrity. Adherence to temperature requirements, documentation standards, and hygiene practices is essential. The evolving regulatory landscape, with an increasing emphasis on traceability and transparency, shapes the market dynamics by requiring transportation providers to invest in compliance measures and technologies to meet industry standards. Global trade patterns significantly impact the market dynamics of perishable goods transportation. With the globalization of supply chains, perishable goods are transported across borders, connecting producers to consumers worldwide. Changes in trade agreements, geopolitical factors, and shifts in consumer preferences for exotic or seasonal products influence the demand for perishable goods transportation services. The ability to efficiently transport goods over long distances while maintaining quality becomes a crucial aspect of market dynamics in response to the global nature of perishable goods trade. The increasing demand for efficient and reliable perishable goods transportation solutions is a driving force behind market dynamics. Consumers expect a steady supply of fresh produce, pharmaceuticals, and other perishable items, regardless of geographical locations and seasonal variations. This demand puts pressure on logistics providers to optimize transportation routes, minimize transit times, and invest in technologies that ensure the preservation of product quality. The competitive landscape of the perishable goods transportation market is shaped by the ability of providers to meet these demands while adhering to safety and regulatory requirements. Competition within the market fosters innovation and efficiency in perishable goods transportation. Logistics companies are continually striving to differentiate themselves by offering advanced cold chain solutions, incorporating sustainable practices, and optimizing last-mile delivery. Collaborations between transportation providers, technology companies, and stakeholders in the perishable goods supply chain contribute to ongoing research and development, driving innovation and influencing the competitive landscape of the market. Socio-economic factors, including population growth, urbanization, and dietary preferences, contribute to the market dynamics of perishable goods transportation. As urban populations increase and consumer preferences shift towards fresh and diverse food options, the demand for efficient and reliable transportation of perishable goods rises. Economic trends, such as rising income levels, also impact the consumption patterns of perishable goods, shaping the overall market dynamics.

    Market Summary

    The Global Perishable Goods Transportation Market is projected to grow from 5.29 USD Billion in 2024 to 12.99 USD Billion by 2035, reflecting a robust growth trajectory.

    Key Market Trends & Highlights

    Perishable Goods Transportation Key Trends and Highlights

    • The market is expected to witness a compound annual growth rate of 8.51 percent from 2025 to 2035.
    • By 2035, the market valuation is anticipated to reach 13.0 USD Billion, indicating substantial growth opportunities.
    • in 2024, the market is valued at 5.29 USD Billion, highlighting its current economic significance.
    • Growing adoption of advanced logistics technologies due to increasing demand for fresh produce is a major market driver.

    Market Size & Forecast

    2024 Market Size 5.29 (USD Billion)
    2035 Market Size 12.99 (USD Billion)
    CAGR (2025-2035) 8.50%
    Largest Regional Market Share in 2024 latin_america)

    Major Players

    Africa Express Line Limited, Bay & Bay Transportation, C.H. Robinson Worldwide Inc, CMA CGM Group (MERIT France SAS), DB Schenker, Deutsche Post AG, FST Logistics Inc, Hapag-Lloyd AG, Hellmann Worldwide Logistics SE, K Line Logistics Ltd (Kawasaki Kisen Kaisha Ltd)

    Market Trends

    Growing demand for fresh and perishable products is driving the market growth

    Market CAGR for perishable goods transportation is being driven by the rising demand for the fresh and perishable products. Consumer preferences for healthier and fresher food options, including fruits, vegetables, dairy products, and meat, have led to a surge in the production and consumption of perishable goods. This heightened demand necessitates a seamless and efficient transportation network to ensure the timely delivery of these products from producers to consumers.

    This requires an intricate network of transportation services, including refrigerated trucks, container ships, and air freight, to ensure that products attain their destination without compromising quality. E-commerce trends have also contributed significantly to the growth of transportation of perishable goods. With the increasing the popularity of online grocery shopping and meal kit deliveries, there is a heightened requirement for reliable and temperature-controlled transportation to fulfil last-mile deliveries.

    Companies in the perishable goods transportation market are adapting to these shifts by investing in technology, like real-time tracking and monitoring systems, to provide visibility into the transportation process and maintain the integrity of the perishable products.

    Stringent regulations and quality standards further underscore the importance of specialized transportation for perishable goods. Compliance with the food safety regulations and certification programs requires careful monitoring and documentation of temperature conditions throughout the transportation journey. As a result, the perishable goods transportation market is witnessing continuous innovation to meet and exceed these standards, ensuring the integrity of the cold chain and the quality of the delivered products. Thus driving the Perishable Goods Transportation market revenue.

    The increasing demand for fresh produce and temperature-sensitive goods is driving innovations in logistics and transportation solutions, thereby enhancing the efficiency of the perishable goods supply chain.

    U.S. Department of Agriculture

    Perishable Goods Transportation Market Market Drivers

    Market Growth Projections

    The Global Perishable Goods Transportation Market Industry is poised for substantial growth, with projections indicating a rise from 5.29 USD Billion in 2024 to 13.0 USD Billion by 2035. This growth is underpinned by a compound annual growth rate (CAGR) of 8.51% from 2025 to 2035. Factors contributing to this expansion include rising consumer demand for fresh produce, technological advancements in logistics, and the globalization of food supply chains. As stakeholders adapt to these trends, the market is likely to witness increased investment in cold chain logistics and innovative transportation solutions, ensuring that perishable goods are delivered efficiently and safely.

    Rising Demand for Fresh Produce

    The increasing global demand for fresh produce is a primary driver of the Global Perishable Goods Transportation Market Industry. As consumers become more health-conscious, the preference for fresh fruits and vegetables rises. This trend is particularly evident in urban areas where access to fresh produce is limited. In 2024, the market is valued at 5.29 USD Billion, reflecting the growing need for efficient transportation solutions. Retailers and distributors are investing in advanced logistics systems to ensure that perishable goods reach consumers in optimal condition. This demand is expected to propel the market significantly, with projections indicating a growth to 13.0 USD Billion by 2035.

    Globalization of Food Supply Chains

    The globalization of food supply chains is a significant factor influencing the Global Perishable Goods Transportation Market Industry. As countries engage in international trade, the movement of perishable goods across borders becomes essential. This trend is facilitated by trade agreements and advancements in transportation infrastructure, allowing for quicker delivery times. Countries are increasingly reliant on imports to meet domestic demand for fresh produce, which further drives the need for efficient logistics solutions. The market's growth trajectory is supported by the anticipated CAGR of 8.51% from 2025 to 2035, as stakeholders adapt to the complexities of global supply chains.

    Technological Advancements in Logistics

    Technological innovations are transforming the Global Perishable Goods Transportation Market Industry. The adoption of temperature-controlled logistics, real-time tracking systems, and automated warehousing solutions enhances the efficiency of transporting perishable goods. For instance, the implementation of IoT devices allows for continuous monitoring of temperature and humidity levels during transit, ensuring product integrity. As logistics companies embrace these technologies, they can reduce spoilage rates and improve delivery times. This trend is likely to contribute to the market's projected CAGR of 8.51% from 2025 to 2035, as stakeholders seek to optimize their supply chains and meet consumer expectations.

    Regulatory Compliance and Food Safety Standards

    Regulatory compliance and food safety standards play a crucial role in shaping the Global Perishable Goods Transportation Market Industry. Governments worldwide are implementing stringent regulations to ensure the safety and quality of perishable goods during transportation. Compliance with these regulations necessitates investment in specialized transportation equipment and training for personnel. Companies that prioritize food safety are likely to gain a competitive edge in the market. As the industry adapts to these evolving standards, the focus on maintaining product integrity during transit is expected to drive market growth, aligning with the projected increase in market value from 5.29 USD Billion in 2024 to 13.0 USD Billion by 2035.

    Expansion of E-commerce and Online Grocery Shopping

    The rapid expansion of e-commerce and online grocery shopping is reshaping the Global Perishable Goods Transportation Market Industry. Consumers increasingly prefer the convenience of ordering fresh food online, necessitating efficient logistics solutions to handle perishable items. Major retailers are investing in cold chain logistics to ensure that products remain fresh during transit. This shift is driving demand for specialized transportation services that can cater to the unique requirements of perishable goods. As a result, the market is expected to experience substantial growth, with a valuation of 5.29 USD Billion in 2024 and a forecasted increase to 13.0 USD Billion by 2035.

    Market Segment Insights

    Perishable Goods Transportation Type Insights

    The Perishable Goods Transportation market segmentation, based on type, includes MPS, Dairy and Frozen Desserts, Vegetables & Fruits and Bakery & Confectionery. The MPS segment dominated the market, accounting for the largest market revenue due to its ability to provide comprehensive and streamlined logistics solutions. MPS involves outsourcing transportation management to a third-party provider, allowing companies to emphasizing on their core competencies and benefiting from the expertise and efficiency of logistics specialists. In the perishable goods sector, where precise timing and temperature control are paramount, MPS ensures a seamless cold chain process, reducing the risk of spoilage and maintaining product quality.

    The demand for perishable goods often fluctuates, and MPS allows for scalability and flexibility in transportation resources, optimizing efficiency and reducing costs. Additionally, the increasing complexity of supply chains and the need for real-time visibility make MPS an attractive option for companies seeking end-to-end solutions that encompass planning, execution, and monitoring of transportation of perishable goods.

    Perishable Goods Transportation Mode of Transportation Insights

    The Perishable Goods Transportation market segmentation, based on mode of transportation, includes Rail Transportation, Air Transportation, Marine Transportation and Road Transportation. The road transportation category dominates the market due to its flexibility, cost-effectiveness, and extensive reach into diverse geographical areas. Refrigerated trucks equipped with temperature-controlled systems provide a reliable and efficient means to transport perishable goods, ensuring they reach their destinations within specified temperature ranges. The versatility of road networks allows for seamless door-to-door delivery, making road transportation a preferred choice for the last-mile distribution of perishable products.

    Moreover, the perishable goods industry often involves numerous small-scale producers and suppliers, and road transportation accommodates the fragmented nature of the supply chain by offering accessibility to various locations. Further, air transportation is currently considered the fastest-growing mode for transportation of perishable goods.

    Figure 1: Perishable Goods Transportation Market, by Mode of Transportation, 2022 & 2032 (USD Billion)Source: The Primary Research, Secondary Research, Market Research Future Database and Analyst Review

    Get more detailed insights about Perishable Goods Transportation Market Research Report - Forecast to 2034

    Regional Insights

    By region, the study gives market insights of North America, Europe, Asia-Pacific and the Rest of the World. The North American Perishable Goods Transportation market area dominates this market due to its extensive agricultural production, demand for fresh and perishable products, and a well-developed and efficient road transportation infrastructure. The region's robust supply chain networks, supported by advanced refrigerated trucking and logistics systems, contribute to North America's dominance.

    Further, the prime countries observed in the market report are the US, Canada, Germany, France, the UK, Italy, Spain, Japan, China, India, Australia, South Korea, and Brazil.

    Figure 2: PERISHABLE GOODS TRANSPORTATION MARKET SHARE BY REGION 2022 (USD Billion)PERISHABLE GOODS TRANSPORTATION MARKET SHARE BY REGION 2022Source: The Primary Research, Secondary Research, Market Research Future Database and Analyst Review

    Europe's Perishable Goods Transportation market accounts for the second-largest market share due to the region's thriving food and beverage industry, stringent quality and safety standards, and a well-established and interconnected transportation infrastructure. Further, the German Perishable Goods Transportation market held the largest market share, and the UK Perishable Goods Transportation market was the fastest-growing market in the European region.

    The Asia-Pacific Perishable Goods Transportation Market is expected to grow at the fastest CAGR from the year 2023 to 2032. This is due to the region's rising population, surging urbanization, and a growing middle class, leading to higher demand for fresh and time-sensitive perishable products. Moreover, China’s Perishable Goods Transportation market held the largest market share, and the Indian Perishable Goods Transportation market was the fastest-growing market in the Asia-Pacific region.

    Key Players and Competitive Insights

    Leading market players are investing heavily in the research and development in order to expand their product lines, which will help the Perishable Goods Transportation market grow even more. Market participants are also undertaking different strategic activities to spread their footprint, with important market developments including contractual agreements, new product launches, mergers and acquisitions, higher investments, and collaboration with the other organizations. To expand and survive in the more competitive and rising market climate, the Perishable Goods Transportation industry must offer cost-effective items.

    Manufacturing locally to minimize the operational costs is one of the key business tactics used by the manufacturers in the Perishable Goods Transportation industry to benefit the clients and grow the market sector. In recent years, the Perishable Goods Transportation industry has offered some of the most significant advantages to several industries. Major players in the Perishable Goods Transportation market, including Africa Express Line Limited, Bay & Bay Transportation, C.H.

    Robinson Worldwide Inc, CMA CGM Group (MERIT France SAS), DB Schenker, Deutsche Post AG, FST Logistics Inc, Hapag-Lloyd AG, Hellmann Worldwide Logistics SE, K Line Logistics Ltd (Kawasaki Kisen Kaisha Ltd), and others, are attempting to raise the market requirement by investing in the research and development operations.

    C.H. Robinson Worldwide Inc. is a logistics and transportation services company that has established itself as a major player in the supply chain industry. Headquartered in Eden Prairie, Minnesota, the company operates a vast network that spans the globe, providing a wide range of the transportation and logistics solutions. With a history dating back to 1905, C.H. Robinson has evolved into a Fortune 500 company, leveraging its expertise in freight and logistics to connect shippers and carriers across various industries. In September 2023, C.H.

    Robinson Worldwide, Inc. and Cold Chain Solutions (GCCA) announced a strategic partnership to expand access to GCCA's temperature-controlled transportation and logistics services for C.H. Robinson's customers.

    DHL Forwarding, a division of the logistics giant Deutsche Post DHL Group, stands as a prime player in the freight and logistics industry. With its headquarters in Bonn, Germany, DHL Forwarding specializes in providing air, ocean, and road freight services, offering comprehensive solutions for the efficient and reliable movement of goods across the globe. As one of the world's largest logistics providers, DHL Forwarding leverages an extensive network of offices and agents in over 150 countries, ensuring a seamless and interconnected supply chain.

    In August 2023, DHL Forwarding and EverFresh Logistics partnered to offer a joint airfreight solution for perishable goods, combining DHL's network with EverFresh's expertise in temperature-controlled transportation.

    Key Companies in the Perishable Goods Transportation Market market include

    Industry Developments

    June 2023: UPS Supply Chain Solutions and Emergent Cold partnered to provide integrated warehousing and transportation solutions for customers in the life sciences and healthcare industries, including temperature-controlled services for pharmaceuticals and perishable medical supplies.

    May 2023: XPO Logistics, Inc. and Burris Logistics formed a strategic alliance to expand their refrigerated transportation network and offer customers a wider range of services in the North American food and beverage industry.

    March 2023: Fresh Del Monte Produce Inc. and Mediterranean Shipping Company (MSC) partnered to develop innovative logistics solutions for transporting fresh produce around the world, focusing on sustainability and efficiency.

    Future Outlook

    Perishable Goods Transportation Market Future Outlook

    The Global Perishable Goods Transportation Market is projected to grow at 8.50% CAGR from 2025 to 2035, driven by technological advancements, increasing demand for fresh produce, and globalization of supply chains.

    New opportunities lie in:

    • Invest in advanced cold chain technologies to enhance product shelf life and reduce spoilage.
    • Develop partnerships with local farmers to streamline supply chains and ensure freshness.
    • Leverage data analytics for route optimization and inventory management to improve efficiency.

    By 2035, the market is expected to be robust, reflecting enhanced efficiency and sustainability in perishable goods transportation.

    Market Segmentation

    Perishable Goods Transportation Type Outlook

    • MPS
    • Dairy and Frozen Desserts
    • Vegetables & Fruits
    • Bakery & Confectionery

    Perishable Goods Transportation Regional Outlook

    North America
    • US
    • Canada

    Perishable Goods Transportation Mode of Transportation Outlook

    • Rail Transportation
    • Air Transportation
    • Marine Transportation
    • Road Transportation

    Report Scope

    Report Attribute/Metric Details
    Market Size 2024 USD 5.29 Billion
    Market Size 2025 USD 5.75 Billion
    Market Size 2035 12.99 (Value (USD Billion))
    Compound Annual Growth Rate (CAGR) 8.50% (2025 - 2035)
    Base Year 2024
    Market Forecast Period 2025 - 2035
    Historical Data 2020- 2024
    Market Forecast Units Value (USD Billion)
    Report Coverage Revenue Forecast, The Market Competitive Landscape, Growth Factors, and Trends
    Segments Covered Type, Mode of Transportation, and Region
    Geographies Covered North America, Europe, Asia Pacific, and the Rest of the World
    Countries Covered The US, Canada, Germany, France, UK, Italy, Spain, Japan, China, India, Australia, South Korea, and Brazil
    Key Companies Profiled  Africa Express Line Limited, Bay & Bay Transportation, C.H. Robinson Worldwide Inc, CMA CGM Group (MERIT France SAS), DB Schenker, Deutsche Post AG, FST Logistics Inc, Hapag-Lloyd AG, Hellmann Worldwide Logistics SE, K Line Logistics Ltd (Kawasaki Kisen Kaisha Ltd)
    Key Market Opportunities The advancements in cold chain logistics technology.
    Key Market Dynamics Increased demand for fresh and perishable products.

    Market Highlights

    Author

    Snehal Singh
    Assistant Manager - Research

    She holds an experience of about 6+ years in market research and business consulting, working under the spectrum of information communication technology, telecommunications and semiconductor domains. aarti conceptualizes and implements a scalable business strategy and provides strategic leadership to the clients. her expertise lies in market estimation, competitive intelligence, pipeline analysis, customer assessment, etc.

    Leave a Comment

    Latest Comments

    John Doe
    john@example.com

    This is a great article! Really helped me understand the topic better.

    Posted on July 23, 2025, 10:15 AM
    Jane Smith
    jane@domain.com

    Thanks for sharing this. I’ve bookmarked it for later reference.

    Posted on July 22, 2025, 7:45 PM

    FAQs

    How much is the Perishable Goods Transportation market?

    The Perishable Goods Transportation market size was valued at USD 5.29 Billion in 2024.

    What is the growth rate of the Perishable Goods Transportation market?

    The market is foreseen to rise at a CAGR of 8.5% during the forecast period, 2025-2034.

    Which region held the biggest market share in the Perishable Goods Transportation market?

    North America held the largest share of the market

    Who are the prime players in the Perishable Goods Transportation market?

    The key players in the market are Africa Express Line Limited, Bay & Bay Transportation, C.H. Robinson Worldwide Inc, CMA CGM Group (MERIT France SAS), DB Schenker, Deutsche Post AG, FST Logistics Inc, Hapag-Lloyd AG, Hellmann Worldwide Logistics SE, K Line Logistics Ltd (Kawasaki Kisen Kaisha Ltd).

    Which type led the Perishable Goods Transportation market?

    The MPS category dominated the market in 2022.

    Which mode of transportation had the largest market share in the Perishable Goods Transportation market?

    Road transportation had the largest share of the market.

    1. List of Tables and Figures
      1. Table of Contents 1. Executive Summary 2. Market Introduction 2.1. Definition 2.2. Scope of the Study 2.2.1. Research Objective 2.2.2. Assumptions 2.2.3. Limitations 3. Research Methodology 3.1. Overview 3.2. Data Mining 3.3. Secondary Research 3.4. Primary Research 3.4.1. Primary Interviews and Information Gathering Process 3.4.2. Breakdown of Primary Respondents 3.5. Forecasting Model 3.6. Market Size Estimation 3.6.1. Bottom-up Approach 3.6.2. Top-Down Approach 3.7. Data Triangulation 3.8. Validation 4. MARKET DYNAMICS 4.1. Overview 4.2. Drivers 4.3. Restraints 4.4. Opportunities 5. MARKET FACTOR ANALYSIS 5.1. Value Chain Analysis 5.2. Porter’s Five Forces Analysis 5.2.1. Bargaining Power of Suppliers 5.2.2. Bargaining Power of Buyers 5.2.3. Threat of New Entrants 5.2.4. Threat of Substitutes 5.2.5. Intensity of Rivalry 5.3. COVID-19 Impact Analysis 5.3.1. Market Impact Analysis 5.3.2. Regional Impact 5.3.3. Opportunity and Threat Analysis 6. GLOBAL PERISHABLE GOODS TRANSPORTATION MARKET, BY TYPE 6.1. Overview 6.2. MPS 6.3. Dairy and Frozen Desserts 6.4. Vegetables & Fruits 6.5. Bakery & Confectionery 7. GLOBAL PERISHABLE GOODS TRANSPORTATION MARKET, BY MODE OF TRANSPORTATION 7.1. Overview 7.2. Rail Transportation 7.3. Air Transportation 7.4. Marine Transportation 7.5. Road Transportation 8. GLOBAL PERISHABLE GOODS TRANSPORTATION MARKET, BY REGION 8.1. Overview 8.1. North America 8.1.1. US 8.1.2. Canada 8.2. Europe 8.2.1. Germany 8.2.2. France 8.2.3. UK 8.2.4. Italy 8.2.5. Spain 8.2.6. Rest of Europe 8.3. Asia-Pacific 8.3.1. China 8.3.2. India 8.3.3. Japan 8.3.4. South Korea 8.3.5. Australia 8.3.6. Rest of Asia-Pacific 8.4. Rest of the World 8.4.1. Middle East 8.4.2. Africa 8.4.3. Latin America 9. Competitive Landscape 9.1. Overview 9.2. Competitive Analysis 9.3. Market Share Analysis 9.4. Major Growth Strategy in the Global Perishable Goods Transportation Market, 9.5. Competitive Benchmarking 9.6. Leading Players in Terms of Number of Developments in the Global Perishable Goods Transportation Market, 9.7. Key developments and Growth Strategies 9.7.1. New Product Launch/Service Deployment 9.7.2. Merger & Acquisitions 9.7.3. Joint Ventures 9.8. Major Players Financial Matrix 9.8.1. Sales & Operating Income, 2022 9.8.2. Major Players R&D Expenditure. 2022 10. COMPANY PROFILES 10.1. Africa Express Line Limited 10.1.1. Company Overview 10.1.2. Financial Overview 10.1.3. Products Offered 10.1.4. Key Developments 10.1.5. SWOT Analysis 10.1.6. Key Strategies 10.2. Bay & Bay Transportation 10.2.1. Company Overview 10.2.2. Financial Overview 10.2.3. Products Offered 10.2.4. Key Developments 10.2.5. SWOT Analysis 10.2.6. Key Strategies 10.3. C.H. ROBINSON WORLDWIDE INC 10.3.1. Company Overview 10.3.2. Financial Overview 10.3.3. Products Offered 10.3.4. Key Developments 10.3.5. SWOT Analysis 10.3.6. Key Strategies 10.4. CMA CGM Group (MERIT France SAS) 10.4.1. Company Overview 10.4.2. Financial Overview 10.4.3. Products Offered 10.4.4. Key Developments 10.4.5. SWOT Analysis 10.4.6. Key Strategies 10.5. DB Schenker 10.5.1. Company Overview 10.5.2. Financial Overview 10.5.3. Products Offered 10.5.4. Key Developments 10.5.5. SWOT Analysis 10.5.6. Key Strategies 10.6. Deutsche Post AG 10.6.1. Company Overview 10.6.2. Financial Overview 10.6.3. Products Offered 10.6.4. Key Developments 10.6.5. SWOT Analysis 10.6.6. Key Strategies 10.7. FST Logistics Inc 10.7.1. Company Overview 10.7.2. Financial Overview 10.7.3. Products Offered 10.7.4. Key Developments 10.7.5. SWOT Analysis 10.7.6. Key Strategies 10.8. Hapag-Lloyd AG 10.8.1. Company Overview 10.8.2. Financial Overview 10.8.3. Products Offered 10.8.4. Key Developments 10.8.5. SWOT Analysis 10.8.6. Key Strategies 10.9. Hellmann Worldwide Logistics SE 10.9.1. Company Overview 10.9.2. Financial Overview 10.9.3. Products Offered 10.9.4. Key Developments 10.9.5. SWOT Analysis 10.9.6. Key Strategies 10.10. K Line Logistics Ltd (Kawasaki Kisen Kaisha Ltd) 10.10.1. Company Overview 10.10.2. Financial Overview 10.10.3. Products Offered 10.10.4. Key Developments 10.10.5. SWOT Analysis 10.10.6. Key Strategies 11. APPENDIX 11.1. References 11.2. Related Reports LIST OF TABLES
      2. TABLE 1 GLOBAL PERISHABLE GOODS TRANSPORTATION MARKET, SYNOPSIS, 2018-2032
      3. TABLE 2 GLOBAL PERISHABLE GOODS TRANSPORTATION MARKET, ESTIMATES & FORECAST, 2018-2032 (USD BILLION)
      4. TABLE 3 GLOBAL PERISHABLE GOODS TRANSPORTATION MARKET, BY TYPE, 2018-2032 (USD BILLION)
      5. TABLE 4 GLOBAL PERISHABLE GOODS TRANSPORTATION MARKET, BY MODE OF TRANSPORTATION, 2018-2032 (USD BILLION)
      6. TABLE 5 NORTH AMERICA: PERISHABLE GOODS TRANSPORTATION MARKET, BY TYPE, 2018-2032 (USD BILLION)
      7. TABLE 6 NORTH AMERICA: PERISHABLE GOODS TRANSPORTATION MARKET, BY MODE OF TRANSPORTATION, 2018-2032 (USD BILLION)
      8. TABLE 7 US: PERISHABLE GOODS TRANSPORTATION MARKET, BY TYPE, 2018-2032 (USD BILLION)
      9. TABLE 8 US: PERISHABLE GOODS TRANSPORTATION MARKET, BY MODE OF TRANSPORTATION, 2018-2032 (USD BILLION)
      10. TABLE 9 CANADA: PERISHABLE GOODS TRANSPORTATION MARKET, BY TYPE, 2018-2032 (USD BILLION)
      11. TABLE 10 CANADA: PERISHABLE GOODS TRANSPORTATION MARKET, BY MODE OF TRANSPORTATION, 2018-2032 (USD BILLION)
      12. TABLE 1 EUROPE: PERISHABLE GOODS TRANSPORTATION MARKET, BY TYPE, 2018-2032 (USD BILLION)
      13. TABLE 2 EUROPE: PERISHABLE GOODS TRANSPORTATION MARKET, BY MODE OF TRANSPORTATION, 2018-2032 (USD BILLION)
      14. TABLE 3 GERMANY: PERISHABLE GOODS TRANSPORTATION MARKET, BY TYPE, 2018-2032 (USD BILLION)
      15. TABLE 4 GERMANY: PERISHABLE GOODS TRANSPORTATION MARKET, BY MODE OF TRANSPORTATION, 2018-2032 (USD BILLION)
      16. TABLE 5 FRANCE: PERISHABLE GOODS TRANSPORTATION MARKET, BY TYPE, 2018-2032 (USD BILLION)
      17. TABLE 6 FRANCE: PERISHABLE GOODS TRANSPORTATION MARKET, BY MODE OF TRANSPORTATION, 2018-2032 (USD BILLION)
      18. TABLE 7 ITALY: PERISHABLE GOODS TRANSPORTATION MARKET, BY TYPE, 2018-2032 (USD BILLION)
      19. TABLE 8 ITALY: PERISHABLE GOODS TRANSPORTATION MARKET, BY MODE OF TRANSPORTATION, 2018-2032 (USD BILLION)
      20. TABLE 9 SPAIN: PERISHABLE GOODS TRANSPORTATION MARKET, BY TYPE, 2018-2032 (USD BILLION)
      21. TABLE 10 SPAIN: PERISHABLE GOODS TRANSPORTATION MARKET, BY MODE OF TRANSPORTATION, 2018-2032 (USD BILLION)
      22. TABLE 11 UK: PERISHABLE GOODS TRANSPORTATION MARKET, BY TYPE, 2018-2032 (USD BILLION)
      23. TABLE 12 UK: PERISHABLE GOODS TRANSPORTATION MARKET, BY MODE OF TRANSPORTATION, 2018-2032 (USD BILLION)
      24. TABLE 13 REST OF EUROPE: PERISHABLE GOODS TRANSPORTATION MARKET, BY TYPE, 2018-2032 (USD BILLION)
      25. TABLE 14 REST OF EUROPE: PERISHABLE GOODS TRANSPORTATION MARKET, BY MODE OF TRANSPORTATION, 2018-2032 (USD BILLION)
      26. TABLE 15 ASIA-PACIFIC: PERISHABLE GOODS TRANSPORTATION MARKET, BY TYPE, 2018-2032 (USD BILLION)
      27. TABLE 16 ASIA-PACIFIC: PERISHABLE GOODS TRANSPORTATION MARKET, BY MODE OF TRANSPORTATION, 2018-2032 (USD BILLION)
      28. TABLE 17 JAPAN: PERISHABLE GOODS TRANSPORTATION MARKET, BY TYPE, 2018-2032 (USD BILLION)
      29. TABLE 18 JAPAN: PERISHABLE GOODS TRANSPORTATION MARKET, BY MODE OF TRANSPORTATION, 2018-2032 (USD BILLION)
      30. TABLE 19 CHINA: PERISHABLE GOODS TRANSPORTATION MARKET, BY TYPE, 2018-2032 (USD BILLION)
      31. TABLE 20 CHINA: PERISHABLE GOODS TRANSPORTATION MARKET, BY MODE OF TRANSPORTATION, 2018-2032 (USD BILLION)
      32. TABLE 21 INDIA: PERISHABLE GOODS TRANSPORTATION MARKET, BY TYPE, 2018-2032 (USD BILLION)
      33. TABLE 22 INDIA: PERISHABLE GOODS TRANSPORTATION MARKET, BY MODE OF TRANSPORTATION, 2018-2032 (USD BILLION)
      34. TABLE 23 AUSTRALIA: PERISHABLE GOODS TRANSPORTATION MARKET, BY TYPE, 2018-2032 (USD BILLION)
      35. TABLE 24 AUSTRALIA: PERISHABLE GOODS TRANSPORTATION MARKET, BY MODE OF TRANSPORTATION, 2018-2032 (USD BILLION)
      36. TABLE 25 SOUTH KOREA: PERISHABLE GOODS TRANSPORTATION MARKET, BY TYPE, 2018-2032 (USD BILLION)
      37. TABLE 26 SOUTH KOREA: PERISHABLE GOODS TRANSPORTATION MARKET, BY MODE OF TRANSPORTATION, 2018-2032 (USD BILLION)
      38. TABLE 27 REST OF ASIA-PACIFIC: PERISHABLE GOODS TRANSPORTATION MARKET, BY TYPE, 2018-2032 (USD BILLION)
      39. TABLE 28 REST OF ASIA-PACIFIC: PERISHABLE GOODS TRANSPORTATION MARKET, BY MODE OF TRANSPORTATION, 2018-2032 (USD BILLION)
      40. TABLE 29 REST OF THE WORLD: PERISHABLE GOODS TRANSPORTATION MARKET, BY TYPE, 2018-2032 (USD BILLION)
      41. TABLE 30 REST OF THE WORLD: PERISHABLE GOODS TRANSPORTATION MARKET, BY MODE OF TRANSPORTATION, 2018-2032 (USD BILLION)
      42. TABLE 31 MIDDLE EAST: PERISHABLE GOODS TRANSPORTATION MARKET, BY TYPE, 2018-2032 (USD BILLION)
      43. TABLE 32 MIDDLE EAST: PERISHABLE GOODS TRANSPORTATION MARKET, BY MODE OF TRANSPORTATION, 2018-2032 (USD BILLION)
      44. TABLE 33 AFRICA: PERISHABLE GOODS TRANSPORTATION MARKET, BY TYPE, 2018-2032 (USD BILLION)
      45. TABLE 34 AFRICA: PERISHABLE GOODS TRANSPORTATION MARKET, BY MODE OF TRANSPORTATION, 2018-2032 (USD BILLION)
      46. TABLE 35 LATIN AMERICA: PERISHABLE GOODS TRANSPORTATION MARKET, BY TYPE, 2018-2032 (USD BILLION)
      47. TABLE 36 LATIN AMERICA: PERISHABLE GOODS TRANSPORTATION MARKET, BY MODE OF TRANSPORTATION, 2018-2032 (USD BILLION) LIST OF FIGURES
      48. FIGURE 1 RESEARCH PROCESS
      49. FIGURE 2 MARKET STRUCTURE FOR THE GLOBAL PERISHABLE GOODS TRANSPORTATION MARKET
      50. FIGURE 3 MARKET DYNAMICS FOR THE GLOBAL PERISHABLE GOODS TRANSPORTATION MARKET
      51. FIGURE 4 GLOBAL PERISHABLE GOODS TRANSPORTATION MARKET, SHARE (%), BY TYPE, 2022
      52. FIGURE 5 GLOBAL PERISHABLE GOODS TRANSPORTATION MARKET, SHARE (%), BY MODE OF TRANSPORTATION, 2022
      53. FIGURE 6 GLOBAL PERISHABLE GOODS TRANSPORTATION MARKET, SHARE (%), BY REGION, 2022
      54. FIGURE 7 NORTH AMERICA: PERISHABLE GOODS TRANSPORTATION MARKET, SHARE (%), BY REGION, 2022
      55. FIGURE 8 EUROPE: PERISHABLE GOODS TRANSPORTATION MARKET, SHARE (%), BY REGION, 2022
      56. FIGURE 9 ASIA-PACIFIC: PERISHABLE GOODS TRANSPORTATION MARKET, SHARE (%), BY REGION, 2022
      57. FIGURE 10 REST OF THE WORLD: PERISHABLE GOODS TRANSPORTATION MARKET, SHARE (%), BY REGION, 2022
      58. FIGURE 11 GLOBAL PERISHABLE GOODS TRANSPORTATION MARKET: COMPANY SHARE ANALYSIS, 2022 (%)
      59. FIGURE 12 AFRICA EXPRESS LINE LIMITED: FINANCIAL OVERVIEW SNAPSHOT
      60. FIGURE 13 AFRICA EXPRESS LINE LIMITED: SWOT ANALYSIS
      61. FIGURE 14 BAY & BAY TRANSPORTATION: FINANCIAL OVERVIEW SNAPSHOT
      62. FIGURE 15 BAY & BAY TRANSPORTATION: SWOT ANALYSIS
      63. FIGURE 16 C.H. ROBINSON WORLDWIDE INC: FINANCIAL OVERVIEW SNAPSHOT
      64. FIGURE 17 C.H. ROBINSON WORLDWIDE INC: SWOT ANALYSIS
      65. FIGURE 18 CMA CGM GROUP (MERIT FRANCE SAS): FINANCIAL OVERVIEW SNAPSHOT
      66. FIGURE 19 CMA CGM GROUP (MERIT FRANCE SAS): SWOT ANALYSIS
      67. FIGURE 20 DB SCHENKER: FINANCIAL OVERVIEW SNAPSHOT
      68. FIGURE 21 DB SCHENKER: SWOT ANALYSIS
      69. FIGURE 22 DEUTSCHE POST AG: FINANCIAL OVERVIEW SNAPSHOT
      70. FIGURE 23 DEUTSCHE POST AG: SWOT ANALYSIS
      71. FIGURE 24 FST LOGISTICS INC: FINANCIAL OVERVIEW SNAPSHOT
      72. FIGURE 25 FST LOGISTICS INC: SWOT ANALYSIS
      73. FIGURE 26 HAPAG-LLOYD AG: FINANCIAL OVERVIEW SNAPSHOT
      74. FIGURE 27 HAPAG-LLOYD AG: SWOT ANALYSIS
      75. FIGURE 28 HELLMANN WORLDWIDE LOGISTICS SE: FINANCIAL OVERVIEW SNAPSHOT
      76. FIGURE 29 HELLMANN WORLDWIDE LOGISTICS SE: SWOT ANALYSIS
      77. FIGURE 30 K LINE LOGISTICS LTD (KAWASAKI KISEN KAISHA LTD): FINANCIAL OVERVIEW SNAPSHOT
      78. FIGURE 31 K LINE LOGISTICS LTD (KAWASAKI KISEN KAISHA LTD): SWOT ANALYSIS


    Perishable Goods Transportation Market Segmentation

    Perishable Goods Transportation Type Outlook (USD Billion, 2018-2032)

    • MPS
    • Dairy and Frozen Desserts
    • Vegetables & Fruits
    • Bakery & Confectionery

    Perishable Goods Transportation Mode of Transportation Outlook (USD Billion, 2018-2032)

    • Rail Transportation
    • Air Transportation
    • Marine Transportation
    • Road Transportation

    Perishable Goods Transportation Regional Outlook (USD Billion, 2018-2032)

    • North America Outlook (USD Billion, 2018-2032)

      • North America Perishable Goods Transportation by Type
        • MPS
        • Dairy and Frozen Desserts
        • Vegetables & Fruits
        • Bakery & Confectionery
      • North America Perishable Goods Transportation by Mode of Transportation
        • Rail Transportation
        • Air Transportation
        • Marine Transportation
        • Road Transportation
      • US Outlook (USD Billion, 2018-2032)

      • US Perishable Goods Transportation by Type
        • MPS
        • Dairy and Frozen Desserts
        • Vegetables & Fruits
        • Bakery & Confectionery
      • US Perishable Goods Transportation by Mode of Transportation
        • Rail Transportation
        • Air Transportation
        • Marine Transportation
        • Road Transportation
      • CANADA Outlook (USD Billion, 2018-2032)

      • CANADA Perishable Goods Transportation by Type
        • MPS
        • Dairy and Frozen Desserts
        • Vegetables & Fruits
        • Bakery & Confectionery
      • CANADA Perishable Goods Transportation by Mode of Transportation
        • Rail Transportation
        • Air Transportation
        • Marine Transportation
        • Road Transportation
    • Europe Outlook (USD Billion, 2018-2032)

      • Europe Perishable Goods Transportation by Type
        • MPS
        • Dairy and Frozen Desserts
        • Vegetables & Fruits
        • Bakery & Confectionery
      • Europe Perishable Goods Transportation by Mode of Transportation
        • Rail Transportation
        • Air Transportation
        • Marine Transportation
        • Road Transportation
      • Germany Outlook (USD Billion, 2018-2032)

      • Germany Perishable Goods Transportation by Type
        • MPS
        • Dairy and Frozen Desserts
        • Vegetables & Fruits
        • Bakery & Confectionery
      • Germany Perishable Goods Transportation by Mode of Transportation
        • Rail Transportation
        • Air Transportation
        • Marine Transportation
        • Road Transportation
      • France Outlook (USD Billion, 2018-2032)

      • France Perishable Goods Transportation by Type
        • MPS
        • Dairy and Frozen Desserts
        • Vegetables & Fruits
        • Bakery & Confectionery
      • France Perishable Goods Transportation by Mode of Transportation
        • Rail Transportation
        • Air Transportation
        • Marine Transportation
        • Road Transportation
      • UK Outlook (USD Billion, 2018-2032)

      • UK Perishable Goods Transportation by Type
        • MPS
        • Dairy and Frozen Desserts
        • Vegetables & Fruits
        • Bakery & Confectionery
      • UK Perishable Goods Transportation by Mode of Transportation
        • Rail Transportation
        • Air Transportation
        • Marine Transportation
        • Road Transportation
      • ITALY Outlook (USD Billion, 2018-2032)

      • ITALY Perishable Goods Transportation by Type
        • MPS
        • Dairy and Frozen Desserts
        • Vegetables & Fruits
        • Bakery & Confectionery
      • ITALY Perishable Goods Transportation by Mode of Transportation
        • Rail Transportation
        • Air Transportation
        • Marine Transportation
        • Road Transportation
      • SPAIN Outlook (USD Billion, 2018-2032)

      • Spain Perishable Goods Transportation by Type
        • MPS
        • Dairy and Frozen Desserts
        • Vegetables & Fruits
        • Bakery & Confectionery
      • Spain Perishable Goods Transportation by Mode of Transportation
        • Rail Transportation
        • Air Transportation
        • Marine Transportation
        • Road Transportation
      • Rest Of Europe Outlook (USD Billion, 2018-2032)

      • Rest Of Europe Perishable Goods Transportation by Type
        • MPS
        • Dairy and Frozen Desserts
        • Vegetables & Fruits
        • Bakery & Confectionery
      • REST OF EUROPE Perishable Goods Transportation by Mode of Transportation
        • Rail Transportation
        • Air Transportation
        • Marine Transportation
        • Road Transportation
    • Asia-Pacific Outlook (USD Billion, 2018-2032)

      • Asia-Pacific Perishable Goods Transportation by Type
        • MPS
        • Dairy and Frozen Desserts
        • Vegetables & Fruits
        • Bakery & Confectionery
      • Asia-Pacific Perishable Goods Transportation by Mode of Transportation
        • Rail Transportation
        • Air Transportation
        • Marine Transportation
        • Road Transportation
      • China Outlook (USD Billion, 2018-2032)

      • China Perishable Goods Transportation by Type
        • MPS
        • Dairy and Frozen Desserts
        • Vegetables & Fruits
        • Bakery & Confectionery
      • China Perishable Goods Transportation by Mode of Transportation
        • Rail Transportation
        • Air Transportation
        • Marine Transportation
        • Road Transportation
      • Japan Outlook (USD Billion, 2018-2032)

      • Japan Perishable Goods Transportation by Type
        • MPS
        • Dairy and Frozen Desserts
        • Vegetables & Fruits
        • Bakery & Confectionery
      • Japan Perishable Goods Transportation by Mode of Transportation
        • Rail Transportation
        • Air Transportation
        • Marine Transportation
        • Road Transportation
      • India Outlook (USD Billion, 2018-2032)

      • India Perishable Goods Transportation by Type
        • MPS
        • Dairy and Frozen Desserts
        • Vegetables & Fruits
        • Bakery & Confectionery
      • India Perishable Goods Transportation by Mode of Transportation
        • Rail Transportation
        • Air Transportation
        • Marine Transportation
        • Road Transportation
      • Australia Outlook (USD Billion, 2018-2032)

      • Australia Perishable Goods Transportation by Type
        • MPS
        • Dairy and Frozen Desserts
        • Vegetables & Fruits
        • Bakery & Confectionery
      • Australia Perishable Goods Transportation by Mode of Transportation
        • Rail Transportation
        • Air Transportation
        • Marine Transportation
        • Road Transportation
      • Rest of Asia-Pacific Outlook (USD Billion, 2018-2032)

      • Rest of Asia-Pacific Perishable Goods Transportation by Type
        • MPS
        • Dairy and Frozen Desserts
        • Vegetables & Fruits
        • Bakery & Confectionery
      • Rest of Asia-Pacific Perishable Goods Transportation by Mode of Transportation
        • Rail Transportation
        • Air Transportation
        • Marine Transportation
        • Road Transportation
    • Rest of the World Outlook (USD Billion, 2018-2032)

      • Rest of the World Perishable Goods Transportation by Type
        • MPS
        • Dairy and Frozen Desserts
        • Vegetables & Fruits
        • Bakery & Confectionery
      • Rest of the World Perishable Goods Transportation by Mode of Transportation
        • Rail Transportation
        • Air Transportation
        • Marine Transportation
        • Road Transportation
      • Middle East Outlook (USD Billion, 2018-2032)

      • Middle East Perishable Goods Transportation by Type
        • MPS
        • Dairy and Frozen Desserts
        • Vegetables & Fruits
        • Bakery & Confectionery
      • Middle East Perishable Goods Transportation by Mode of Transportation
        • Rail Transportation
        • Air Transportation
        • Marine Transportation
        • Road Transportation
      • Africa Outlook (USD Billion, 2018-2032)

      • Africa Perishable Goods Transportation by Type
        • MPS
        • Dairy and Frozen Desserts
        • Vegetables & Fruits
        • Bakery & Confectionery
      • Africa Perishable Goods Transportation by Mode of Transportation
        • Rail Transportation
        • Air Transportation
        • Marine Transportation
        • Road Transportation
      • Latin America Outlook (USD Billion, 2018-2032)

      • Latin America Perishable Goods Transportation by Type
        • MPS
        • Dairy and Frozen Desserts
        • Vegetables & Fruits
        • Bakery & Confectionery
      • Latin America Perishable Goods Transportation by Mode of Transportation
        • Rail Transportation
        • Air Transportation
        • Marine Transportation
        • Road Transportation
    Infographic

    Free Sample Request

    Kindly complete the form below to receive a free sample of this Report

    Get Free Sample

    Customer Strories

    “I am very pleased with how market segments have been defined in a relevant way for my purposes (such as "Portable Freezers & refrigerators" and "last-mile"). In general the report is well structured. Thanks very much for your efforts.”

    Victoria Milne

    Founder
    Case Study
    Chemicals and Materials