×
Hero Background
English
Chinese
French
Japanese
Korean
German
Spanish

Plastic Stabilizer Market Analysis

ID: MRFR/CnM/3031-CR
123 Pages
Chitranshi Jaiswal
September 2017

Plastic Stabilizer Market Research Report Information: Type (Heat Stabilizer, Antioxidant, Light Stabilizer and Others), Material (Thermoplastic, Thermosetting and Elastomers) and by End-Use Industry (Packaging, Building & Construction, Automotive, Consumer Goods, Electrical & Electronics, Agriculture and Others) - Forecast till 2035

Share:
Download PDF ×

We do not share your information with anyone. However, we may send you emails based on your report interest from time to time. You may contact us at any time to opt-out.

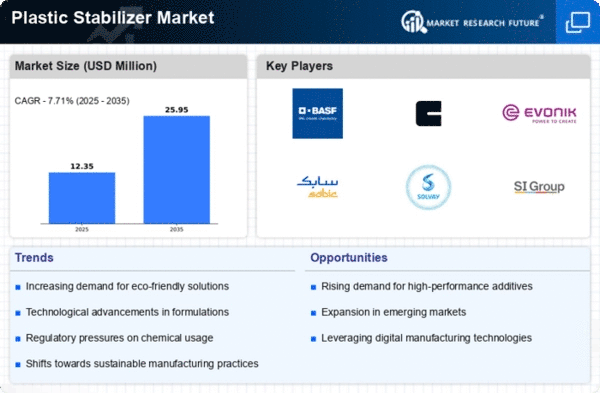
Plastic Stabilizer Market Infographic
Purchase Options

Market Analysis

In-depth Analysis of Plastic Stabilizer Market Industry Landscape

Plastics play a colossal role in our daily lives, dominating various essential applications like packaging films, containers, fibers, PVC pipes, automotive design, agricultural films, and more. At the core of this pervasive plastic use lies the crucial component known as plastic stabilizer.

In the realm of packaging, the transition from traditional materials like papers and leaves to plastics has been a game-changer. The convenience and practicality that plastics offer have led consumers to prefer plastic packaging, altering age-old practices. Agriculture, too, has witnessed a shift with the aggressive integration of plastic stabilizers. Greenhouse films and mulches, made possible by these stabilizers, have become integral components in modern agricultural practices. Furthermore, the widespread use of plastics in everyday items, consumer goods, electrical appliances, and construction materials has spurred a growing demand for plastic stabilizers.

The epicenter of this surge in demand is the Asia Pacific region, which stands as the largest and fastest-growing market for plastic stabilizers. Notably, the robust demand from developing powerhouses like China and India has propelled the global market for plastic stabilizers. Projections indicate that the Asia Pacific region will contribute to over 40% of the global plastic stabilizer market in the next five years. This unprecedented growth is notably witnessed in countries like China, Japan, South Korea, and Taiwan, where the electrical and electronic industry has undergone significant advancements. The upswing in plastic stabilizer consumption is intricately linked to the remarkable strides made in infrastructure development, particularly in China and India, fueled by substantial investments.

The allure of plastic stabilizers lies in their ability to enhance the durability and performance of plastics, making them more suitable for diverse applications. These stabilizers act as guardians, ensuring that the integrity of plastics is maintained, especially when subjected to external factors such as heat, light, and other environmental conditions.

As industries continue to rely heavily on plastics for their varied needs, the demand for plastic stabilizers is poised to escalate further. The reliance on plastic packaging, the agricultural shift towards plastic-based solutions, and the persistent use of plastics in sectors like electronics and construction underscore the indispensability of plastic stabilizers in our modern, plastic-dominated world.

The widespread consumption of plastics in our daily lives has placed plastic stabilizers at the forefront of ensuring the resilience and adaptability of plastic materials. The escalating demand, particularly in the dynamic Asia Pacific region, signifies the pivotal role that plastic stabilizers play in sustaining and advancing our plastic-dependent way of life.

Author
Chitranshi Jaiswal
Research Analyst Level I

In her 3 years of experience in the market research field, she has handled critical cross-domain projects. She has an in-depth knowledge of market estimation & analysis, problem-solving, primary as well as secondary research, and team management.She holds an engineering degree and is an MBA professional from a well-known university, capable of evaluating the market and competitive conditions. An exceptional strategist with excellent communication skills and a passion for delivering cutting-edge & practical insights for the market. Proficient in multi-tasking, and can successfully deal with competing demands, while maintaining complete confidentiality. Generated business through active client and project development, networking, and high-quality responses. Her knowledge and skills have helped in making solid business decisions, securing funding from investors, and avoiding business failures.

Leave a Comment

FAQs

At what CAGR is the Plastic Stabilizer Market predicted to grow during the forecast period?

Plastic Stabilizer Market is predicted to grow at 4.5% through forecast period of 2025-2035.

What is the forecast period of Plastic Stabilizer Market research report?

The forecast period for Plastic Stabilizer Market research report is 2025-2035.

Who are the key players in the Plastic Stabilizer Market?

The prominent players operating in the Plastic Stabilizer Market include BASF SE (Germany),Songwon Industrial Co., Ltd. (South Korea),Clariant AG (Switzerland),Akzo Nobel N.V. (The Netherlands), Evonik Industries AG (Germany),ADEKA CORPORATION (Japan),Solvay SA (Belgium),INDOFIL INDUSTRIES LIMITED (India),Bruggemann Group (Germany),Baerlocher GmbH (Germany)

Market Summary

The Global Plastic Stabilizer Market is projected to grow from 6.33 USD Billion in 2024 to 11.5 USD Billion by 2035, reflecting a robust growth trajectory.

Key Market Trends & Highlights

Plastic Stabilizer Market Key Trends and Highlights

  • The market is expected to expand at a compound annual growth rate (CAGR) of 5.58% from 2025 to 2035.
  • By 2035, the market valuation is anticipated to reach 11.5 USD Billion, indicating substantial growth opportunities.
  • In 2024, the market is valued at 6.33 USD Billion, showcasing its current economic significance.
  • Growing adoption of advanced plastic formulations due to increasing demand for durability is a major market driver.

Market Size & Forecast

2024 Market Size 6.33 (USD Million)
2035 Market Size 11.5 (USD Million)
CAGR (2025-2035) 5.58%
Largest Regional Market Share in 2024 latin_america)

Major Players

BASF SE (Germany), Songwon Industrial Co., Ltd. (South Korea), Clariant AG (Switzerland), Akzo Nobel N.V. (The Netherlands), Evonik Industries AG (Germany), ADEKA CORPORATION (Japan), Solvay SA (Belgium), INDOFIL INDUSTRIES LIMITED (India), Bruggemann Group (Germany), Baerlocher GmbH (Germany)

Market Trends

Plastic Stabilizer Market Market Drivers

Market Growth Projections

The Global Plastic Stabilizer Market Industry is poised for substantial growth, with projections indicating a market value of 6.33 USD Billion in 2024 and an anticipated increase to 11.5 USD Billion by 2035. This growth trajectory reflects a compound annual growth rate of 5.58% from 2025 to 2035. The expansion is driven by various factors, including rising demand for durable plastics, technological advancements in stabilizer formulations, and increasing regulatory compliance. As industries continue to evolve and prioritize sustainability, the market for plastic stabilizers is expected to flourish, presenting opportunities for innovation and investment.

Growth in End-Use Industries

The expansion of end-use industries such as packaging, electronics, and construction significantly impacts the Global Plastic Stabilizer Market Industry. As these sectors grow, the demand for high-performance plastics that require stabilizers increases correspondingly. For example, the packaging industry is witnessing a surge in the use of flexible and rigid plastics, necessitating effective stabilizers to enhance product performance and shelf life. This growth trajectory is expected to propel the market, with analysts forecasting a valuation of 6.33 USD Billion in 2024. The interplay between industry growth and the need for advanced stabilizers creates a robust environment for market expansion.

Rising Demand for Durable Plastics

The Global Plastic Stabilizer Market Industry experiences a notable increase in demand for durable plastics across various sectors, including automotive, construction, and consumer goods. As industries prioritize longevity and performance, the need for effective stabilizers becomes paramount. For instance, the automotive sector is increasingly utilizing high-performance plastics that require stabilizers to withstand environmental stressors. This trend is projected to contribute to the market's growth, with the industry valued at 6.33 USD Billion in 2024. The emphasis on sustainability and recyclability further drives the demand for advanced stabilizers, which enhance the lifespan of plastic products.

Regulatory Compliance and Environmental Concerns

The Global Plastic Stabilizer Market Industry is increasingly shaped by stringent regulatory frameworks aimed at reducing environmental impact. Governments worldwide are implementing regulations that mandate the use of eco-friendly stabilizers, prompting manufacturers to adapt their formulations accordingly. This shift towards sustainable practices is not only a response to regulatory pressures but also aligns with consumer demand for environmentally responsible products. For instance, the European Union's REACH regulations have led to the development of safer stabilizers that comply with health and safety standards. Consequently, this regulatory landscape is likely to drive innovation and growth within the market.

Technological Advancements in Stabilizer Formulations

Innovations in the formulation of plastic stabilizers significantly influence the Global Plastic Stabilizer Market Industry. The development of new additives and compounds enhances the performance of plastics, making them more resistant to degradation and environmental factors. For example, advancements in UV stabilizers and antioxidants have led to improved durability and color retention in outdoor applications. These technological enhancements not only meet regulatory standards but also cater to consumer preferences for high-quality products. As a result, the market is expected to grow, with projections indicating a rise to 11.5 USD Billion by 2035, reflecting a compound annual growth rate of 5.58% from 2025 to 2035.

Consumer Awareness and Preference for Quality Products

There is a growing consumer awareness regarding the quality and safety of plastic products, which influences the Global Plastic Stabilizer Market Industry. Consumers are increasingly seeking products that not only meet functional requirements but also adhere to safety standards. This trend is prompting manufacturers to invest in high-quality stabilizers that enhance the performance and safety of their products. For instance, the demand for non-toxic and environmentally friendly stabilizers is on the rise, reflecting a shift in consumer preferences. As a result, this heightened awareness is likely to drive market growth, contributing to the projected increase in market value to 11.5 USD Billion by 2035.

Market Segment Insights

Regional Insights

Industry Developments

    • Owing to the increasing usage of hindered amine light stabilizers (HALS) for the increasing use of energy-efficient plastic mostly in the construction industry, the packaging industry is increasing at a very high pace and hence drives the market during the forecasted period.
    • Owing to the capacity of survival in extreme conditions like heat, humidity, and light the packaged products like food packaged items and bottles are increasing in the global market as it reduces the premature failure during the life of the product because of the presence of various stabilizers.
    • With the growing technology now plastic stabilizers are entering the agriculture sector as well by providing agriculture packaging services which are specifically designed for protection from extreme temperatures, chemicals, and heat, and owing to this advantage it is commonly used in mulches, tunnels, and irrigation system.
    • Owing the increasing demand in the United States for the retail market leads to growth of the packaging industry during the forecasted period.
    • Owing to the highly effective and cost-efficient, PVC flooring is trending for about 50 years and used in various private and public sectors like schools, hotels, and other commercial places as it is durable.

December 15, 2021 – Reagens and Evans Chemetics, a wholly owned subsidiary of Bruno Bock, have reached the final agreement under which Reagens USA is acquiring Evans Chemetics’ Thioester Business comprising the Evanstab® family of secondary antioxidants products.

Future Outlook

Plastic Stabilizer Market Future Outlook

The Global Plastic Stabilizer Market is projected to grow at a 5.58% CAGR from 2024 to 2035, driven by increasing demand for durable and sustainable materials.

New opportunities lie in:

  • Develop bio-based stabilizers to meet sustainability goals.
  • Invest in advanced formulations for high-performance applications.
  • Expand into emerging markets with tailored product offerings.

By 2035, the market is expected to achieve robust growth, positioning itself as a leader in innovative plastic solutions.

Market Segmentation

Report Scope

Attribute/Metric Details
  Market Size ·  2030 : USD 9231.3 million
  CAGR   4.5%(2022–2030)
  Base Year   2021
  Forecast Period   2022 to 2030
  Historical Data   2019 & 2020
  Forecast Units   Value (USD Million)
  Report Coverage   Revenue Forecast, Competitive Landscape, Growth Factors, and Trends
  Segments Covered   By Type, Application and Region
  Geographies Covered   North America, Europe, Asia-Pacific, and Rest of the World (RoW)
  Key Vendors    BASF SE (Germany),Songwon Industrial Co., Ltd. (South Korea),Clariant AG (Switzerland),Akzo Nobel N.V. (The Netherlands), Evonik Industries AG (Germany),ADEKA CORPORATION (Japan),Solvay SA (Belgium),INDOFIL INDUSTRIES LIMITED (India),Bruggemann Group (Germany),Baerlocher GmbH (Germany)
  Key Market Opportunities   Owing to the increasing demand for fire retardants specifically urethane, polyester, and PVC plastics provides various growth opportunities
  Key Market Drivers   The increasing use of heat stabilizers and the rising demand for thermal for inhabiting deterioration for plastic polymers that are heat prone.

FAQs

At what CAGR is the Plastic Stabilizer Market predicted to grow during the forecast period?

Plastic Stabilizer Market is predicted to grow at 4.5% through forecast period of 2025-2035.

What is the forecast period of Plastic Stabilizer Market research report?

The forecast period for Plastic Stabilizer Market research report is 2025-2035.

Who are the key players in the Plastic Stabilizer Market?

The prominent players operating in the Plastic Stabilizer Market include BASF SE (Germany),Songwon Industrial Co., Ltd. (South Korea),Clariant AG (Switzerland),Akzo Nobel N.V. (The Netherlands), Evonik Industries AG (Germany),ADEKA CORPORATION (Japan),Solvay SA (Belgium),INDOFIL INDUSTRIES LIMITED (India),Bruggemann Group (Germany),Baerlocher GmbH (Germany)

  1. Report Prologue
  2. Market Introduction
    1. Market Definition
    2. Scope of the Study 16
      1. Research Objectives 16
      2. Limitations 17
    3. Assumptions 16
    4. Markets Structure 17
    5. Research Methodology
    6. Research Process 18
    7. Primary Research 19
    8. Secondary Research 19
    9. Market Size Estimation 19
    10. Forecast
    11. Model 21
  3. Market Dynamics
    1. Introduction 22
    2. Drivers 24
      1. Growing demand of plastics in automotive industry to replace conventional
      2. Huge consumption of plastics in day-to-day life 25
    3. material 24
    4. Rising demand of plastics in Asia Pacific 25
    5. Restraints 26
      1. Untapped opportunities in packaging and automotive industry
    6. Stringent government regulation to phase out the lead-based stabilizer 26
    7. Opportunity 27
    8. Trends 28
      1. Key players in this market are focusing on R
      2. Changes
      3. Plastic stabilizer
      4. Distribution Channel 30
      5. End-Use Industry
    9. & D for increasing application scope for plastic stabilizer 28
    10. in global economies with new market demand 28 5 Market Factor Analysis 5.1 Supply
    11. Chain Analysis 29 5.1.1 Raw Material Suppliers 29
    12. Manufacturers 30
    1. Porter’s 5 force Analysis 30
      1. Threat of New
      2. Threat of Rivalry 31
      3. Threat of Substitute 31
      4. Bargaining Power of Supplier 31
      5. Bargaining Power of Buyer
    2. Entrants 30
  4. Global Plastic Stabilizer Market, By Type
    1. Introduction 32
    2. Heat stabilizer 34
    3. Antioxidant 36
    4. Light stabilizer 38
    5. Others 40
  5. Global Plastic Stabilizer Markets, By Material
    1. Introduction 42
    2. Thermoplastic 44
    3. Thermosetting 45
    4. Elastomers 46
  6. Global Plastic Stabilizer Markets, By End Use Industry
    1. Introduction 47
    2. Packaging 50
    3. Building & Construction
    4. Automotive 52
    5. Consumer Goods 53
    6. Electricals &
    7. Electronics 54
    8. Agriculture 55
    9. Others 56
  7. Global Plastic
  8. Stabilizer Market, By Region
    1. Introduction 57
    2. North America 59
      1. U.S 63
      2. Mexico 66
      3. Canada 69
    3. Europe
      1. Germany 76
      2. U.K 79
      3. Spain 82
      4. Italy
      5. France 88
      6. Rest of Europe 91
    4. Asia Pacific 95
      1. China 99
      2. Japan 102
      3. India 105
      4. South
    5. Korea
  9. 9.4.5 Australia & New Zealand 111
    1. East & Africa 131
    2. Argentina 141
  10. Indonesia 114
  11. Rest of Asia Pacific 117
    1. Middle East & Africa 121
      1. South Africa 125
      2. Saudi Arabia 128
      3. Rest of Middle
    2. South America 134
      1. Brazil 138
      2. Rest of South America 144
  12. Competitive Landscape
    1. Introduction 148
    2. Market Share Analysis 149
  13. Company
    1. Profiles
    2. BASF SE 150
      1. Business Overview 150
      2. Financial Update 151
    3. Product/Business Segment Overview 150
    4. Key Developments
  14. 11.2 Songwon Industrial Co., Ltd. 152
    1. Overview 152
    2. Update 153
    3. Business Overview 154
    4. Financial Update 155
    5. Product/Business Segment Overview 158
    6. Key Developments 159
  15. Business
  16. Product/Business Segment Overview 152
  17. Financial
  18. Key Developments 153
    1. Clariant AG 154
      1. Product/Business Segment Overview 154
      2. Key Developments 155
    2. Akzo Nobel N.V
      1. Business Overview 156
      2. Product/Business Segment Overview
      3. Financial Update 157
      4. Key Developments 157  
    3. Evonik Industries AG 158
      1. Business Overview 158
      2. Financial Update 159
    4. Adeka Corporation 160
      1. Business Overview
      2. Product/Business Segment Overview 160
      3. Financial Update
      4. Key Developments 161
    5. Solvay SA 162
      1. Overview
      2. Product/Business Segment Overview 162
      3. Financial Updates
  19. 11.7.4 Key Developments
  20. 11.8 Indofil Industries Limited
  21. 11.8.1 Business Overview 164
    1. Bruggemann Group 166
    2. Segment Overview 166
  22. Product/Business Segment Overview
  23. Financial Updates 164
  24. Key Developments 165
  25. Business Overview 166
  26. Product/Business
  27. Financial Updates 166
  28. Key Developments
    1. Baerlocher GmbH 167
      1. Business Overview
  29. 11.10.2
    1. Product/Business Segment Overview 167
    2. Key Developments 167
  30. Financial Updates 167
  31. Conclusion
  32. List of Tables TABLE 1 MARKET
    1. DRIVERS: IMPACT ANALYSIS
  33. TABLE 2 RESTRAINT: IMPACT ANALYSIS
  34. TABLE
  35. OPPORTUNITY: IMPACT ANALYSIS
  36. TABLE 4 TRENDS: IMPACT ANALYSIS
  37. GLOBAL PLASTIC STABILIZER MARKET, BY TYPE, (2015-2023) (USD MILLION)
  38. TABLE 6 GLOBAL PLASTIC STABILIZER MARKET, BY TYPE, (2015-2023) (KILOTONS)
  39. TABLE 7 GLOBAL HEAT STABILIZER MARKET FOR PLASTIC STABILIZER MARKET, BY REGION,
    1. (2015-2023) (USD MILLION)
  40. TABLE 8 GLOBAL HEAT STABILIZER MARKET FOR PLASTIC
  41. STABILIZER MARKET, BY REGION, (2015-2023) (KILOTONS)
  42. TABLE 9 GLOBAL ANTIOXIDANT
  43. MARKET FOR PLASTIC STABILIZER MARKET, BY REGION, (2015-2023) (USD MILLION)
  44. GLOBAL ANTIOXIDANT MARKET FOR PLASTIC STABILIZER MARKET, BY REGION, (2015-2023)
    1. (KILOTONS)
  45. TABLE 11 GLOBAL LIGHT STABILIZER MARKET FOR PLASTIC STABILIZER
  46. MARKET, BY REGION, (2015-2023) (USD MILLION)
  47. TABLE 12 GLOBAL LIGHT STABILIZER
  48. MARKET FOR PLASTIC STABILIZER MARKET, BY REGION, (2015-2023) (KILOTONS)
  49. GLOBAL OTHERS PLASTIC STABILIZER MARKET FOR PLASTIC STABILIZER MARKET,
    1. BY REGION, (2015-2023) (USD MILLION) 40 TABLE 14 GLOBAL OTHERS PLASTIC STABILIZER
  50. MARKET FOR PLASTIC STABILIZER MARKET, BY REGION, (2015-2023) (KILOTONS) 41 TABLE
  51. GLOBAL PLASTIC STABILIZER MARKET, BY MATERIAL, (2015-2023) (USD MILLION)
  52. TABLE 16 GLOBAL PLASTIC STABILIZER MARKET, BY MATERIAL, (2015-2023) (KILOTONS)
  53. TABLE 17 GLOBAL THERMOPLASTIC MARKET FOR PLASTIC STABILIZER MARKET, BY REGION,
    1. (2015-2023) (USD MILLION)
  54. TABLE 18 GLOBAL THERMOPLASTIC MARKET FOR PLASTIC
  55. STABILIZER MARKET, BY REGION, (2015-2023) (KILOTONS) 44 TABLE 19 GLOBAL THERMOSETTING
  56. MARKET FOR PLASTIC STABILIZER MARKET, BY REGION, (2015-2023) (USD MILLION)
  57. GLOBAL THERMOSETTING MARKET FOR PLASTIC STABILIZER MARKET, BY REGION, (2015-2023)
    1. (KILOTONS)
  58. TABLE 21 GLOBAL ELASTOMERS MARKET FOR PLASTIC STABILIZER MARKET,
    1. BY REGION, (2015-2023) (USD MILLION)
  59. TABLE 22 GLOBAL ELASTOMERS MARKET
  60. FOR PLASTIC STABILIZER MARKET, BY REGION, (2015-2023) (KILOTONS)
  61. TABLE
  62. GLOBAL PLASTIC STABILIZER MARKET, BY END-USE INDUSTRY, (2015-2023) (USD MILLION)
  63. TABLE 24 GLOBAL PLASTIC STABILIZER MARKET, BY END-USE INDUSTRY, (2015-2023)
    1. (KILOTONS)
  64. TABLE 25 GLOBAL PACKAGING MARKET FOR PLASTIC STABILIZER MARKET,
    1. BY REGION, (2015-2023) (USD MILLION)
  65. TABLE
  66. GLOBAL PACKAGING MARKET
  67. FOR PLASTIC STABILIZER MARKET, BY REGION, (2015-2023) (KILOTONS)
  68. TABLE
  69. GLOBAL BUILDING & CONSTRUCTION MARKET FOR PLASTIC STABILIZER MARKET, BY REGION,
    1. (2015-2023) (USD MILLION) 51   TABLE
  70. GLOBAL BUILDING & CONSTRUCTION
  71. MARKET FOR PLASTIC STABILIZER MARKET, BY REGION, (2015-2023) (KILOTONS)
    1. TABLE
  72. GLOBAL AUTOMOTIVE MARKET FOR PLASTIC STABILIZER MARKET, BY REGION,
    1. (2015-2023) (USD MILLION)
  73. TABLE
  74. GLOBAL AUTOMOTIVE MARKET FOR PLASTIC
  75. STABILIZER MARKET, BY REGION, (2015-2023) (KILOTONS)
  76. TABLE 31 GLOBAL CONSUMER
  77. GOODS MARKET FOR PLASTIC STABILIZER MARKET, BY REGION, (2015-2023) (USD MILLION)
  78. TABLE 32 GLOBAL CONSUMER GOODS MARKET FOR PLASTIC STABILIZER MARKET, BY
    1. REGION, (2015-2023) (KILOTONS)
  79. GLOBAL ELECTRICALS & ELECTRONICS MARKET
  80. FOR PLASTIC STABILIZER MARKET, BY REGION, (2015-2023) (USD MILLION)
  81. TABLE
  82. GLOBAL ELECTRICALS & ELECTRONICS MARKET FOR PLASTIC STABILIZER MARKET, BY
    1. REGION, (2015-2023) (KILOTONS)
  83. TABLE 35 GLOBAL AGRICULTURE MARKET FOR PLASTIC
  84. STABILIZER MARKET, BY REGION, (2015-2023) (USD MILLION) 55 TABLE 36 GLOBAL AGRICULTURE
  85. MARKET FOR PLASTIC STABILIZER MARKET, BY REGION, (2015-2023) (KILOTONS) 55 TABLE
  86. GLOBAL OTHERS MARKET FOR PLASTIC STABILIZER MARKET, BY REGION, (2015-2023) (USD
  87. MILLION) 56 TABLE 38 GLOBAL OTHERS MARKET FOR PLASTIC STABILIZER MARKET, BY REGION,
  88. (2015-2023) (KILOTONS) 56 TABLE 39 GLOBAL PLASTIC STABILIZER MARKET, BY REGION,
  89. (2015-2023) (USD MILLION) 58 TABLE 40 GLOBAL PLASTIC STABILIZER MARKET, BY REGION,
  90. (2015-2023) (KILOTONS) 58 TABLE 41 NORTH AMERICA PLASTIC STABILIZER MARKET, BY REGION,
    1. (2015-2023) (USD MILLION)
  91. TABLE 42 NORTH AMERICA PLASTIC STABILIZER MARKET,
    1. BY REGION, (2015-2023) (KILOTONS)
  92. TABLE 43 NORTH AMERICA PLASTIC STABILIZER
  93. MARKET, BY TYPE, (2015-2023) (USD MILLION)
  94. TABLE 44 NORTH AMERICA PLASTIC
  95. STABILIZER MARKET, BY TYPE, (2015-2023) (KILOTONS)
  96. TABLE 45 NORTH AMERICA
  97. PLASTIC STABILIZER MARKET, BY MATERIAL, (2015-2023) (USD MILLION)
  98. TABLE
  99. NORTH AMERICA PLASTIC STABILIZER MARKET, BY MATERIAL, (2015-2023) (KILOTONS)
  100. TABLE 47 NORTH AMERICA PLASTIC STABILIZER MARKET, BY END-USE INDUSTRY,
    1. (2015-2023) (USD MILLION)
  101. TABLE 48 NORTH AMERICA PLASTIC STABILIZER MARKET,
    1. BY END-USE INDUSTRY, (2015-2023) (KILOTONS)
  102. TABLE 49 U.S PLASTIC STABILIZER
  103. MARKET, BY TYPE, (2015-2023) (USD MILLION)
  104. TABLE 50 U.S PLASTIC STABILIZER
  105. MARKET, BY TYPE, (2015-2023) (KILOTONS)
  106. TABLE 51 U.S PLASTIC STABILIZER
  107. MARKET, BY MATERIAL, (2015-2023) (USD MILLION) 64 TABLE 52 U.S PLASTIC STABILIZER
  108. MARKET, BY MATERIAL, (2015-2023) (KILOTONS) 64 TABLE 53 U.S PLASTIC STABILIZER MARKET,
    1. BY END-USE INDUSTRY, (2015-2023) (USD MILLION) 65 TABLE 54 U.S PLASTIC STABILIZER
  109. MARKET, BY END-USE INDUSTRY, (2015-2023) (KILOTONS) 65 TABLE 55 MEXICO PLASTIC STABILIZER
  110. MARKET, BY TYPE, (2015-2023) (USD MILLION)
  111. TABLE 56 MEXICO PLASTIC STABILIZER
  112. MARKET, BY TYPE, (2015-2023) (KILOTONS)
  113. TABLE 57 MEXICO PLASTIC STABILIZER
  114. MARKET, BY MATERIAL, (2015-2023) (USD MILLION)
  115. TABLE 58 MEXICO PLASTIC
  116. STABILIZER MARKET, BY MATERIAL, (2015-2023) (KILOTONS)
  117. TABLE 59 MEXICO
  118. PLASTIC STABILIZER MARKET, BY END-USE INDUSTRY, (2015-2023) (USD MILLION)
  119. MEXICO PLASTIC STABILIZER MARKET, BY END-USE INDUSTRY, (2015-2023) (KILOTONS)
  120. TABLE 61 CANADA PLASTIC STABILIZER MARKET, BY TYPE, (2015-2023) (USD MILLION)
  121.   TABLE 62 CANADA PLASTIC STABILIZER MARKET, BY TYPE, (2015-2023)
    1. (KILOTONS)
  122. TABLE 63 CANADA PLASTIC STABILIZER MARKET, BY MATERIAL, (2015-2023)
    1. (USD MILLION)
  123. TABLE 64 CANADA PLASTIC STABILIZER MARKET, BY MATERIAL, (2015-2023)
    1. (KILOTONS)
  124. TABLE 65 CANADA PLASTIC STABILIZER MARKET, BY END-USE INDUSTRY,
    1. (2015-2023) (USD MILLION)
  125. TABLE 66 CANADA PLASTIC STABILIZER MARKET, BY
    1. END-USE INDUSTRY, (2015-2023) (KILOTONS)
  126. TABLE
  127. EUROPE PLASTIC
  128. STABILIZER MARKET, BY REGION, (2015-2023) (USD MILLION)
  129. TABLE 68 EUROPE
  130. PLASTIC STABILIZER MARKET, BY REGION, (2015-2023) (KILOTONS)
  131. TABLE 69 EUROPE
  132. PLASTIC STABILIZER MARKET, BY TYPE, (2015-2023) (USD MILLION)
  133. TABLE 70
  134. EUROPE PLASTIC STABILIZER MARKET, BY TYPE, (2015-2023) (KILOTONS)
  135. TABLE
  136. EUROPE PLASTIC STABILIZER MARKET, BY MATERIAL, (2015-2023) (USD MILLION)
  137. TABLE 72 EUROPE PLASTIC STABILIZER MARKET, BY MATERIAL, (2015-2023) (KILOTONS)
  138. TABLE 73 EUROPE PLASTIC STABILIZER MARKET, BY END-USE INDUSTRY, (2015-2023)
    1. (USD MILLION)
  139. TABLE 74 EUROPE PLASTIC STABILIZER MARKET, BY END-USE INDUSTRY,
  140. (2015-2023) (KILOTONS) 76 TABLE 75 GERMANY PLASTIC STABILIZER MARKET, BY TYPE, (2015-2023)
    1. (USD MILLION)
  141. TABLE 76 GERMANY PLASTIC STABILIZER MARKET, BY TYPE, (2015-2023)
    1. (KILOTONS)
  142. TABLE 77 GERMANY PLASTIC STABILIZER MARKET, BY MATERIAL, (2015-2023)
    1. (USD MILLION)
  143. TABLE 78 GERMANY PLASTIC STABILIZER MARKET, BY MATERIAL,
    1. (2015-2023) (KILOTONS) 78 TABLE
  144. GERMANY PLASTIC STABILIZER MARKET, BY END-USE
    1. INDUSTRY, (2015-2023) (USD MILLION)
  145. TABLE 80 GERMANY PLASTIC STABILIZER
  146. MARKET, BY END-USE INDUSTRY, (2015-2023) (KILOTONS)
  147. TABLE 81 U.K PLASTIC
  148. STABILIZER MARKET, BY TYPE, (2015-2023) (USD MILLION)
  149. TABLE 82 U.K PLASTIC
  150. STABILIZER MARKET, BY TYPE, (2015-2023) (KILOTONS) 80 TABLE 83 U.K PLASTIC STABILIZER
  151. MARKET, BY MATERIAL, (2015-2023) (USD MILLION)
  152. TABLE 84 U.K PLASTIC STABILIZER
  153. MARKET, BY MATERIAL, (2015-2023) (KILOTONS)
  154. TABLE 85 U.K PLASTIC STABILIZER
  155. MARKET, BY END-USE INDUSTRY, (2015-2023) (USD MILLION) 81 TABLE 86 U.K PLASTIC STABILIZER
  156. MARKET, BY END-USE INDUSTRY, (2015-2023) (KILOTONS)
  157. TABLE 87 SPAIN PLASTIC
  158. STABILIZER MARKET, BY TYPE, (2015-2023) (USD MILLION)
  159. TABLE 88 SPAIN PLASTIC
  160. STABILIZER MARKET, BY TYPE, (2015-2023) (KILOTONS)
  161. TABLE 89 SPAIN PLASTIC
  162. STABILIZER MARKET, BY MATERIAL, (2015-2023) (USD MILLION)
  163. TABLE 90 SPAIN
  164. PLASTIC STABILIZER MARKET, BY MATERIAL, (2015-2023) (KILOTONS)
  165. TABLE 91
  166. SPAIN PLASTIC STABILIZER MARKET, BY END-USE INDUSTRY, (2015-2023) (USD MILLION)
  167. TABLE 92 SPAIN PLASTIC STABILIZER MARKET, BY END-USE INDUSTRY, (2015-2023)
    1. (KILOTONS)
  168. TABLE 93 ITALY PLASTIC STABILIZER MARKET, BY TYPE, (2015-2023)
    1. (USD MILLION)
  169. TABLE 94 ITALY PLASTIC STABILIZER MARKET, BY TYPE, (2015-2023)
    1. (KILOTONS)
  170. TABLE 95 ITALY PLASTIC STABILIZER MARKET, BY MATERIAL, (2015-2023)
    1. (USD MILLION)
  171. TABLE 96 ITALY PLASTIC STABILIZER MARKET, BY MATERIAL, (2015-2023)
    1. (KILOTONS)
  172. TABLE 97 ITALY PLASTIC STABILIZER MARKET, BY END-USE INDUSTRY,
    1. (2015-2023) (USD MILLION)
  173. TABLE 98 ITALY PLASTIC STABILIZER MARKET, BY
    1. END-USE INDUSTRY, (2015-2023) (KILOTONS)
  174. TABLE 99 FRANCE PLASTIC STABILIZER
  175. MARKET, BY TYPE, (2015-2023) (USD MILLION)
  176. TABLE 100 FRANCE PLASTIC STABILIZER
  177. MARKET, BY TYPE, (2015-2023) (KILOTONS)
  178. TABLE 101 FRANCE PLASTIC STABILIZER
  179. MARKET, BY MATERIAL, (2015-2023) (USD MILLION)
  180. TABLE 102 FRANCE PLASTIC
  181. STABILIZER MARKET, BY MATERIAL, (2015-2023) (KILOTONS)
  182. TABLE 103 FRANCE
  183. PLASTIC STABILIZER MARKET, BY END-USE INDUSTRY, (2015-2023) (USD MILLION)
  184. FRANCE PLASTIC STABILIZER MARKET, BY END-USE INDUSTRY, (2015-2023) (KILOTONS)
  185. TABLE 105 REST OF EUROPE PLASTIC STABILIZER MARKET, BY TYPE, (2015-2023)
    1. (USD MILLION)
  186. TABLE 106 REST OF EUROPE PLASTIC STABILIZER MARKET, BY TYPE,
    1. (2015-2023) (KILOTONS)
  187. TABLE 107 REST OF EUROPE PLASTIC STABILIZER MARKET,
    1. BY MATERIAL, (2015-2023) (USD MILLION)
  188. TABLE 108 REST OF EUROPE PLASTIC
  189. STABILIZER MARKET, BY MATERIAL, (2015-2023) (KILOTONS)
  190. TABLE 109 REST OF
  191. EUROPE PLASTIC STABILIZER MARKET, BY END-USE INDUSTRY, (2015-2023) (USD MILLION)
  192. TABLE 110 REST OF EUROPE PLASTIC STABILIZER MARKET, BY END-USE INDUSTRY,
    1. (2015-2023) (KILOTONS)
  193. TABLE 111 ASIA PACIFIC PLASTIC STABILIZER MARKET,
    1. BY REGION, (2015-2023) (USD MILLION)
  194. TABLE 112 ASIA PACIFIC PLASTIC STABILIZER
  195. MARKET, BY REGION, (2015-2023) (KILOTONS)
  196. TABLE 113 ASIA PACIFIC PLASTIC
  197. STABILIZER MARKET, BY TYPE, (2015-2023) (USD MILLION)
  198. TABLE 114 ASIA PACIFIC
  199. PLASTIC STABILIZER MARKET, BY TYPE, (2015-2023) (KILOTONS)
  200. TABLE 115 ASIA
  201. PACIFIC PLASTIC STABILIZER MARKET, BY MATERIAL, (2015-2023) (USD MILLION)
  202. ASIA PACIFIC PLASTIC STABILIZER MARKET, BY MATERIAL, (2015-2023) (KILOTONS)
  203. TABLE 117 ASIA PACIFIC PLASTIC STABILIZER MARKET, BY END-USE INDUSTRY,
    1. (2015-2023) (USD MILLION)
  204. TABLE 118 ASIA PACIFIC PLASTIC STABILIZER MARKET,
    1. BY END-USE INDUSTRY, (2015-2023) (KILOTONS)
  205. TABLE 119 CHINA PLASTIC STABILIZER
  206. MARKET, BY TYPE, (2015-2023) (USD MILLION)
  207. TABLE 120 CHINA PLASTIC STABILIZER
  208. MARKET, BY TYPE, (2015-2023) (KILOTONS)
  209. TABLE 121 CHINA PLASTIC STABILIZER
  210. MARKET, BY MATERIAL, (2015-2023) (USD MILLION)
  211. TABLE 122 CHINA PLASTIC
  212. STABILIZER MARKET, BY MATERIAL, (2015-2023) (KILOTONS)
  213. TABLE 123 CHINA
  214. PLASTIC STABILIZER MARKET, BY END-USE INDUSTRY, (2015-2023) (USD MILLION)
  215. CHINA PLASTIC STABILIZER MARKET, BY END-USE INDUSTRY, (2015-2023) (KILOTONS)
  216. TABLE 125 JAPAN PLASTIC STABILIZER MARKET, BY TYPE, (2015-2023) (USD MILLION)
  217. TABLE 126 JAPAN PLASTIC STABILIZER MARKET, BY TYPE, (2015-2023) (KILOTONS)
  218. TABLE 127 JAPAN PLASTIC STABILIZER MARKET, BY MATERIAL, (2015-2023) (USD
    1. MILLION)
  219. TABLE 128 JAPAN PLASTIC STABILIZER MARKET, BY MATERIAL, (2015-2023)
    1. (KILOTONS)
  220. TABLE 129 JAPAN PLASTIC STABILIZER MARKET, BY END-USE INDUSTRY,
    1. (2015-2023) (USD MILLION)
  221. TABLE 130 JAPAN PLASTIC STABILIZER MARKET, BY
    1. END-USE INDUSTRY, (2015-2023) (KILOTONS)
  222. TABLE 131 INDIA PLASTIC STABILIZER
  223. MARKET, BY TYPE, (2015-2023) (USD MILLION)
  224. TABLE 132 INDIA PLASTIC STABILIZER
  225. MARKET, BY TYPE, (2015-2023) (KILOTONS)
  226. TABLE 133 INDIA PLASTIC STABILIZER
  227. MARKET, BY MATERIAL, (2015-2023) (USD MILLION)
  228. TABLE 134 INDIA PLASTIC
  229. STABILIZER MARKET, BY MATERIAL, (2015-2023) (KILOTONS)
  230. TABLE 135 INDIA
  231. PLASTIC STABILIZER MARKET, BY END-USE INDUSTRY, (2015-2023) (USD MILLION)
  232. INDIA PLASTIC STABILIZER MARKET, BY END-USE INDUSTRY, (2015-2023) (KILOTONS)
  233. TABLE 137 SOUTH KOREA PLASTIC STABILIZER MARKET, BY TYPE, (2015-2023)
    1. (USD MILLION)
  234. TABLE 138 SOUTH KOREA PLASTIC STABILIZER MARKET, BY TYPE,
    1. (2015-2023) (KILOTONS)
  235. TABLE 139 SOUTH KOREA PLASTIC STABILIZER MARKET,
    1. BY MATERIAL, (2015-2023) (USD MILLION)
  236.   TABLE 140 SOUTH KOREA PLASTIC
  237. STABILIZER MARKET, BY MATERIAL, (2015-2023) (KILOTONS)
  238. TABLE 141 SOUTH
  239. KOREA PLASTIC STABILIZER MARKET, BY END-USE INDUSTRY, (2015-2023) (USD MILLION)
  240. TABLE 142 SOUTH KOREA PLASTIC STABILIZER MARKET, BY END-USE INDUSTRY,
    1. (2015-2023) (KILOTONS)
  241. TABLE 143 AUSTRALIA & NEW ZEALAND PLASTIC STABILIZER
  242. MARKET, BY TYPE, (2015-2023) (USD MILLION)
  243. TABLE 144 AUSTRALIA & NEW
  244. ZEALAND PLASTIC STABILIZER MARKET, BY TYPE, (2015-2023) (KILOTONS)
  245. TABLE
  246. AUSTRALIA & NEW ZEALAND PLASTIC STABILIZER MARKET, BY MATERIAL, (2015-2023)
    1. (USD MILLION)
  247. TABLE 146 AUSTRALIA & NEW ZEALAND PLASTIC STABILIZER
  248. MARKET, BY MATERIAL, (2015-2023) (KILOTONS)
  249. TABLE 147 AUSTRALIA &
  250. NEW ZEALAND PLASTIC STABILIZER MARKET, BY END-USE INDUSTRY, (2015-2023) (USD MILLION)
  251. TABLE 148 AUSTRALIA & NEW ZEALAND PLASTIC STABILIZER MARKET, BY END-USE
    1. INDUSTRY, (2015-2023) (KILOTONS)
  252. TABLE 149 INDONESIA PLASTIC STABILIZER
  253. MARKET, BY TYPE, (2015-2023) (USD MILLION)
  254. TABLE 150 INDONESIA PLASTIC
  255. STABILIZER MARKET, BY TYPE, (2015-2023) (KILOTONS)
  256. TABLE 151 INDONESIA
  257. PLASTIC STABILIZER MARKET, BY MATERIAL, (2015-2023) (USD MILLION)
  258. TABLE
  259. INDONESIA PLASTIC STABILIZER MARKET, BY MATERIAL, (2015-2023) (KILOTONS)
  260. TABLE 153 INDONESIA PLASTIC STABILIZER MARKET, BY END-USE INDUSTRY, (2015-2023)
    1. (USD MILLION)
  261. TABLE 154 INDONESIA PLASTIC STABILIZER MARKET, BY END-USE
    1. INDUSTRY, (2015-2023) (KILOTONS)
  262. TABLE 155 REST OF ASIA PACIFIC PLASTIC
  263. STABILIZER MARKET, BY TYPE, (2015-2023) (USD MILLION)
  264. TABLE 156 REST OF
  265. ASIA PACIFIC PLASTIC STABILIZER MARKET, BY TYPE, (2015-2023) (KILOTONS)
  266. REST OF ASIA PACIFIC PLASTIC STABILIZER MARKET, BY MATERIAL, (2015-2023)
    1. (USD MILLION)
  267. TABLE 158 REST OF ASIA PACIFIC PLASTIC STABILIZER MARKET,
    1. BY MATERIAL, (2015-2023) (KILOTONS)
  268. TABLE 159 REST OF ASIA PACIFIC PLASTIC
  269. STABILIZER MARKET, BY END-USE INDUSTRY, (2015-2023) (USD MILLION)
  270. TABLE
  271. REST OF ASIA PACIFIC PLASTIC STABILIZER MARKET, BY END-USE INDUSTRY, (2015-2023)
    1. (KILOTONS)
  272. TABLE 161 MIDDLE EAST & AFRICA PLASTIC STABILIZER MARKET,
    1. BY REGION, (2015-2023) (USD MILLION) 121 TABLE
  273. MIDDLE EAST & AFRICA
  274. PLASTIC STABILIZER MARKET, BY REGION, (2015-2023) (KILOTONS) 121 TABLE
  275. MIDDLE EAST & AFRICA PLASTIC STABILIZER MARKET, BY TYPE, (2015-2023) (USD MILLION)
  276. TABLE
  277. MIDDLE EAST & AFRICA PLASTIC STABILIZER MARKET, BY TYPE,
    1. (2015-2023) (KILOTONS) 122 TABLE
  278. MIDDLE EAST & AFRICA PLASTIC STABILIZER
  279. MARKET, BY MATERIAL, (2015-2023) (USD MILLION) 123 TABLE
  280. MIDDLE EAST &
  281. AFRICA PLASTIC STABILIZER MARKET, BY MATERIAL, (2015-2023) (KILOTONS) 123 TABLE
  282. MIDDLE EAST & AFRICA PLASTIC STABILIZER MARKET, BY END-USE INDUSTRY,
    1. (2015-2023) (USD MILLION) 124 TABLE
  283. MIDDLE EAST & AFRICA PLASTIC STABILIZER
  284. MARKET, BY END-USE INDUSTRY, (2015-2023) (KILOTONS) 124 TABLE
  285. SOUTH AFRICA
  286. PLASTIC STABILIZER MARKET, BY TYPE, (2015-2023) (USD MILLION) 125 TABLE
  287. SOUTH AFRICA PLASTIC STABILIZER MARKET, BY TYPE, (2015-2023) (KILOTONS) 125 TABLE
  288. SOUTH AFRICA PLASTIC STABILIZER MARKET, BY MATERIAL, (2015-2023) (USD
    1. MILLION) 126 TABLE
  289. SOUTH AFRICA PLASTIC STABILIZER MARKET, BY MATERIAL,
    1. (2015-2023) (KILOTONS) 126 TABLE
  290. SOUTH AFRICA PLASTIC STABILIZER MARKET,
    1. BY END-USE INDUSTRY, (2015-2023) (USD MILLION) 127 TABLE
  291. SOUTH AFRICA
  292. PLASTIC STABILIZER MARKET, BY END-USE INDUSTRY, (2015-2023) (KILOTONS) 127 TABLE
  293. SAUDI ARABIA PLASTIC STABILIZER MARKET, BY TYPE, (2015-2023) (USD MILLION)
  294. TABLE
  295. SAUDI ARABIAPLASTIC STABILIZER MARKET, BY TYPE, (2015-2023) (KILOTONS)
  296. TABLE
  297. SAUDI ARABIA PLASTIC STABILIZER MARKET, BY MATERIAL, (2015-2023)
    1. (USD MILLION) 129   TABLE
  298. SAUDI ARABIA PLASTIC STABILIZER MARKET,
    1. BY MATERIAL, (2015-2023) (KILOTONS) 129 TABLE
  299. SAUDI ARABIA PLASTIC STABILIZER
  300. MARKET, BY END-USE INDUSTRY, (2015-2023) (USD MILLION) 130 TABLE
  301. SAUDI
  302. ARABIA PLASTIC STABILIZER MARKET, BY END-USE INDUSTRY, (2015-2023) (KILOTONS) 130
  303. REST OF MIDDLE EAST & AFRICA PLASTIC STABILIZER MARKET, BY TYPE, (2015-2023)
    1. (USD MILLION) 131 TABLE
  304. REST OF MIDDLE EAST & AFRICA PLASTIC STABILIZER
  305. MARKET, BY TYPE, (2015-2023) (KILOTONS) 131 TABLE
  306. REST OF MIDDLE EAST
  307. & AFRICA PLASTIC STABILIZER MARKET, BY MATERIAL, (2015-2023) (USD MILLION) 132
    1. TABLE
  308. REST OF MIDDLE EAST & AFRICA PLASTIC STABILIZER MARKET, BY MATERIAL,
    1. (2015-2023) (KILOTONS) 132 TABLE
  309. REST OF MIDDLE EAST & AFRICA PLASTIC
  310. STABILIZER MARKET, BY END-USE INDUSTRY, (2015-2023) (USD MILLION) 133 TABLE
  311. REST OF MIDDLE EAST & AFRICA PLASTIC STABILIZER MARKET, BY END-USE INDUSTRY,
    1. (2015-2023) (KILOTONS) 133 TABLE
  312. SOUTH AMERICA PLASTIC STABILIZER MARKET,
    1. BY REGION, (2015-2023) (USD MILLION) 134 TABLE 188 SOUTH AMERICA PLASTIC STABILIZER
  313. MARKET, BY REGION, (2015-2023) (KILOTONS) 134 TABLE
  314. SOUTH AMERICA PLASTIC
  315. STABILIZER MARKET, BY TYPE, (2015-2023) (USD MILLION) 135 TABLE
  316. SOUTH
  317. AMERICA PLASTIC STABILIZER MARKET, BY TYPE, (2015-2023) (KILOTONS) 135 TABLE
  318. SOUTH AMERICA PLASTIC STABILIZER MARKET, BY MATERIAL, (2015-2023) (USD MILLION)
  319. TABLE
  320. SOUTH AMERICA PLASTIC STABILIZER MARKET, BY MATERIAL, (2015-2023)
    1. (KILOTONS) 136 TABLE
  321. SOUTH AMERICA PLASTIC STABILIZER MARKET, BY END-USE
    1. INDUSTRY, (2015-2023) (USD MILLION) 137 TABLE
  322. SOUTH AMERICA PLASTIC STABILIZER
  323. MARKET, BY END-USE INDUSTRY, (2015-2023) (KILOTONS) 137 TABLE
  324. BRAZIL PLASTIC
  325. STABILIZER MARKET, BY TYPE, (2015-2023) (USD MILLION) 138 TABLE
  326. BRAZIL
  327. PLASTIC STABILIZER MARKET, BY TYPE, (2015-2023) (KILOTONS) 138 TABLE
  328. BRAZIL
  329. PLASTIC STABILIZER MARKET, BY MATERIAL, (2015-2023) (USD MILLION) 139 TABLE
  330. BRAZIL PLASTIC STABILIZER MARKET, BY MATERIAL, (2015-2023) (KILOTONS) 139
    1. TABLE
  331. BRAZIL PLASTIC STABILIZER MARKET, BY END-USE INDUSTRY, (2015-2023)
    1. (USD MILLION)
  332. TABLE 200 BRAZIL PLASTIC STABILIZER MARKET, BY END-USE INDUSTRY,
    1. (2015-2023) (KILOTONS)
  333. TABLE 201 ARGENTINA PLASTIC STABILIZER MARKET,
    1. BY TYPE, (2015-2023) (USD MILLION) 141 TABLE 202 ARGENTINA PLASTIC STABILIZER MARKET,
    2. BY TYPE, (2015-2023) (KILOTONS)
  334. TABLE 203 ARGENTINA PLASTIC STABILIZER
  335. MARKET, BY MATERIAL, (2015-2023) (USD MILLION)
  336. TABLE 204 ARGENTINA PLASTIC
  337. STABILIZER MARKET, BY MATERIAL, (2015-2023) (KILOTONS)
  338. TABLE 205 ARGENTINA
  339. PLASTIC STABILIZER MARKET, BY END-USE INDUSTRY, (2015-2023) (USD MILLION)
  340. ARGENTINA PLASTIC STABILIZER MARKET, BY END-USE INDUSTRY, (2015-2023)
    1. (KILOTONS)
  341. TABLE 207 REST OF SOUTH AMERICA PLASTIC STABILIZER MARKET,
    1. BY TYPE, (2015-2023) (USD MILLION)
  342. TABLE 208 REST OF SOUTH AMERICA PLASTIC
  343. STABILIZER MARKET, BY TYPE, (2015-2023) (KILOTONS)
  344. TABLE 209 REST OF SOUTH
  345. AMERICA PLASTIC STABILIZER MARKET, BY MATERIAL, (2015-2023) (USD MILLION)
  346. REST OF SOUTH AMERICA PLASTIC STABILIZER MARKET, BY MATERIAL, (2015-2023)
    1. (KILOTONS)
  347. TABLE 211 REST OF SOUTH AMERICA PLASTIC STABILIZER MARKET,
    1. BY END-USE INDUSTRY, (2015-2023) (USD MILLION)
  348. TABLE 212 REST OF SOUTH
  349. AMERICA PLASTIC STABILIZER MARKET, BY END-USE INDUSTRY, (2015-2023) (KILOTONS)
  350. TABLE 213 BASF SE: SEGMENT OVERVIEW
  351. TABLE 214 SONGWON INDUSTRIAL
    1. CO., LTD.: SEGMENT OVERVIEW
  352.   TABLE 215 CLARIANT AG: SEGMENT OVERVIEW
  353. TABLE 216 AKZO NOBEL NV, LTD: SEGMENT OVERVIEW
  354. TABLE 217 EVONIK
    1. INDUSTRIES AG: SEGMENT OVERVIEW
  355. TABLE 218 ADEKA CORPORATION: SEGMENT OVERVIEW
  356. TABLE 219 SOLVAY SA: SEGMENT OVERVIEW
  357. TABLE 220 INDOFIL INDUSTRIES
    1. LIMITED: SEGMENT OVERVIEW
  358. TABLE 221 BRUGGEMANN GROUP: SEGMENT OVERVIEW
  359. TABLE 222 BAERLOCHER GMBH: SEGMENT OVERVIEW
  360.   14 List of
    1. Figures FIGURE 1 TOP DOWN & BOTTOM UP APPROACH
  361. FIGURE 2 FORECAST MODEL
  362. FIGURE 3 DRIVERS, RESTRAINTS, OPPORTUNITIES, AND TRENDS OF GLOBAL PLASTIC
  363. STABILIZER MARKET
  364. FIGURE 4 SUPPLY CHAIN DIAGRAM
  365. FIGURE 5 GLOBAL
  366. PLASTIC STABILIZER MARKET SHARE, BY TYPE, 2016-2023 (USD MILLION)
  367. FIGURE
  368. GLOBAL PLASTIC STABILIZER MARKET VOLUME, BY TYPE, 2016-2023 (KILOTONS)
  369. GLOBAL PLASTIC STABILIZER MARKET, BY MATERIAL, 2016-2023 (USD MILLION)
  370. FIGURE 8 GLOBAL PLASTIC STABILIZER MARKET, BY END-USE INDUSTRY, 2016-2023
    1. (KILOTONS)
  371. FIGURE 9 GLOBAL PLASTIC STABILIZER MARKET, BY END-USE INDUSTRY,
  372. FIGURE 10 GLOBAL PLASTIC STABILIZER MARKET, BY
    1. END-USE INDUSTRY, 2016-2023 (KILOTONS)
  373. FIGURE 11 GLOBAL PLASTIC STABILIZER
  374. MARKET SHARE, BY REGION, 2016 (%)
  375. FIGURE 12 BASF SE:RECENT FINANCIALS
  376. FIGURE 13 SONGWON INDUSTRIAL CO., LTD.: RECENT FINANCIALS
  377. FIGURE
  378. CLARIANT AG: FINANCIAL UPDATES
  379. FIGURE 15 AKZO NOBEL NV, LTD: FINANCIAL
    1. UPDATES
  380. FIGURE 16 EVONIK INDUSTRIES AG: RECENT FINANCIALS
  381. FIGURE
  382. ADEKA CORPORATION: FINANCIAL UPDATES
  383. FIGURE 18 GLOBAL PLASTIC STABILIZER
    1. MARKET SHARE AND CAGR % (2017-2023)

Plastic Stabilizer Market Segmentation

Market Segmentation Overview

  • Detailed segmentation data will be available in the full report
  • Comprehensive analysis by multiple parameters
  • Regional and country-level breakdowns
  • Market size forecasts by segment
Infographic

Free Sample Request

Kindly complete the form below to receive a free sample of this Report

Get Free Sample

Customer Strories

“I am very pleased with how market segments have been defined in a relevant way for my purposes (such as "Portable Freezers & refrigerators" and "last-mile"). In general the report is well structured. Thanks very much for your efforts.”

Victoria Milne

Founder

Compare Licence

×
Features License Type
Single User Multiuser License Enterprise User
Price $4,950 $5,950 $7,250
Maximum User Access Limit 1 User Upto 10 Users Unrestricted Access Throughout the Organization
Free Customization
Direct Access to Analyst
Deliverable Format
Platform Access
Discount on Next Purchase 10% 15% 15%
Printable Versions