Premium Cosmetics Market (2026 - 2035)

Premium Cosmetics Market Size, Share, Industry Trend & Analysis Analysis & Size, Share Research Report Information By Product Type (Facial Cosmetics, Eye Cosmetics, Lip and Nail Make-Up Cosmetics), By Category (Natural / Organic, Conventional / Synthetic), By Distribution Channel (Single Brand Stores, Multi-Brand Stores, Online Retail Stores, Other Distribution Channels), By Geography (North America, Europe, Asia-Pacific, South America, Middle East & Africa) – Forecast Till 2035
ID: MRFR/CG/3024-HCR
110 Pages
Snehal Singh
Last Updated: July 22, 2026
Premium Cosmetics Market
Market Size
Forecast Period2026-2035
CAGR (2026-2035)5.74%
2025 Market SizeUSD 33.40 Billion
2035 Market SizeUSD 58.36 Billion
Key Players
L'Oréal Luxe
The Estée Lauder Companies
LVMH
Chanel
Coty Inc.
Puig
Opportunities
  • Precision-Fermentation Ingredients
  • Men's Premium Grooming Expansion
  • Emerging-Market Premiumization

Premium Cosmetics Market Summary

The Premium Cosmetics Market reached a valuation of USD 33.40 billion in 2025 and is projected to grow from USD 35.32 billion in 2026 to USD 58.36 billion by 2035, advancing at a CAGR of 5.74% during the forecast period. Rising disposable incomes in emerging economies and the global shift toward dermatologically validated beauty routines are fueling sustained demand. The EU's tightening of the Cosmetic Products Regulation and the FDA's Modernization of Cosmetics Regulation Act (MoCRA) have accelerated R&D spending toward compliant, science-backed ingredients. This trend directly benefits premium-tier brands equipped to absorb reformulation costs [1].

Prestige brands are changing the way they manufacture products with biotechnology. Precision-fermentation actives, AI-driven peptide discovery, and lab-grown skin models are supplanting legacy trial-and-error testing, reducing development timelines from 18 months to under 10 in some categories. In 2024, L’Oréal invested EUR 1.2 billion in R&D, a large part of which was focused on the development of biotech-derived chemicals [2]. These investments are raising the technical bar in the Premium Cosmetics Market, and it will be harder for smaller names to compete without the backing of partnerships or acquisitions.

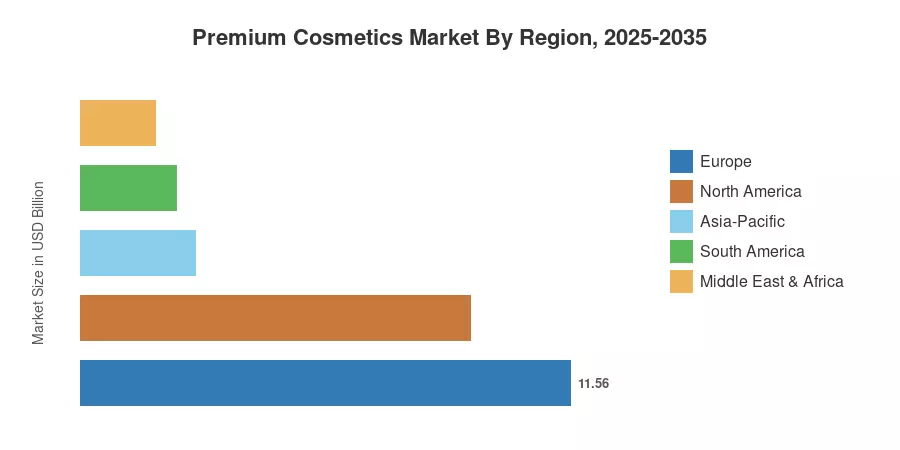
Europe accounts for around 34.6% of the Premium Cosmetics Market, with France, Italy and Germany’s historic companies taking the lead. The Asia Pacific region is growing the quickest, at a CAGR of 8.14%, led by K-beauty clinical innovation and a growing middle class in China. North America is the second highest share at 27.5% and is fueled by DTC web shopping and dermatologist-endorsed product lines. The Premium Cosmetics Market is poised to grow at a significant rate with respect to personalization technology and social-commerce channels throughout the forecast period of 2023 to 2035.


Key Report Takeaways

• By Product Type

  • Facial cosmetics captured 44.8% of the Premium Cosmetics Market share in 2025, reflecting consumer prioritization of complexion care.
  • Eye cosmetics are expanding at the fastest pace through 2035, driven by social-media-influenced looks and long-wear technology.

• By Category

  • Natural and organic products represented 61.5% of the Premium Cosmetics Market in 2025, underscoring the clean-beauty movement's dominance.
  • Conventional formulations retain a loyal base among performance-focused consumers seeking clinical efficacy.

• By Distribution Channel

  • Multi-brand retailers accounted for 48.2% of 2025 revenue, benefiting from curated discovery experiences.
  • Online retail is forecast to register a 7.30% CAGR between 2026 and 2035, outpacing every brick-and-mortar channel.

• By Region

  • Europe contributed 34.6% of global Premium Cosmetics Market revenue in 2025.
  • Asia-Pacific is projected to post the highest regional CAGR at 8.14% through 2035.


Market Size and Forecast (2021–2035)

Market Research Future's estimates draw on a proprietary bottom-up model combining trade data, company financials, import-export flows, and primary interviews with brand executives and channel partners. Historical figures (2021–2024) reflect audited industry data, while the forecast (2026–2035) applies demand-side regression calibrated to macroeconomic indicators and consumer spending surveys.
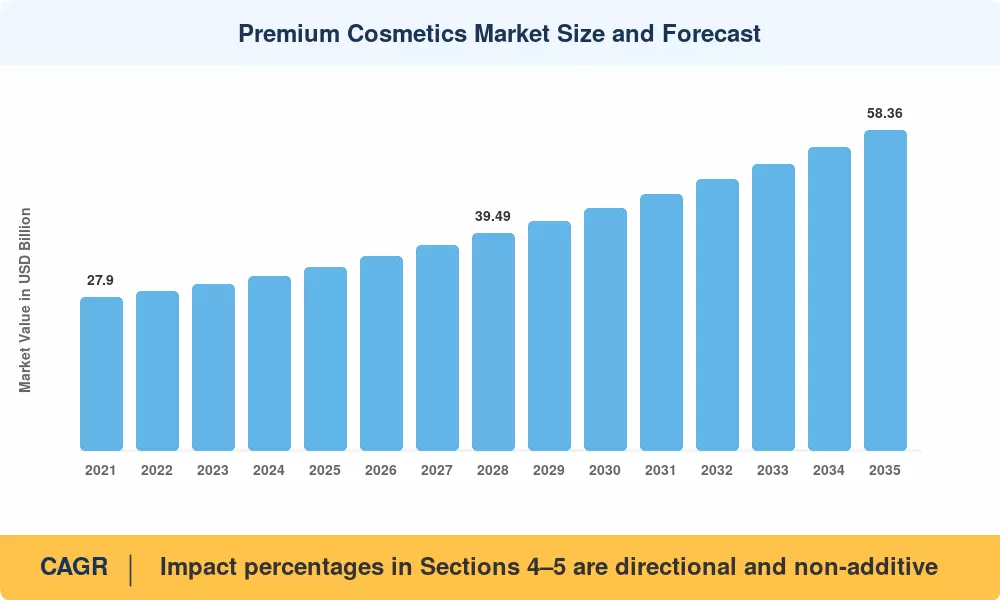
Premium Cosmetics Market Size and Forecast
Our Impact
Enabled $4.3B Revenue Impact for Fortune 500 and Leading Multinationals
Partnering with 2000+ Global Organizations Each Year
30K+ Citations by Top-Tier Firms in the Industry

Driver Impact Analysis

Driver ~% Impact on CAGR Geographic Relevance Impact Timeline
Rising demand for clean-label formulations +0.9% Global Short-term (≤2 yr)
AI-driven personalization and virtual try-on +0.8% North America, Asia-Pacific Medium-term (2–4 yr)
Expansion of premium e-commerce channels +0.7% Global Short-term (≤2 yr)
Biotech and precision-fermentation actives +0.6% Europe, North America Long-term (≥4 yr)
Growing middle-class spending in Asia-Pacific +0.8% Asia-Pacific Medium-term (2–4 yr)
Dermatologist-endorsed clinical positioning +0.5% North America, Europe Medium-term (2–4 yr)
Travel retail and duty-free channel recovery +0.4% Europe, Asia-Pacific Short-term (≤2 yr)


Clean-Label and Regulatory Compliance

The European Union regulatory framework enforces strict chemical prohibitions, restricting over 1,700 hazardous substances under formal administrative provisions. This stringent compliance model compels global cosmetics manufacturers to transition toward certified clean-label ingredients. Regulatory mandates thus establish significant structural entry barriers across regional markets, favoring established operators capable of absorbing complex supply chain adaptations and continuous formulation compliance adjustments over time.

AI Personalization Platforms

Published development reports from the Asian Development Bank indicate that developing Asia's middle-class population expanded significantly from 1.9 billion individuals, transforming regional consumer markets. Rising disposable incomes and rapid urbanization across economies like China, India, and ASEAN position the broader Asia-Pacific region as a primary long-term expansion engine for high-end retail, driving sustained structural demand for premium personal care sectors.


Asia-Pacific Middle-Class Expansion

The Asian Development Bank estimates that 3.5 billion people across Asia-Pacific will belong to middle-income households by 2030, up from 2.8 billion in 2023 [10]. South Korea and Japan continue to export clinical-grade beauty protocols, while India's premium beauty segment is growing nearly twice as fast as the mass tier. This demographic momentum makes Asia-Pacific the primary growth engine for the Premium Cosmetics Market through 2035.


Restraints Impact Analysis

Restraint ~% Impact on CAGR Geographic Relevance Impact Timeline
Counterfeit product infiltration –0.5% Asia-Pacific, MEA Short-term (≤2 yr)
Escalating MoCRA compliance costs –0.4% North America Medium-term (2–4 yr)
Social-commerce channel fragmentation –0.3% Global Short-term (≤2 yr)
Raw material price volatility –0.3% Global Long-term (≥4 yr)
Consumer fatigue with greenwashing claims –0.2% Europe, North America Medium-term (2–4 yr)


Counterfeit Infiltration

Comprehensive international economic studies by the Organisation for Economic Co-operation and Development indicate that global trade in counterfeit goods reaches approximately USD 467 billion, accounting for 2.3% of worldwide commerce. Counterfeit cosmetics and perfumery items represent prominent categories within dangerous illicit seizures. These illicit operations severely erode consumer confidence, forcing legitimate manufacturers to integrate advanced blockchain authentication protocols to protect market integrity and brand value.


MoCRA Compliance Burden

Under federal regulatory frameworks enforced by the United States government, cosmetic manufacturers must comply with mandatory facility registration and rigorous safety standards. Official federal compliance schedules require comprehensive administrative tracking and adverse-event reporting across all commercialized product lines. These legal requirements establish continuous operational oversight, prompting independent market players to allocate substantial resources toward sustaining long-term regulatory alignment and comprehensive portfolio verification procedures.


Premium Cosmetics Market Opportunities

Precision-Fermentation Ingredients

Fermentation Ingredients Industry sector analyses indicate that the global precision-fermentation market size is valued at approximately USD 6.45 billion, with robust multi-billion-dollar projections extending toward 2035. Lab-cultured active ingredients like squalane and collagen achieve cost-parity with petroleum-derived alternatives. Premium cosmetics brands capture early-mover margins by licensing exclusive biotechnology components, driving sustainable product innovation across luxury formulations.


Men's Premium Grooming Expansion

Men's prestige skincare grew 14% year-over-year in 2024 across North America and Western Europe. Brands that create gender-neutral or male-targeted lines within the Premium Cosmetics Market can address an underpenetrated demographic with higher-than-average basket sizes.

Emerging-Market Premiumization

Emerging economies experience rapid premiumization as national urbanization rates climb past 35% across expanding Tier-2 metropolitan zones. Published international development metrics from global entities highlight accelerating middle-class consumption patterns in key international markets. Regional luxury aesthetics, including localized botanical and traditional formulations, create high-value white-space opportunities for customized premium lines targeting rising disposable incomes.


Data-Monetization through Skin-Diagnostic Platforms

Brands collecting anonymized skin-health data from virtual try-on tools can license trend analytics to ingredient suppliers and retailers. This data-as-a-service model has the potential to add a 3–5% revenue stream for digitally mature participants in the Premium Cosmetics Market.

Refillable and Circular Packaging Models

Refillable compacts and airless pump systems reduce per-unit packaging costs by up to 30% after the second cycle. The EU's Packaging and Packaging Waste Regulation, targeting 2030 reuse quotas, will accelerate adoption and reward the Premium Cosmetics Market brands that invest early [15].


Premium Cosmetics Market Future Outlook

AI-Powered Product Development

Official Organisation for Economic Co-operation and Development data reveal that enterprise artificial intelligence adoption reaches approximately 20.2% across regional markets, with large firms demonstrating a 52% integration rate. International economic reports indicate that digital tools streamline workflow automation and optimize inventory management systems. Enterprise operators deploy these solutions to accelerate product development cycles, reduce operational expenditures, and drive measurable efficiency gains throughout the digital economy.


Sustainability Reporting Mandates

Under European Union directives, large commercial enterprises exceeding 1,000 employees and €450 million in net annual turnover must disclose comprehensive environmental impact metrics. Official legislative frameworks require rigorous auditing standards to ensure corporate transparency across industrial supply chains. These mandatory disclosures compel cosmetic market manufacturers to adopt verifiable circular reporting mechanisms, aligning operational practices with binding European climate objectives and standardized non-financial reporting regulations.


Clinical-Grade Consumer Beauty

International trade development reports highlight a growing consumer preference for science-backed efficacy and verified product formulations across personal care sectors. Regulatory authorities emphasize the necessity of rigorous scientific substantiation for commercial marketing claims. Consequently, premium manufacturers increasingly incorporate clinical trial validation protocols to satisfy heightened consumer expectations, ensuring full compliance with official consumer protection standards and federal trade guidelines.


Social-Commerce Platform Economics

Digital trade statistics compiled by international economic organizations reveal that digitally ordered and interactive online platforms account for exactly 25% of total trade value across major regional markets. Integrated digital checkout systems streamline consumer purchasing funnels from initial brand awareness to final transaction within single sessions. Prestige beauty brands adapt by deploying advanced creator-partnership frameworks and real-time inventory management tools to capture high-value market segments across digital networks.


Premium Cosmetics Market Segmentation

By Product Type

Segment Key Metric Primary Demand Driver
Facial Cosmetics 44.8% share (2025) Complexion-first skincare-makeup hybrid demand
Eye Cosmetics 7.11% CAGR (2026–2035) Social-media-driven eye-look trends
Lip and Nail Make-Up Cosmetics USD 7.24 Billion (2025) Seasonal color innovation cycles


Facial cosmetics dominate the Premium Cosmetics Market because the category straddles skincare and color — products like tinted serums and SPF-infused foundations satisfy dual consumer needs. The segment benefits from the highest replenishment frequency, averaging 4.2 purchases per consumer annually in mature markets. Eye cosmetics, while smaller in absolute terms, are the fastest-growing product type as platform-driven tutorials amplify demand for long-wear mascaras, eyeshadow palettes, and precision liners.

By Category

Segment Key Metric Primary Demand Driver
Natural / Organic 61.5% share (2025) Clean-label regulatory tailwinds
Conventional / Synthetic 5.18% CAGR (2026–2035) Performance-driven clinical consumers


The Premium Cosmetics Market is tilting decisively toward natural and organic formulations, a shift accelerated by COSMOS certification requirements in Europe and consumer distrust of synthetic preservatives. Conventional products retain a strong niche among consumers who prioritize measurable anti-aging efficacy and long-wear performance, sustaining a respectable growth rate even as their share contracts.

By Distribution Channel

Segment Key Metric Primary Demand Driver
Multi-Brand Stores 48.2% share (2025) Curated discovery and sampling
Online Retail Stores 7.30% CAGR (2026–2035) Social-commerce integration
Single Brand Stores USD 5.85 Billion (2025) Immersive brand experience control
Other Distribution Channels 4.82% CAGR (2026–2035) Pharmacy and travel-retail expansion


Multi-brand retailers like Sephora and Selfridges remain the largest distribution channel for the Premium Cosmetics Market, offering brands access to high-footfall environments and cross-category discovery. Online retail is the undisputed growth leader, powered by livestream commerce in Asia and subscription-box models in the West. Single-brand boutiques provide margin control and brand-storytelling opportunities that justify their high real-estate costs.


Regional Market Share Analysis

Region Key Metric Primary Investment Themes
North America 27.5% of 2025 revenue DTC digital acceleration, MoCRA compliance
Europe USD 11.56 Billion (2025) Heritage brand storytelling, COSMOS certification
Asia-Pacific 8.14% CAGR (2026–2035) K-beauty clinical positioning, e-commerce scale
South America 6.8% of 2025 revenue Urban premiumization, local ingredient sourcing
Middle East & Africa 5.3% of 2025 revenue Halal certification, luxury retail expansion
Total USD 33.40 Billion (2025)

The Premium Cosmetics Market exhibits a Europe-led structure with Asia-Pacific closing the gap rapidly. Regional dynamics reflect distinct regulatory regimes, consumer maturity levels, and distribution channel preferences.


North America

Country Key Metric Key Driver
US 78.4% of regional share Dermatologist-endorsed DTC brands
Canada 5.32% CAGR Clean-beauty consumer base expansion
Mexico USD 1.12 Billion (2025) Rising middle-class urban spending


The US dominates the North American Premium Cosmetics Market through a dense ecosystem of department-store counters, Sephora locations, and direct-to-consumer websites. MoCRA compliance is reshaping the competitive landscape by raising barriers for niche independents, while Ulta Beauty's Conscious Beauty initiative has mainstreamed clean-label curation. Canada mirrors US trends with a 12–18 month lag, and Mexico is experiencing rapid premiumization in metro areas like CDMX and Monterrey.

Europe

Country Key Metric Key Driver
Germany USD 2.08 Billion (2025) Dermatological efficacy culture
UK 18.2% of regional share Post-Brexit indie brand growth
France 5.91% CAGR Luxury house innovation pipelines
Italy USD 1.24 Billion (2025) Color cosmetics heritage
Spain 4.8% of regional share Tourism-linked duty-free demand
Nordic Countries 5.10% CAGR Sustainability-first consumer preference
Russia USD 0.62 Billion (2025) Import substitution trends
Rest of Europe 11.3% of regional share Fragmented cross-border e-commerce


Europe remains the spiritual home of the Premium Cosmetics Market, with France's LVMH, Chanel, and L'Oréal Luxe setting global pricing benchmarks. The COSMOS standard now governs over 40,000 certified products across the continent, and Germany's pharmacy-linked distribution model gives dermatological brands an edge. Brexit has created regulatory divergence that benefits agile UK independents targeting the domestic market.

Asia-Pacific

Country Key Metric Key Driver
China 36.5% of regional share Livestream social commerce
India 9.42% CAGR Tier-2 city premiumization
Japan USD 2.46 Billion (2025) Anti-aging technology leadership
South Korea 14.8% of regional share Clinical K-beauty R&D ecosystem
ASEAN 7.85% CAGR Cross-border e-commerce platforms
Rest of Asia-Pacific 6.2% of regional share Tourism-driven duty-free purchases


Asia-Pacific is redefining the Premium Cosmetics Market through a blend of cutting-edge ingredient science and social-commerce distribution. China's Douyin and Xiaohongshu platforms have turned live-streamed beauty tutorials into billion-dollar sales channels. At the same time, South Korea's regulatory sandbox allows faster ingredient approvals than either the EU or FDA frameworks permit. India's premium beauty segment is doubling every four years as domestic players like Forest Essentials scale alongside global entrants.

South America

Country Key Metric Key Driver
Brazil 68.3% of regional share Natura &Co ecosystem dominance
Argentina 4.92% CAGR Post-stabilization consumer recovery
Rest of South America USD 0.41 Billion (2025) Biodiversity-sourced botanicals


Brazil anchors South America's Premium Cosmetics Market, benefiting from Natura &Co's integrated portfolio spanning mass-to-prestige tiers. Amazon-basin biodiversity provides a unique sourcing advantage for botanical actives, while Argentina's recent macroeconomic stabilization is reopening a historically strong beauty market.

Middle East & Africa

Country Key Metric Key Driver
Saudi Arabia 32.1% of regional share Vision 2030 luxury retail buildout
UAE 5.88% CAGR Dubai's travel-retail hub status
South Africa USD 0.28 Billion (2025) Growing urban professional class
Egypt 6.24% CAGR Youth demographic dividend
Rest of MEA 19.7% of regional share Halal-certified beauty demand


The Middle East is experiencing a premium beauty boom tied to Saudi Arabia's Vision 2030 diversification agenda, which includes significant investment in luxury retail infrastructure. Dubai continues to function as a regional distribution hub for the Premium Cosmetics Market, while sub-Saharan Africa's growth remains nascent but promising as urbanization accelerates.


Premium Cosmetics Market By Region, 2025-2035

Competitive Benchmarking

The Premium Cosmetics Market exhibits medium concentration, with the top five players collectively holding an estimated 38–45% revenue share. The Herfindahl-Hirschman Index sits in the moderate range (approximately 800–1,200), reflecting a market where global conglomerates coexist with fast-scaling independents. M&A activity remains elevated as conglomerates acquire niche clean-beauty and biotech-active brands to refresh aging portfolios.

Company Est. Revenue Share Range Key Offerings Strategic Positioning
L'Oréal Luxe ~9–12% Lancôme, Yves Saint Laurent, Helena Rubinstein Broadest prestige portfolio; biotech R&D leader
The Estée Lauder Companies ~8–11% Estée Lauder, La Mer, Tom Ford Beauty Prestige skincare anchor; travel-retail dominance
LVMH (Parfums Christian Dior) ~6–9% Dior Beauty, Givenchy, Guerlain Luxury house synergy; haute-couture positioning
Shiseido Company ~5–7% Shiseido, NARS, Clé de Peau Beauté Asian clinical expertise; anti-aging R&D focus
Chanel ~4–6% Chanel Beauté, Les Beiges, Sublimage Heritage exclusivity; selective distribution
Coty Inc. ~3–5% Burberry Beauty, Gucci Beauty, Lancaster Licensed luxury portfolio; fragrance-to-color cross-sell
Puig ~3–5% Charlotte Tilbury, Jean Paul Gaultier Acquisition-led growth; digital-native brand integration
Amorepacific Corporation ~2–4% Sulwhasoo, Laneige Prestige K-beauty clinical innovation; Asia-first strategy
Beiersdorf (La Prairie) ~2–3% La Prairie, NIVEA Prestige Ultra-luxury skincare; Swiss heritage positioning
Procter & Gamble (SK-II) ~2–3% SK-II, Olay Prestige Pitera science platform; China-focused marketing


Recent News & Developments

  • L'Oréal - (July, 2026) - Entered an exclusive worldwide beauty licensing agreement with Kering for the Gucci brand, significantly strengthening its prestige cosmetics and luxury fragrance portfolio globally.
  • L'Oréal - (June, 2026) - Signed a definitive agreement to acquire a majority stake in Indian beauty platform Innovist, strategically expanding its personal care portfolio across rapidly growing emerging markets.
  • The Estée Lauder Companies - (March, 2026) - Announced an agreement to acquire full ownership of Indian prestige beauty brand Forest Essentials, strengthening its global skincare portfolio and regional market presence.

Premium Cosmetics Market Report Scope

Parameter Detail
Market Scope Premium Cosmetics Market — global coverage across product type, category, distribution channel, and geography
Study Period 2021–2035
CAGR (Forecast) 5.74% (2026–2035)
Base Year Market Size USD 33.40 Billion (2025)
Forecast Endpoint USD 58.36 Billion (2035)
Fastest Growing Segment Online Retail Stores (by distribution channel); Eye Cosmetics (by product type); Asia-Pacific (by region)
Companies Profiled L'Oréal, Estée Lauder, LVMH, Shiseido, Chanel, Coty, Puig, Amorepacific, Beiersdorf, Procter & Gamble
Valuation Currency USD Billion
CAGR Driver Disclaimer Impact percentages in Sections 4–5 are directional and non-additive


FAQs

How does MoCRA enforcement differ from EU cosmetic regulations in practical compliance terms?
MoCRA mandates facility registration and adverse-event reporting but does not yet require pre-market safety assessments. The EU regulation requires a Responsible Person to sign off on a comprehensive safety dossier before any product enters the market [6].
What margin premium do biotech-derived actives command over conventional inputs?
Precision-fermentation actives typically carry a 25–40% cost premium at the ingredient level. Brands recover this through higher retail pricing and improved consumer retention rates [2].
How are counterfeit detection technologies evolving for the Premium Cosmetics Market?
Blockchain-based serialization and NFC-embedded packaging now allow consumers to verify authenticity via smartphone scan. Adoption is highest in China and South Korea [12].
What role does travel retail play in the Premium Cosmetics Market growth trajectory?
Travel retail represented roughly 12% of global premium beauty sales in 2024. Airport duty-free remains the primary channel, with cruise and border-shop formats gaining share [4].
Which ingredient certifications carry the most weight with premium beauty consumers?
COSMOS, ECOCERT, and NATRUE certifications hold the strongest recognition in Europe and North America. In Asia-Pacific, CFDA registration and MFDS approval are equally influential [5].
How are subscription models performing within premium beauty distribution?
Premium subscription boxes achieve 18–22% higher lifetime value per customer than one-time purchases. Retention rates average 68% after six months for curated prestige offerings [9].
What acquisition criteria do conglomerates prioritize when targeting indie premium brands?
Acquirers focus on brands with USD 50–150 million revenue, above-40% gross margins, and a digital-native customer base. Strong social-media engagement often outweighs retail distribution depth [23].    
Author
Author
Author Profile
Snehal Singh LinkedIn
Manager - Research
High acumen in analyzing complex macro & micro markets with more than 6 years of work experience in the field of market research. By implementing her analytical skills in forecasting and estimation into market research reports, she has expertise in Packaging, Construction, and Equipment domains. She handles a team size of 20-25 resources and ensures smooth running of the projects, associated marketing activities, and client servicing.

Research Approach


Secondary Research

The secondary research process involved comprehensive analysis of regulatory databases, trade publications, industry associations, and authoritative market intelligence sources. Key sources included the US Food & Drug Administration (FDA) Center for Food Safety and Applied Nutrition, European Commission Directorate-General for Internal Market, Industry, Entrepreneurship and SMEs (Cosmetics Regulation EC 1223/2009), Cosmetics Europe (the European trade association for the cosmetics and personal care industry), Personal Care Products Council (PCPC), International Fragrance Association (IFRA), National Retail Federation (NRF), British Retail Consortium (BRC), China National Light Industry Council (CNLIC), Japan Ministry of Health Labour and Welfare (MHLW) Cosmetics Standard Division, German Cosmetic Toiletry Perfumery and Detergent Association (IKW), Société Française de Cosmétologie, Circana (Prestige Beauty Retail Tracking), Euromonitor International Global Market Information Database, Mintel GNPD, McKinsey & Company Consumer Packaged Goods Practice, GlobalData Consumer Intelligence, United Nations Comtrade Database, International Trade Centre (ITC) Trade Map, OECD Consumer Confidence and Retail Trade Indicators, National Bureau of Statistics of China (Retail Sales), US Census Bureau Retail Trade Data, and luxury retail consortium reports from Comité Colbert and Walpole British Luxury. These sources were used to collect import/export trade statistics, regulatory compliant formulations data, prestige pricing analytics, SKU proliferation trends, sustainability certification metrics, digital commerce penetration rates, and competitive landscape intelligence for skincare, makeup, fragrance, and specialty categories within the premium tier.


Primary Research

During the primary research process, both supply-side and demand-side stakeholders were interviewed to gather qualitative and quantitative data. Supply-side sources included CEOs, Chief Marketing Officers, Global Brand Presidents, Heads of Product Innovation, VP R&D, and supply chain directors from high-end cosmetics companies like LVMH Beauty, L'Oréal Luxe, Estée Lauder Companies, Chanel, and Shiseido. They also included quality control experts from fragrance developers and manufacturing directors from OEM/ODM partners who specialize in making high-end cosmetics. Demand-side sources included high-level buyers from high-end department stores like Harrods, Neiman Marcus, and Galeries Lafayette, as well as procurement directors from specialty beauty retailers like Sephora, Ulta Beauty, and Douglas. They also included beauty brand founders and indie operators, cosmetic chemists and formulators, spa and medi-spa medical directors, and e-commerce platform executives who run direct-to-consumer channels. Primary research affirmed price structures across several levels of distribution, confirmed the deadlines for the clean beauty and sustainability pipelines, and acquired information on how different groups of consumers (millennials vs. Gen Z) behave, the costs of luxury packaging, and the dynamics of duty-free travel shopping.

Primary Respondent Breakdown:

By Designation: C-level Primaries (32%), Director Level (31%), Others (37%)

By Region: North America (32%), Europe (30%), Asia-Pacific (26%), Rest of World (12%)


Market Size Estimation

Global market valuation was derived through revenue mapping and volume-adjusted prestige pricing analysis. The methodology included:

Identification of 50+ key manufacturers across France, USA, Japan, South Korea, Italy, Switzerland, and emerging luxury markets (India, UAE)

Product mapping across facial skincare (serums, creams, primers), color cosmetics (foundation, eye/lip products), luxury fragrances (parfum, eau de toilette), and ancillary categories (beauty tools, supplements)

Analysis of reported annual revenues specific to premium/luxe divisions (extracted from L'Oréal S.A., Estée Lauder Companies Inc., Coty Inc., Shiseido Company Limited financial statements and investor presentations)

Coverage of manufacturers and brand licensees representing 75-80% of global market share in 2024

Extrapolation using bottom-up (SKU-level volume tracking × average selling price by country, adjusted for VAT/duty fluctuations) and top-down (manufacturer revenue validation minus non-cosmetic segments) approaches to derive product-type and distribution-channel specific valuations

Triangulation with prestige retail audit data (sell-through velocity at department stores, travel retail, and branded flagship locations) and e-commerce transaction monitoring across Tmall Luxury Pavilion, Sephora.com, Brand.com direct sites, and third-party marketplace platforms

Key Differentiators from Original Methodology:

Regulatory Focus: Shifted from medical/aesthetic regulatory bodies (FDA medical devices, ISAPS, ASDS) to consumer goods regulators (FDA CFSAN Cosmetics Division, EC Cosmetics Regulation, PCPC, IFRA for fragrance standards)

Trade Intelligence: Added retail trade associations (NRF, BRC) and international trade databases (UN Comtrade, ITC Trade Map) critical for import/export analysis of luxury goods

Demand-Side Stakeholders: Replaced medical professionals (dermatologists, surgeons) with retail buyers, beauty brand founders, and luxury e-commerce directors, reflecting the shift from procedural medical devices to FMCG luxury goods

Financial Thresholds: Adjusted company tier definitions to reflect beauty industry revenue scales (<$500M vs <$1B) since pure-play beauty companies typically have smaller turnovers than pharmaceutical/aesthetic conglomerates


Primary Research

Modified regional weights to reflect the stronger influence of Europe as both a production hub (France/Italy) and consumption market for luxury cosmetics, while maintaining Asia-Pacific significance for growth trajectory analysis

Download Free Sample

Kindly complete the form below to receive a free sample of this Report

Download PDF ×

We do not share your information with anyone. However, we may send you emails based on your report interest from time to time. You may contact us at any time to opt-out.
















