Segmentation Quick Reference
| Dimension | Sub-Segments | Dominant Segment | Fastest Growing Segment |
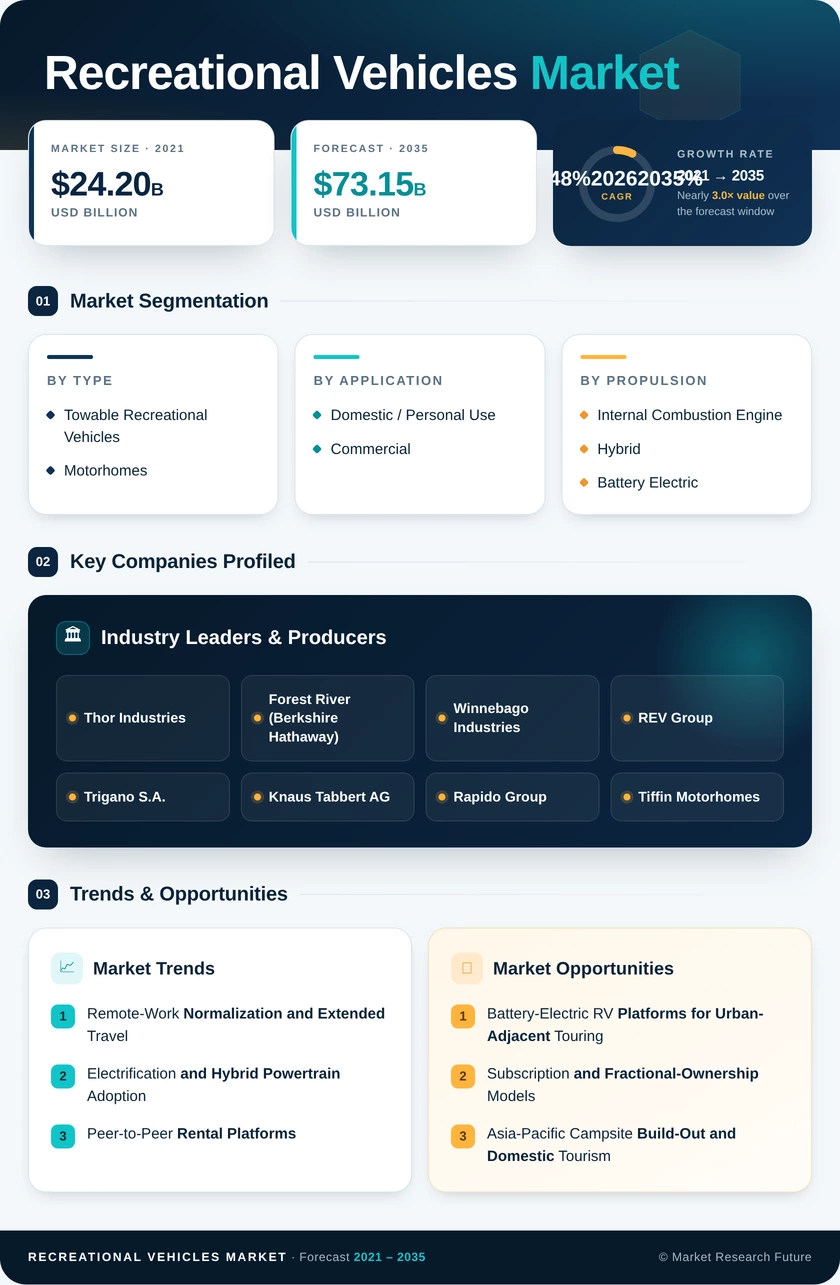
| By Type | Towable Recreational Vehicles, Motorhomes | Towable Recreational Vehicles (57.2% share, 2025) | Motorhomes (10.05% CAGR) |
| By Application | Domestic / Personal Use, Commercial | Domestic / Personal Use (65.1% share, 2025) | Commercial (9.22% CAGR) |
| By Propulsion | Internal Combustion Engine, Hybrid, Battery Electric | Internal Combustion Engine (72.8% share, 2025) | Battery Electric (25.3% CAGR) |
| By Length Category | Below 20 Feet, 20 to 30 Feet, Above 30 Feet | 20 to 30 Feet (51.3% share, 2025) | Below 20 Feet (10.1% CAGR) |
| By Geography | North America, Europe, Asia-Pacific, South America, Middle East & Africa | North America (54.7% share, 2025) | Asia-Pacific (10.3% CAGR) |
Market Segmentation Overview
By Type
| Sub-Segment | Key Trend |
| Towable Recreational Vehicles | Sustained volume leadership driven by affordability and dealer inventory depth |
| Motorhomes | Accelerating share gains through compact Class B and electric-platform launches |
Towable recreational vehicles — including travel trailers, fifth wheels, and pop-up campers — constitute the volume core of global shipments, prized by price-sensitive family buyers and seasonal users. Motorhomes are gaining momentum as manufacturers introduce compact, lifestyle-oriented models designed for younger urban consumers.
By Application
| Sub-Segment | Key Trend |
| Domestic / Personal Use | Extended trip durations fueled by remote-work flexibility |
| Commercial | Rising adoption in mobile healthcare, disaster relief, and event hospitality |
Personal-use demand remains the revenue foundation, but commercial applications are expanding as organizations recognize the cost advantages of purpose-built mobile units over fixed facilities.
By Propulsion
| Sub-Segment | Key Trend |
| Internal Combustion Engine |