Regenerative Medicine Market (2026 - 2035)

Regenerative Medicine Market Research Report: Size, Share, Trend Analysis By Applications (Orthopedics, Neurology, Cardiology, Dermatology, Oncology), By Product Type (Cell Therapy, Gene Therapy, Tissue Engineering, Stem Cell Therapy), By End Users (Hospitals, Research Laboratories, Pharmaceutical Companies, Academic Institutions), By Therapeutic Area (Musculoskeletal Disorders, Cognitive Disorders, Cardiovascular Diseases, Chronic Wounds) and By Regional (North America, Europe, South America, Asia Pacific, Middle East and Africa) - Growth Outlook & Industry Forecast 2025 To 2035

Forecast Period
2026-2035
CAGR
15.4%
2025 Market Size
USD 36.8 Billion
2035 Market Size
USD 154.2 Billion
Healthcare ● Updated August 26, 2026 Report ID: MRFR/HC/1649-CR | Pages: 200 | Author: Satyendra Maurya, Rahul Gotadki

Regenerative Medicine Market Summary

The Regenerative Medicine Market reached USD 36.8 billion in 2025 and enters the forecast window at USD 42.5 billion in 2026, climbing to USD 154.2 billion by 2035 at a 15.4% CAGR. Two catalysts anchor that trajectory. California's Proposition 14 unlocked USD 5.5 billion in dedicated stem cell and therapy funding through the California Institute for Regenerative Medicine, and the FDA's Regenerative Medicine Advanced Therapy designation — created under the 21st Century Cures Act — has compressed review timelines for scores of programs since 2016 [1][2].

There’s something systemic about these figures. Lifelong pharmacotherapy for chronic illness management is giving way to therapies with a single dosage that either completely repair or replace damaged tissue. Autologous cell processing, previously a unique academic endeavor, is now run on closed-system automated systems within commercial GMP facilities. In 2024, gene-modified cell therapy accounted for the greatest share of the USD 15+ billion sector financing recorded by the Alliance for Regenerative Medicine [3].


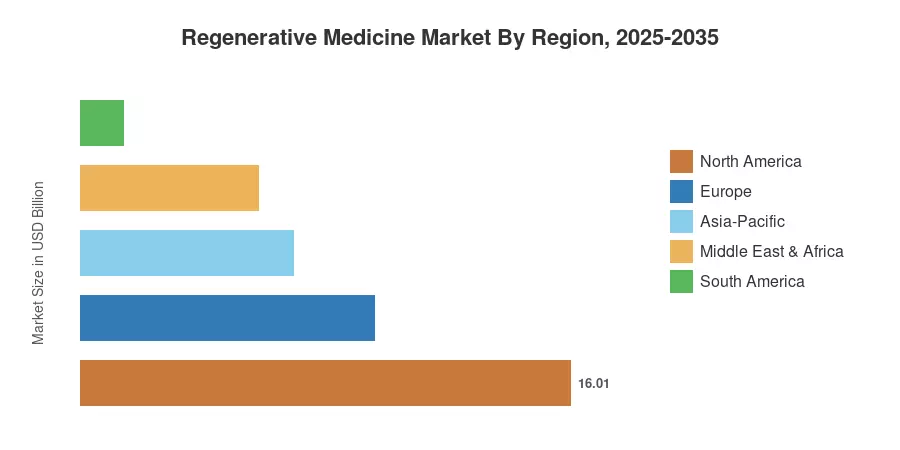
North America accounts for 43.5% of the Regenerative Medicine Market owing to FDA approval velocity and focused venture financing. Asia-Pacific: 18.9% CAGR, led by Japan’s conditional approval process and revisions by the National Medical Products Administration in China. Europe is second, with support from the Advanced Therapy Medicinal Products framework and national reimbursement programs. The next decade will reward whoever solves industrial economics first.


Key Report Takeaways

• By Technology

  • Cell therapy commands 41.2% of the Regenerative Medicine Market in 2025, the single largest technology pool
  • Gene therapy platforms expand at 18.4% CAGR through 2035, the fastest technology growth rate
  • Tissue-engineered constructs generated USD 7.9 billion in 2025 revenue

• By Sector

  • Oncology applications account for 34.6% of total demand within the Regenerative Medicine Market.
  • Musculoskeletal and orthopedic uses produced USD 6.4 billion in 2025
  • Ophthalmology grows at 19.7% CAGR, the quickest-moving therapeutic area

• By Geography

  • North America retains a 43.5% share, led by United States approval throughput.
  • Asia-Pacific posts 18.9% CAGR, the fastest regional expansion
  • Europe contributed USD 9.6 billion in 2025 revenue


Market Size and Forecast (2021–2035)

Figures below combine company-reported product revenue, procedure volume modeling over 38 countries, reimbursement claims data and clinical pipeline conversion probabilities weighted by phase. Historical years reconcile to audited filings where public issuers reveal segment-level revenue; forecast years use indication-specific launch curves instead of a one-size-fits-all growth assumption.
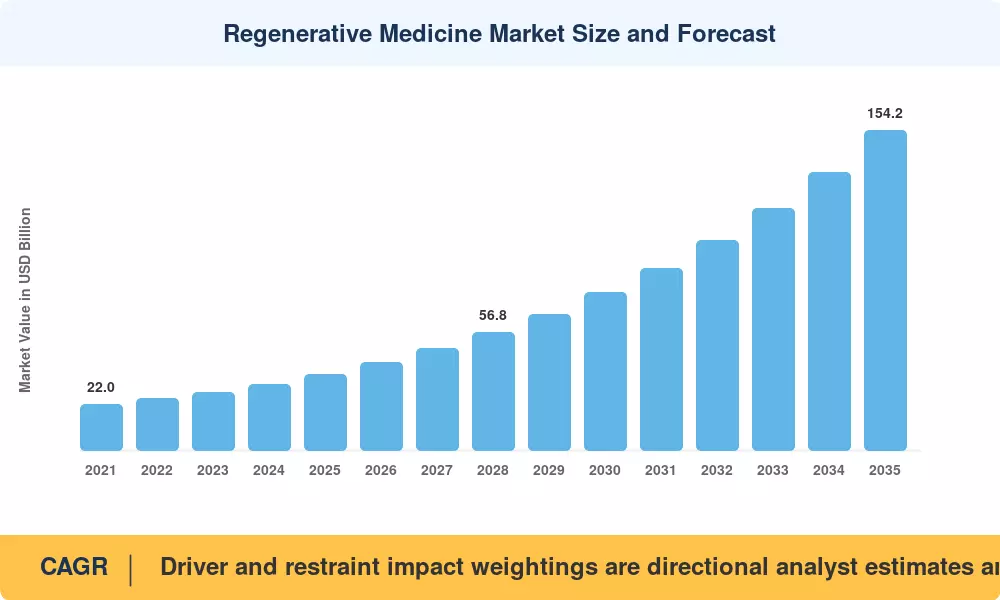
Regenerative Medicine Market Size and Forecast
Our Impact
Enabled $4.3B Revenue Impact for Fortune 500 and Leading Multinationals
Partnering with 2000+ Global Organizations Each Year
30K+ Citations by Top-Tier Firms in the Industry

Driver Impact Analysis

Driver ~% Impact on CAGR Geographic Relevance Impact Timeline
Accelerated regulatory pathways 3.4 Global Short-term (≤2 yr)
Public funding and sovereign programs 2.8 North America, Asia-Pacific Medium-term (2–4 yr)
Aging population and chronic disease load 2.6 Europe, Japan Long-term (≥4 yr)
Manufacturing automation and cost decline 2.3 Global Medium-term (2–4 yr)
Oncology pipeline maturation 2.1 North America, Europe Short-term (≤2 yr)
Reimbursement model innovation 1.6 North America Medium-term (2–4 yr)
Contract manufacturing capacity build-out 1.2 Asia-Pacific Long-term (≥4 yr)


Accelerated Regulatory Pathways

Regulators moved first, and industry followed. The FDA has granted well over 100 Regenerative Medicine Advanced Therapy designations since the programme began, each carrying eligibility for rolling review and priority handling [2]. Japan's conditional and time-limited approval route, established under the 2014 Act on the Safety of Regenerative Medicine, permits marketing on demonstrated safety plus probable efficacy — a genuine structural advantage that has attracted foreign sponsors to run first-in-human work in Tokyo and Osaka [7]. Europe's PRIME scheme delivers comparable acceleration for products addressing unmet need.

Public Funding and Sovereign Programs

California alone deployed the USD 5.5 billion authorized under Proposition 14, funding manufacturing infrastructure and clinical translation rather than basic discovery [1]. That distinction matters. The United Kingdom's Cell and Gene Therapy Catapult operates a large-scale manufacturing centre in Stevenage that has served dozens of developers, lowering the capital barrier for pre-revenue companies [8]. Similar sovereign commitments in South Korea and Singapore are converting national biotech ambitions into physical capacity within the Regenerative Medicine Market.

Manufacturing Automation and Cost Decline

Cost of goods remains the sector's binding constraint, and automation is loosening it. Closed-system bioreactors and automated fill-finish have cut per-batch labour requirements substantially versus manual open processing. At the same time, allogeneic platforms spread fixed costs across hundreds of doses instead of one [6]. Developers pursuing induced pluripotent stem cell banks report meaningfully lower marginal cost per dose at commercial scale — the economics that determine whether the Regenerative Medicine Market reaches broad populations or stays confined to catastrophic indications.


Restraints Impact Analysis

Restraint ~% Drag on CAGR Geographic Relevance Impact Timeline
Therapy pricing and payer resistance -2.9 Global Short-term (≤2 yr)
Manufacturing complexity and batch failure -2.2 Global Medium-term (2–4 yr)
Long-term durability uncertainty -1.7 North America, Europe Long-term (≥4 yr)
Specialized site infrastructure gaps -1.4 Asia-Pacific, MEA Medium-term (2–4 yr)
Ethical and jurisdictional restrictions -0.9 Europe, MEA Long-term (≥4 yr)


Therapy Pricing and Payer Resistance

List prices between USD 2 million and USD 4.25 million per patient have forced a rethink of how one-time treatments get paid for. Lenmeldy, approved by the FDA in March 2024 for metachromatic leukodystrophy, carries a list price widely reported at USD 4.25 million — the highest of any approved therapy at launch [4]. Payers respond with prior-authorization friction, outcomes-linked rebates, and outright coverage delays. Until annuity-style contracting becomes routine, price will throttle volume across the Regenerative Medicine Market.

Manufacturing Complexity and Batch Failure

Autologous production offers no second chance. A failed batch means a patient who may not survive to a retry, and out-of-specification rates in commercial CAR-T manufacturing have historically run in the high single digits [6]. Vein-to-vein times stretch to several weeks. Every manufacturing change — a new vector supplier, a facility transfer — triggers comparability requirements that regulators enforce strictly, often demanding bridging data before release resumes.

Specialized Site Infrastructure Gaps

Treatment capacity concentrates in perhaps 200 qualified centres worldwide. Community hospitals lack certified apheresis units, cryogenic storage, and staff trained in cell handling under risk evaluation protocols [15]. The result is a geographic access gap that suppresses realized demand well below clinical eligibility, particularly across secondary cities in Asia-Pacific and the Middle East.


Regenerative Medicine Market Opportunities

Off-the-Shelf Allogeneic Platforms

Allogeneic products manufactured from healthy donors or induced pluripotent stem cell banks eliminate the per-patient production cycle. Developers achieving durable persistence without heavy lymphodepletion will unseat autologous incumbents on both cost and turnaround. The commercial prize is access to earlier lines of therapy, where patient volumes multiply.

Non-Oncology Indication Expansion

Ophthalmology, type 1 diabetes, and heart failure represent large populations barely touched by approved products. Encapsulated islet replacement programmes advanced into pivotal testing during 2025, and success there would open an indication measured in millions of patients rather than thousands [17].

Emerging Market Manufacturing Hubs

India, Brazil, and Saudi Arabia are courting cell therapy manufacturing with tax incentives and streamlined import rules for starting materials. Lower operating costs make these locations viable supply bases for regional demand, and India's biotechnology policy framework explicitly targets advanced therapy localization [16].

Outcomes-Based Contracting and Data Monetization

Longitudinal registry data has become an asset in its own right. Developers who instrument post-treatment follow-up can sell durability evidence into payer negotiations, support label expansions, and license real-world datasets to insurers pricing risk on curative products [12].

Contract Development and Manufacturing Services

Capacity constraints created a services layer that captures value regardless of which therapy wins. Specialized advanced-therapy manufacturing organizations now command premium pricing and multi-year committed reservations, an attractive position within the Regenerative Medicine Market for capital that prefers infrastructure risk over clinical risk [6].


Regenerative Medicine Market Future Outlook

Automation and Machine Learning in Manufacturing

Process analytics and closed-loop control will move cell manufacturing from artisanal to industrial. Machine learning models trained on batch telemetry already predict out-of-specification outcomes before release testing, and regulators have signalled openness to continuous verification approaches under existing quality frameworks [6]. Expect release timelines to compress materially by 2030.

Platform Economics and Modular Approval

Sponsors are building single manufacturing platforms that support multiple indications, then seeking regulatory recognition of shared process data across programmes. This modular strategy shortens development for each subsequent product and creates defensible incumbency for whoever validates a platform first [2].

Payment Architecture Redesign

Health systems will not absorb a decade of multi-million-dollar launches under fee-for-service logic. Installment payments tied to durability milestones, warranty structures, and pooled risk arrangements across payers are moving from pilot to policy, with several national systems evaluating formal frameworks [12].

Global Access and Manufacturing Decentralization

Point-of-care manufacturing under hospital exemption rules could reshape distribution entirely. The World Health Organization has flagged equitable access to advanced therapies as a policy priority, and decentralized production is the most plausible route to serving middle-income populations [13].


Regenerative Medicine Market Segmentation

By Therapy Type

The Regenerative Medicine Market divides along technology lines that carry very different cost and regulatory profiles.

Segment Metric (2025) Primary Demand Driver
Cell Therapy 41.2% share Hematologic malignancy standard of care
Gene Therapy 18.4% CAGR Monogenic disease curative potential
Tissue Engineering USD 7.9 Billion Wound care and orthopedic repair volume
Biomaterials & Scaffolds 12.8% share Surgical adoption and device convergence


Cell therapy dominates because approved products already sit in treatment guidelines. Chimeric antigen receptor products have moved into earlier lines for lymphoma and myeloma, and the December 2024 approval of the first mesenchymal stromal cell therapy in the United States opened a distinct non-oncology channel [4]. Gene therapy grows faster from a smaller base — approvals for sickle cell disease, hemophilia, and metachromatic leukodystrophy have validated the modality, though pricing keeps volumes low relative to clinical eligibility.

By Application

Segment Metric (2025) Primary Demand Driver
Oncology 34.6% share Hematologic and emerging solid-tumor indications
Musculoskeletal & Orthopedics USD 6.4 Billion Cartilage repair and platelet-rich plasma therapy uptake
Dermatology & Wound Care 15.1% share Diabetic ulcer and burn treatment volume
Ophthalmology 19.7% CAGR Inherited retinal disease approvals
Cardiovascular USD 3.1 Billion Heart failure trial pipeline
Neurology & Others 11.4% share Neurodegenerative research momentum


Oncology leads on revenue but not on patient count. Musculoskeletal applications treat vastly more people at far lower price points, which is why the segment's dollar value understates its role in normalizing regenerative approaches among general practitioners. Ophthalmology's growth rate reflects small absolute numbers meeting high per-patient pricing and unusually clean efficacy endpoints — a combination regulators find easy to evaluate.

By End User

Segment Metric (2025) Primary Demand Driver
Hospitals & Specialty Clinics 52.7% share Concentration of qualified treatment centres
Academic & Research Institutes USD 6.9 Billion Investigator-initiated trial activity
Contract Manufacturing Organizations 17.6% CAGR Outsourced capacity demand
Ambulatory Surgical Centres 8.4% share Office-based orthobiologic procedures


Hospitals remain the delivery backbone and will stay there while certification requirements hold. Contract manufacturers grow fastest because nearly every clinical-stage developer outsources rather than building suites — a dependency that has made capacity reservations a competitive weapon within the Regenerative Medicine Market.


Regional Market Share Analysis

Region Metric (2025) Primary Investment Themes
North America 43.5% share Approval velocity, venture capital, payer pilots
Europe USD 9.6 Billion ATMP framework, national HTA reform
Asia-Pacific 18.9% CAGR Conditional approvals, manufacturing localization
South America USD 1.4 Billion Public hospital procurement, clinical trial hosting
Middle East & Africa 15.8% CAGR Sovereign health funds, medical tourism
Total USD 36.8 Billion

Regional performance across the Regenerative Medicine Market diverges sharply on regulatory posture and reimbursement willingness rather than on scientific capability.


North America

Country Metric Key Driver
United States 88.0% of region FDA approval throughput and RMAT designations
Canada USD 1.1 Billion Provincial funding for advanced therapies
Mexico 16.2% CAGR Cross-border treatment demand


The Centers for Medicare & Medicaid Services launched a cell and gene therapy access model for sickle cell disease effective 2025, negotiating outcomes-based agreements directly with manufacturers on behalf of participating state Medicaid programmes [12]. That intervention matters more than any single approval — it establishes a template for how public payers absorb multi-million-dollar one-time treatments.

Europe

Country Metric Key Driver
Germany 25.8% of region G-BA early benefit assessment clarity
United Kingdom USD 1.9 Billion Catapult manufacturing infrastructure
France 14.6% CAGR Forfait innovation reimbursement route
Switzerland 11.2% of region Concentrated developer and CDMO base


Regulation 1394/2007 gave Europe a unified advanced therapy definition years before other jurisdictions, but centralized approval has not produced centralized payment [10]. Sponsors still negotiate country by country, and the gap between EMA authorization and first reimbursed patient frequently exceeds eighteen months in mid-sized markets.

Asia-Pacific

Country Metric Key Driver
China 20.4% CAGR NMPA reform and domestic CAR-T approvals
Japan 31.9% of region Conditional and time-limited approval pathway
India USD 0.9 Billion Indigenous CAR-T at fraction of Western pricing
South Korea 18.6% CAGR National advanced therapy legislation
Australia 6.8% of region Clinical trial infrastructure and R&D rebates


India deserves particular attention. Domestically developed CAR-T therapy launched at a price roughly one-tenth of comparable Western products, demonstrating that the cost structure of the Regenerative Medicine Market is a choice rather than a physical constraint [16]. Chinese developers have pursued similar economics, and NMPA has approved several domestic cell therapies since 2021.

South America

Country Metric Key Driver
Brazil 61.4% of region ANVISA advanced therapy framework
Argentina USD 0.21 Billion Academic transplant centre network
Rest of South America 14.1% CAGR Regional referral consolidation


Brazil built a legitimate advanced therapy regulatory pathway through ANVISA and hosts academic programmes producing investigational cell products under hospital exemption rules. Public procurement moves slowly, but the country's transplant infrastructure gives it a credible base for scaled adoption.

Middle East & Africa

Country Metric Key Driver
Saudi Arabia 17.9% CAGR Vision 2030 health sector investment
United Arab Emirates USD 0.22 Billion Medical tourism and free-zone clinics
Israel 23.6% of region Dense biotech developer cluster
South Africa 13.6% CAGR Regional referral hub status


Gulf sovereign wealth deployment into healthcare has funded treatment centres capable of administering advanced therapies well ahead of local demand. Israel contributes disproportionate innovation relative to population, with several clinical-stage developers in cardiac and neurological repair.


Regenerative Medicine Market By Region, 2025-2035

Competitive Benchmarking

Concentration is modest and decreasing. Estimated HHI is about 780. Top 5 participants have about 34-39% of the worldwide revenue. The arrangement is actually twofold: big pharma owns the commercialized oncology franchises, and several hundred clinical-stage specialists are fighting for the next wave. A third pool is manufacturing services, selling into both.

Company Est. Revenue Share Range Key Offerings for Regenerative Medicine Market Strategic Positioning
Novartis AG ~8–11% CAR-T oncology, ocular gene therapy Broad platform incumbent
Gilead Sciences (Kite Pharma) ~7–10% Autologous CAR-T franchise Oncology-focused scale player
Vertex Pharmaceuticals ~5–8% Gene-edited hemoglobinopathy therapy, islet programmes Curative-intent specialist
Bristol Myers Squibb ~5–7% Multiple myeloma and lymphoma cell therapies Late-line to early-line expansion
Smith+Nephew plc ~4–6% Advanced wound care, orthobiologics Surgical channel strength
Integra LifeSciences ~3–5% Dermal regeneration templates, nerve repair Device-biologic convergence
Organogenesis Holdings ~3–4% Bioengineered skin substitutes Outpatient wound care leader
Lonza Group ~3–4% Contract cell and gene manufacturing Capacity infrastructure provider
Astellas Pharma ~2–4% Ophthalmic and cardiac cell programmes Pipeline acquisition strategy
Mesoblast Limited ~1–3% Mesenchymal stromal cell therapy First-mover in approved MSC products


Recent News & Developments

  • U.S. Food and Drug Administration (December 2023): Approved two gene therapies for sickle cell disease on the same day, including the first CRISPR-based medicine authorized anywhere — a regulatory milestone that legitimized gene editing as a commercial modality [4]
  • U.S. Food and Drug Administration (February 2024): Cleared the first tumor-infiltrating lymphocyte therapy for advanced melanoma, extending cell therapy beyond blood cancers into solid tumors [4]
  • U.S. Food and Drug Administration (March 2024): Approved a gene therapy for metachromatic leukodystrophy that launched at roughly USD 4.25 million, resetting payer expectations for ultra-rare disease pricing [4]
  • U.S. Food and Drug Administration (August 2024): Authorized the first engineered T-cell receptor therapy for synovial sarcoma, opening a second solid-tumor pathway [4]
  • U.S. Food and Drug Administration (December 2024): Approved the first mesenchymal stromal cell therapy in the United States for steroid-refractory graft-versus-host disease in children, validating an allogeneic non-genetic approach [4]
  • Centers for Medicare & Medicaid Services (January 2025): Began operating a cell and gene therapy access model enabling multi-state outcomes-based agreements for sickle cell treatments [12]
  • U.S. Food and Drug Administration (March 2025): Approved an encapsulated cell therapy for macular telangiectasia type 2, the first product of its kind for that indication [4]
  • U.S. Food and Drug Administration (April 2025): Cleared an autologous cell-based gene therapy for recessive dystrophic epidermolysis bullosa, expanding regenerative options in dermatology [4]


Regenerative Medicine Market Report Scope

Parameter Detail
Market Scope Global regenerative medicine products and services including cell therapy, gene therapy, tissue engineering, and biomaterials
Study Period 2021–2035 (Historical 2021–2024; Base Year 2025; Forecast 2026–2035)
CAGR 15.4% (2026–2035)
Market Size Checkpoints USD 36.8 Billion (2025); USD 42.5 Billion (2026); USD 154.2 Billion (2035)
Fastest Growing Segments Gene therapy (technology); Ophthalmology (application); Contract manufacturing (end user)
Companies Profiled Novartis, Gilead/Kite, Vertex, Bristol Myers Squibb, Smith+Nephew, Integra LifeSciences, Organogenesis, Lonza, Astellas, Mesoblast
Valuation Currency USD, constant 2025 exchange rates
CAGR Driver Disclaimer Driver and restraint impact weightings are directional analyst estimates and are not additive to the headline CAGR.

FAQs

How should investors evaluate manufacturing scalability when entering the Regenerative Medicine Market?
Autologous platforms carry per-patient cost floors that rarely drop below six figures. Allogeneic and induced pluripotent stem cell approaches amortize batch costs across hundreds of doses, making them the stronger long-horizon position. [6]
What reimbursement models are emerging for one-time curative therapies?
Outcomes-based agreements and installment payments now dominate negotiations, with public payers piloting multi-state arrangements for sickle cell treatments. Insurers increasingly demand milestone-linked rebates rather than full payment at administration. [12]
Which procurement pitfalls most affect hospital buyers in the Regenerative Medicine Market?
Cryogenic chain-of-custody failures and apheresis scheduling bottlenecks cause the majority of treatment delays. Contract for guaranteed slot allocation and validated shipper redundancy before signing. [15]
How do autologous and allogeneic approaches compare on regulatory burden?
Allogeneic products face stricter donor screening and potency assay requirements but qualify for standard batch release. Autologous products sidestep immunogenicity questions yet need per-patient release testing, which lengthens site qualification considerably. [9]
What integration challenges slow adoption at community hospitals?
Most community sites lack GMP-adjacent handling space, certified apheresis staff, and compliant risk-management workflows. Hub-and-spoke partnerships with academic centres remain the practical workaround through at least 2028. [15]
Which emerging use cases beyond oncology are worth tracking in the Regenerative Medicine Market?
Ophthalmology and type 1 diabetes islet replacement are maturing fastest outside cancer. Encapsulated islet programmes reached pivotal testing in 2025 and could unlock a multi-billion-dollar indication before 2032. [17]
What regulatory nuance most often surprises first-time entrants?
Comparability after a manufacturing change is the highest hidden cost. Switching a vector supplier can trigger bridging study requirements that add twelve to eighteen months and eight-figure expense. [2]      
Author
Author
Author Profile
Satyendra Maurya LinkedIn
Research Analyst
An accomplished research analyst with high proficiency in market forecasting, data visualization, competitive benchmarking, and others. He holds a pronounced track record in research and consulting projects for sectors such as life sciences, medical devices, and healthcare IT. His capabilities in qualitative and quantitative analysis have resulted in positive client outcomes. Working on niche market trends, opportunities, sales, and forecasted value is part of his skill set.
Co-Author
Co-Author Profile
Rahul Gotadki LinkedIn
Research Manager
He holds an experience of about 9+ years in Market Research and Business Consulting, working under the spectrum of Life Sciences and Healthcare domains. Rahul conceptualizes and implements a scalable business strategy and provides strategic leadership to the clients. His expertise lies in market estimation, competitive intelligence, pipeline analysis, customer assessment, etc.
Share::
Request Free Sample

Research Approach


Secondary Research

The secondary research process involved comprehensive analysis of regulatory databases, peer-reviewed biomedical journals, clinical trial registries, and authoritative health organizations. Key sources included the US Food & Drug Administration (FDA) Center for Biologics Evaluation and Research (CBER), European Medicines Agency (EMA) Advanced Therapy Medicinal Products (ATMP) Committee, International Society for Stem Cell Research (ISSCR), International Society for Cell & Gene Therapy (ISCT), Alliance for Regenerative Medicine (ARM), National Institutes of Health (NIH) ClinicalTrials.gov, National Center for Biotechnology Information (NCBI/PubMed), World Health Organization (WHO) Department of Health Product Policy and Standards, Organisation for Economic Co-operation and Development (OECD) Health Statistics, European Commission Joint Research Centre (JRC), Japan Pharmaceuticals and Medical Devices Agency (PMDA) Regenerative Medicine Division, and national health ministry reports from key markets (US HHS, UK MHRA, Health Canada, Australian TGA). These sources were used to collect clinical trial pipeline data, regulatory approval pathways (RMAT, PRIME, Sakigake designations), procedure adoption statistics, safety and efficacy studies, reimbursement policies, and competitive intelligence for cell therapy, gene therapy, tissue engineering, and stem cell therapy segments.


Primary Research

Qualitative and quantitative insights were obtained by interviewing supply-side and demand-side stakeholders during the primary research process. Chief Executive Officers, Chief Scientific Officers, Vice Presidents of Research and Development, Heads of Regulatory Affairs and ATMP Strategy, and commercial directors from regenerative medicine manufacturers, cell therapy developers, gene therapy biotechs, and tissue engineering companies comprised supply-side sources. Orthopedic surgeons, neurologists, cardiologists, clinical research directors at academic medical centers, heads of translational medicine at pharmaceutical companies, procurement leads for advanced therapy medicinal products at tertiary care hospitals, and principal investigators at stem cell research laboratories comprised demand-side sources. Market segmentation was validated across therapeutic areas, clinical pipeline timelines (Phase I-III) were confirmed, and insights on manufacturing scalability (autologous vs. allogeneic platforms), pricing and reimbursement strategies for cell and gene therapies, and hospital adoption barriers for advanced tissue-engineered products were gathered using primary research.

Primary Respondent Breakdown:

• By Designation: C-level Primaries (40%), Director Level (32%), Others (28%)

• By Region: North America (40%), Europe (25%), Asia-Pacific (28%), Rest of World (7%)


Market Size Estimation

Global market valuation was derived through revenue mapping and treatment volume analysis across ATMP categories. The methodology included:

• The identification of over 50 significant manufacturers and developers in North America, Europe, Asia-Pacific, and Latin America who specialize in cell-based therapies (CAR-T, MSCs, iPSCs), viral and non-viral gene therapies, and scaffold-based tissue engineering.

• Product mapping across cell therapy (autologous and allogeneic), gene therapy (in vivo and ex vivo), tissue engineering (scaffolds, biomaterials), and stem cell therapy (hematopoietic, mesenchymal, pluripotent) categories

• Analysis of reported and modeled annual revenues specific to regenerative medicine portfolios, including collaboration revenues, milestone payments, and commercial product sales

• Coverage of manufacturers representing 75-80% of global market share in 2024, accounting for concentration in CGT (cell and gene therapy) markets

• Extrapolation using bottom-up (treatment volume × Average Selling Price by therapeutic area and region) and top-down (manufacturer revenue validation and venture capital investment flow analysis) approaches to derive segment-specific valuations and growth trajectories through 2035

Share::
Request Free Sample
Download Free Sample

Kindly complete the form below to receive a free sample of this Report

* Please use a valid business email

Share::
Request Free Sample
Download PDF ×

We do not share your information with anyone. However, we may send you emails based on your report interest from time to time. You may contact us at any time to opt-out.
















