Retail Analytics Market

Key Players: SAP SE, Oracle Corporation, IBM Corporation, Microsoft Corporation, SAS Institute, Salesforce Inc., Adobe Inc., Google LLC

Retail Analytics Market

Retail Analytics Market Size, Share and Research Report By Solution (Software, Services), By Deployment (Cloud, On-Premises, Hybrid), By Function (Customer Management Analytics, Supply Chain Management Analytics, Marketing and Merchandising Analytics, Pricing and Promotion Analytics, Store Operations Analytics), By Retail Format (Pure-Play E-Commerce, Brick-And-Mortar Stores, Omnichannel Retailers) and By Regional (North America, Europe, South America, Asia Pacific, Middle East and Africa) - Industry Forecast to 2035.
ID: MRFR/ICT/2229-HCR
100 Pages
Ankit Gupta
Last Updated: June 17, 2026

Retail Analytics Market Summary

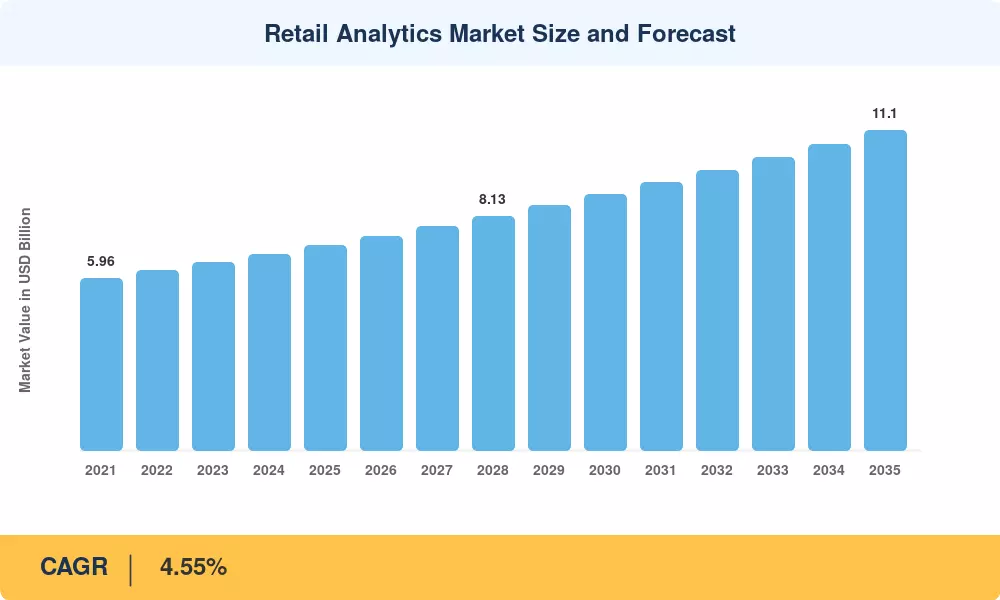
The Retail Analytics Market reached an estimated USD 7.12 Billion in 2025, with the forecast period opening at USD 7.44 Billion in 2026 and climbing to USD 11.10 Billion by 2035 at a 4.55% CAGR. Surging omnichannel commerce and a rapid pivot toward AI-embedded decision-making are compelling retailers to treat customer behavior analysis as an operational backbone rather than a discretionary investment. Governments in North America and the EU have also tightened data-governance mandates, which paradoxically accelerated analytics adoption by forcing brands to consolidate fragmented data lakes into compliant, insight-ready platforms [2].

Traditional spreadsheet-based reporting and segregated point-of-sale data analytics stacks are being replaced by cloud-native platforms that combine prescriptive inventory optimization tools with generative AI copilots. According to Adobe’s 2025 Digital Trends survey, 63% of today’s large retailers spend more than 5% of their digital budgets on real-time personalization engines, compared to less than 30% three years ago [1]. This shift is rethinking how merchants think about price, store space and promotional tempo.


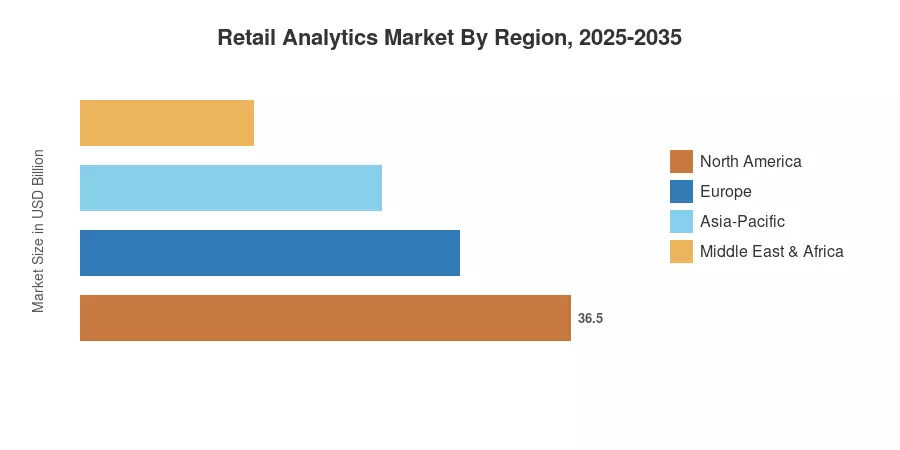
North America accounts for around 35.0% of the Retail Analytics Market, buoyed by a dense ecosystem of SaaS vendors and early-adopter supermarket and apparel chains. Asia-Pacific is the fastest expanding market with a predicted CAGR of 5.60% through 2035, led by the rise of digital retail in India, China and Southeast Asia. Europe is the second greatest contributor, boosted by improvements in data infrastructure during the GDPR era that now feed complex retail sales forecasting pipelines. The convergence of generative AI and prescriptive analytics points to a clear growth trajectory for the industry.


Key Report Takeaways

• By Solution

  • Software accounted for 66.8% of the Retail Analytics Market expenditure in 2025, reflecting demand for unified dashboards and shopper journey insights platforms.
  • Services represent the quickest-growth path at an 8.1% CAGR through 2035, driven by managed analytics and consulting engagements.

• By Function


  • Customer management analytics captured a 23.5% share of the Retail Analytics Market in 2025, the largest functional slice.
  • Marketing and merchandising analytics are on track for the sharpest acceleration at an 8.55% CAGR to 2035.

• By Geography

  • North America dominated the Retail Analytics Market with a 35.0% revenue share in 2025, underpinned by retail sales forecasting maturity among top-50 chains.
  • Asia-Pacific is forecast to grow at a 5.60% CAGR through 2035, the fastest of all regions.


Retail Analytics Market Size and Forecast (2021–2035)

Market Research Future (MRFR) uses a combination of bottom-up vendor revenue modeling and top-down macroeconomic cross-checks for its estimates. Historical data (2021-2024) is based on published company filings. Forecasts are based on adoption surveys, IT budget trackers and point-of-sale data analytics implementation benchmarks from more than 400 retailers worldwide [3].

Retail Analytics Market Size and Forecast
Our Impact
Enabled $4.3B Revenue Impact for Fortune 500 and Leading Multinationals
Partnering with 2000+ Global Organizations Each Year
30K+ Citations by Top-Tier Firms in the Industry

Driver Impact Analysis

Driver ~% Impact on CAGR Geographic Relevance Impact Timeline
Omnichannel data integration +0.9% Global Short-term (≤2 yr)
AI/ML-powered retail sales forecasting +0.8% North America, Europe Medium-term (2–4 yr)
Cloud-first analytics platforms +0.7% Global Short-term (≤2 yr)
Regulatory data-governance mandates +0.5% Europe, Asia-Pacific Medium-term (2–4 yr)
Real-time customer behavior analysis +0.4% North America, APAC Medium-term (2–4 yr)
IoT & edge-computing in stores +0.3% North America, Europe Long-term (≥4 yr)
Generative AI copilot integration +0.4% Global Long-term (≥4 yr)


Omnichannel Data Integration

Retailers operating across physical stores, marketplaces, and direct-to-consumer apps now generate petabytes of transactional and behavioral data daily. The NRF's 2024 State of Retail Technology report found that 71% of surveyed merchants planned to unify shopper journey insights across at least three channels by 2026, up from 42% in 2022 [4]. This consolidation feeds richer customer behavior analysis models that improve basket-size predictions and reduce promotional waste.

AI/ML-Powered Demand Forecasting

Machine-learning demand engines have matured from experimental pilots into core production systems across the grocery and fashion sectors. Industry analysis indicates that AI-driven forecasting significantly outperforms traditional statistical methods by incorporating real-time signals—such as weather patterns, social media trends, and local event data—to predict demand. The primary business benefit for top-tier retailers is a marked reduction in inventory write-offs and carrying costs. These operational efficiencies generate consistent margin improvements, providing a recurring reinvestment pool that funds further digital transformation.


Cloud-First Analytics Platforms

Cloud deployment is now the standard for modern retail analytics, offering the elasticity and speed required to handle high-frequency data. By shifting away from legacy on-premise infrastructure, retailers can reduce the upfront capital expenditure associated with licensing and hardware. Furthermore, cloud-native platforms from major providers (AWS, Azure, GCP) provide pre-built retail analytics blueprints, significantly compressing the time-to-value for mid-tier chains. This democratization of data access allows smaller organizations to leverage predictive insights that were previously reserved for industry giants.


Generative AI Copilots

Generative AI is fundamentally changing how merchandisers and store planners interact with data. The industry is moving away from a reliance on static SQL queries and rigid BI dashboards toward conversational, natural-language interfaces. These AI "copilots" allow non-technical staff to ask complex questions about inventory levels, markdown timing, and regional performance in plain language. By lowering the barrier to entry for data analysis, generative AI is helping to bridge the historic "skill gap," allowing retailers to act on insights faster and with greater confidence.


Restraints Impact Analysis

Impact percentages below are directional drag estimates and do not net directly against driver contributions.

Restraint ~% Impact on CAGR Geographic Relevance Impact Timeline
Data-privacy compliance costs –0.4% Europe, Global Short-term (≤2 yr)
Integration complexity with legacy POS –0.3% North America, Europe Medium-term (2–4 yr)
Talent shortage in data science –0.3% Global Long-term (≥4 yr)
Data-quality & governance gaps –0.2% Asia-Pacific, South America Medium-term (2–4 yr)
Cybersecurity & breach risk –0.2% Global Short-term (≤2 yr)


Data-Privacy Compliance Costs

Regulatory frameworks, including the EU’s GDPR, California's CPRA, and India's DPDP Act, have established a stringent environment for data handling. Cumulative GDPR enforcement fines continue to rise, signaling that regulators are taking a more aggressive stance on data misuse. For retailers, this necessitates significant investment in consent-management layers and privacy-by-design architectures. While these compliance measures represent a considerable upfront investment and can lengthen development timelines, they are increasingly viewed as essential requirements to mitigate legal risk and maintain consumer trust.


Legacy POS Integration Complexity

Many retail organizations across North America and Europe continue to rely on legacy on-premise POS systems. These systems often utilize proprietary data formats that do not natively integrate with modern, cloud-based analytics platforms. This creates a technical bottleneck, requiring the development of middleware or complex data-extraction pipelines. Consequently, the speed of digital transformation—and the ability to access real-time insights—is often limited by the time and resources required to modernize or bridge these older infrastructures.


Data-Science Talent Shortage

The demand for data science professionals is accelerating, with the U.S. Bureau of Labor Statistics projecting robust growth for the field through 2034. However, retailers often struggle to compete with technology firms for top-tier talent. The specialized nature of retail analytics—which requires a blend of data-science expertise and domain-specific knowledge of consumer behavior—makes recruitment challenging. This talent gap often constrains the speed at which retailers can scale their predictive forecasting models and optimize their customer journey initiatives.


Retail Analytics Market Opportunities

Generative-AI-Driven Analytics Democratization

Low-code and no-code interfaces powered by large language models are lowering the analytics skill floor, enabling category managers and store associates to query data conversationally. This broadens the addressable user base for inventory optimization tools inside organizations that previously relied on centralized BI teams.

Emerging-Market Digital Retail Expansion

India's ONDC open-commerce protocol and Southeast Asia's booming social-commerce ecosystem are creating greenfield demand for cloud analytics platforms. Market Research Future (MRFR) estimates that ASEAN retail data volumes will triple between 2025 and 2030, unlocking a USD 800 million incremental opportunity for customer behavior analysis solutions.

Data Monetization and Retail Media Networks

Retailers such as Walmart, Kroger, and Amazon are building advertising networks atop first-party shopper data. These retail media platforms depend on granular point-of-sale data analytics and shopper journey insights to sell targeted ad placements, creating a new analytics-as-revenue-stream business model.

Sustainability and ESG-Linked Supply Chain Analytics

Scope 3 emissions reporting rules from the EU's CSRD and the SEC's climate-disclosure proposals are forcing retailers to embed carbon-tracking modules into supply-chain analytics stacks. This creates demand for augmented inventory optimization tools that balance cost, service level, and carbon footprint simultaneously.

Autonomous Store and Cashierless Checkout Analytics

Computer-vision-powered checkout-free stores generate rich spatial data that feeds customer behavior analysis and real-time planogram optimization. As sensor costs decline, the Retail Analytics Market gains a high-value niche in physical-store intelligence.


Retail Analytics Market Future Outlook

AI-Autonomous Retail Operations

By 2030, autonomous replenishment loops—where algorithms trigger purchase orders without human approval—will become standard in top-tier grocery and convenience formats. forecasts that 25% of supply-chain decisions in retail will be fully autonomous by 2028, intensifying demand for real-time inventory optimization tools [6].

Platform Economics and Composable Commerce

Monolithic analytics suites are yielding to composable, API-first architectures that let retailers mix best-of-breed modules for customer behavior analysis, pricing, and markdown optimization. MACH Alliance adoption among enterprise retailers grew 48% year-over-year in 2024, signaling a structural shift that the Retail Analytics Market must accommodate through open ecosystem plays [18].

Retail Media and First-Party Data Monetization

BCG estimates global retail media ad spend will exceed USD 130 billion by 2028 [19]. Every dollar of that spend relies on shopper journey insights and granular point-of-sale data analytics to match advertisers with high-intent audiences. Retailers that master analytics will capture both cost savings and revenue from media monetization.

ESG and Circular-Economy Analytics

Scope 3 reporting requirements under the EU CSRD and proposed SEC rules will compel retailers to integrate carbon-tracking into supply-chain dashboards. Retail sales forecasting models will evolve to co-optimize revenue and emissions, creating a premium analytics layer that differentiates sustainability leaders [20].


Retail Analytics Market Segmentation

By Solution

Segment Key Metric Primary Demand Driver
Software 66.8% share (2025) Unified dashboard and AI model demand
Services 8.1% CAGR (2026–2035) Managed analytics, consulting and implementation


Software dominates the Retail Analytics Market because retailers overwhelmingly prefer platform licenses that bundle retail sales forecasting, customer segmentation, and promotion-optimization modules. The services segment is accelerating as mid-tier retailers outsource analytics operations to specialist firms rather than building internal teams, particularly for complex shopper journey insights deployments [14].

By Deployment

Segment Key Metric Primary Demand Driver
Cloud 8.45% CAGR (2026–2035) Elastic compute, pay-as-you-go economics
On-Premises 28.2% share (2025) Regulatory data-residency requirements
Hybrid 5.80% CAGR (2026–2035) Gradual migration from legacy POS systems


Cloud deployment is the growth engine of the Retail Analytics Market, cutting time-to-value and letting chains of all sizes run inventory optimization tools without heavy capital outlays. On-premises installations remain relevant in regulated environments—such as EU grocery chains subject to strict data-residency rules—while hybrid models serve as a transitional architecture for retailers modernizing legacy point-of-sale data analytics infrastructure [7].

By Function

Segment Key Metric Primary Demand Driver
Customer Management Analytics 23.5% share (2025) Loyalty, personalization, churn prediction
Supply Chain Management Analytics 20.0% share (2025) Demand sensing, logistics optimization
Marketing and Merchandising Analytics 8.55% CAGR (2026–2035) Retail media, assortment planning
Pricing and Promotion Analytics 16.5% share (2025) Dynamic pricing, markdown optimization
Store Operations Analytics 4.70% CAGR (2026–2035) Workforce scheduling, planogram compliance


Customer management analytics leads the Retail Analytics Market by share because loyalty programs and customer behavior analysis use cases deliver the most visible ROI. Marketing and merchandising analytics is the fastest-growing function, propelled by the retail media boom that requires real-time audience segmentation and campaign attribution across digital and physical touchpoints [19].

By Retail Format

Segment Key Metric Primary Demand Driver
Pure-Play E-Commerce 54.5% share (2025) Native digital data capture, A/B testing culture
Brick-And-Mortar Stores 3.85% CAGR (2026–2035) In-store IoT sensors, computer-vision checkout
Omnichannel Retailers 5.40% CAGR (2026–2035) Unified commerce, BOPIS and curbside analytics


Pure-play e-commerce operators anchor the Retail Analytics Market because digital-native data capture makes customer behavior analysis and retail sales forecasting inherently easier to operationalize. Omnichannel retailers are closing the gap rapidly, investing in shopper journey insights that stitch together in-store foot traffic, app engagement, and marketplace transactions into a single customer view [4].


Regional Market Share Analysis

Region Key Metric Primary Investment Themes
North America 35.0% share (2025) AI copilots, retail media analytics, cloud migration
Europe 22.0% share (2025) GDPR-compliant platforms, sustainability analytics
Asia-Pacific 5.60% CAGR (2026–2035) Social commerce, mobile-first analytics, and ONDC
South America USD 0.39 Billion (2025) E-commerce infrastructure, regional marketplace analytics
Middle East & Africa 4.5% share (2025) Smart-city retail, luxury tourism analytics
Total USD 7.12 Billion (2025)

The Retail Analytics Market displays pronounced regional variation, with mature markets investing in AI-augmented platforms and developing regions prioritizing foundational cloud deployment for retail sales forecasting and shopper journey insights.


North America

Country Key Metric Key Driver
United States 78.5% of regional share Enterprise SaaS penetration, retail media spend
Canada 12.8% of regional share Omnichannel grocery analytics
Mexico 8.7% of regional share Rapid e-commerce growth via the Mercado Libre ecosystem


North America's dominance in the Retail Analytics Market stems from deep SaaS vendor density and aggressive retail media expansion. The U.S. alone accounts for nearly four-fifths of regional revenue, fueled by Walmart, Target, and Kroger deploying inventory optimization tools and customer behavior analysis engines across thousands of stores [4].

Europe

Country Key Metric Key Driver
Germany 5.10% CAGR Industry 4.0 crossover into retail logistics
United Kingdom 24.5% of regional share Grocery loyalty analytics, Tesco Clubcard ecosystem
France 18.2% of regional share Hypermarket analytics modernization
Italy 3.80% CAGR Fashion and luxury retail digitization
Spain 4.05% CAGR Tourism-driven retail analytics
Nordic Countries 12.0% of regional share Cashless-society data richness
Russia 3.50% CAGR Domestic marketplace analytics (Ozon, Wildberries)
Rest of Europe 15.3% of regional share Varied adoption pace


Europe's Retail Analytics Market growth is anchored by GDPR-era investments that created compliant data pipelines now feeding sophisticated point-of-sale data analytics and retail sales forecasting applications. The UK leads through mature loyalty-program ecosystems, while Germany applies manufacturing-grade supply-chain analytics to retail logistics [10].

Asia-Pacific

Country Key Metric Key Driver
China 38.0% of regional share Super-app ecosystems, live-commerce analytics
India 6.30% CAGR ONDC, Jio-Mart and Flipkart analytics buildout
Japan 16.5% of regional share Convenience-store precision analytics
South Korea 5.85% CAGR Mobile-first shopping, K-commerce data engines
ASEAN 5.95% CAGR Social commerce, Shopee and Lazada ecosystems
Rest of Asia-Pacific 9.8% of regional share Emerging digital retail infrastructure


Asia-Pacific is the fastest-growing region in the Retail Analytics Market, propelled by massive mobile-commerce penetration and government-backed digital commerce initiatives. China's super-app platforms generate unparalleled volumes of shopper journey insights, while India's open-network protocols are democratizing retail sales forecasting for millions of small merchants [15].

South America

Country Key Metric Key Driver
Brazil 62.0% of regional share Mercado Libre, Magazine Luiza analytics ecosystem
Argentina 4.40% CAGR Inflation-driven dynamic-pricing analytics
Rest of South America 18.0% of regional share Marketplace consolidation


Brazil dominates South America's Retail Analytics Market spend, driven by a maturing e-commerce sector and growing demand for customer behavior analysis tools that manage high-frequency promotional cycles in an inflationary environment [15].

Middle East & Africa

Country Key Metric Key Driver
Saudi Arabia 28.5% of regional share Vision 2030 retail modernization
UAE 5.20% CAGR Luxury and tourism retail intelligence
South Africa 22.0% of regional share Grocery chain analytics expansion
Egypt 4.80% CAGR Youth-demographic e-commerce adoption
Rest of MEA 20.5% of regional share Early-stage digital retail buildout


The Middle East & Africa represent a nascent yet fast-evolving segment of the Retail Analytics Market. Saudi Arabia's Vision 2030 framework includes explicit retail-digitization targets, spurring demand for inventory optimization tools and point-of-sale data analytics among newly licensed international brands [17].


Retail Analytics Market By Region, 2025-2035

Competitive Benchmarking

The Retail Analytics Market is moderately concentrated, with the top five players accounting for an estimated 35-42% share of the market revenue globally. The competitive landscape is littered with business software titans, cloud hyperscalers and analytics pure-plays, creating a fragmented, innovation-rich landscape.

Company Est. Revenue Share Range Key Offerings for the Retail Analytics Market Strategic Positioning
SAP SE ~8–11% SAP Customer Activity Repository, SAP Analytics Cloud End-to-end ERP-integrated analytics
Oracle Corporation ~7–10% Oracle Retail Insights, Oracle Unity CDP Cloud-native retail suite
IBM Corporation ~5–8% IBM Watson Commerce, IBM Planning Analytics AI-first enterprise analytics
Microsoft Corporation ~6–9% Microsoft Fabric, Dynamics 365 Commerce Insights Azure-integrated retail intelligence
SAS Institute ~4–6% SAS Viya, SAS Customer Intelligence 360 Advanced statistical analytics
Salesforce Inc. ~5–7% Tableau, Salesforce Commerce Cloud Einstein CRM-to-analytics unification
Adobe Inc. ~4–6% Adobe Analytics, Adobe Real-Time CDP Experience-cloud-anchored analytics
Google LLC ~3–5% Looker, Google Cloud Retail AI Hyperscaler retail solutions
Qlik Technologies ~2–4% Qlik Sense, Qlik Application Automation Associative analytics engine
Teradata Corporation ~2–3% Teradata Vantage, ClearScape Analytics Large-scale data warehousing


Recent News & Developments


  • Microsoft Corporation (November 2024): Released Copilot for Retail in Dynamics 365, allowing merchandisers to query inventory optimization tools via natural language prompts [8].


  • Google LLC (April 2024): Expanded Google Cloud Retail AI to include shelf-intelligence APIs powered by edge computer vision, deepening in-store analytics capabilities [12].


Retail Analytics Market Report Scope

Parameter Detail
Market Scope Global Retail Analytics Market covering software, services, cloud/on-premises/hybrid deployment, functional analytics categories, and retail formats
Study Period 2021–2035
CAGR (2026–2035) 4.55%
Market Size (2025) USD 7.12 Billion
Market Size (2035) USD 11.10 Billion
Fastest Growing Segment Services (by solution); Cloud (by deployment); Marketing and Merchandising Analytics (by function)
Companies Profiled SAP, Oracle, IBM, Microsoft, SAS Institute, Salesforce, Adobe, Google, Qlik, Teradata
Valuation Currency USD Billion


FAQs

How should procurement teams evaluate retail analytics vendor lock-in risk?

Prioritize vendors offering open APIs and MACH-compliant architectures that allow module swaps without full replatforming [18]. Contractual data-portability clauses are equally critical.

What ROI timeline should a mid-size retailer expect from a Retail Analytics Market solution?

Most mid-size deployments achieve breakeven within 12–18 months, primarily through reduced markdowns and improved retail sales forecasting accuracy [8].

How does the Retail Analytics Market address data-sovereignty concerns in cross-border operations?

Leading platforms offer region-specific cloud instances and configurable data-residency policies that satisfy GDPR, DPDP, and CPRA requirements simultaneously [10].

Which emerging use case in the Retail Analytics Market offers the highest near-term value?

Retail media network analytics delivers immediate revenue because it monetizes existing shopper journey insights and point-of-sale data analytics without incremental inventory risk [19].

How do edge-computing advancements affect in-store customer behavior analysis?

On-device inference processes video and sensor feeds locally, cutting cloud-transit latency below 100 milliseconds and enabling real-time planogram compliance alerts [12].

What integration challenges arise when connecting legacy ERP systems to modern Retail Analytics Market platforms?

Proprietary data formats and batch-oriented ERP exports often require middleware translation layers, adding 8–15% to project budgets and extending timelines by three to six months [13].

How are inventory optimization tools evolving to support circular-economy retail models?

Next-generation platforms incorporate reverse-logistics modules that forecast return volumes and resale values, enabling closed-loop inventory planning [20].


Author
Author
Author Profile
Ankit Gupta LinkedIn
Team Lead - Research
Ankit Gupta is a seasoned market intelligence and strategic research professional with over six plus years of experience in the ICT and Semiconductor industries. With academic roots in Telecom, Marketing, and Electronics, he blends technical insight with business strategy. Ankit has led 200+ projects, including work for Fortune 500 clients like Microsoft and Rio Tinto, covering market sizing, tech forecasting, and go-to-market strategies. Known for bridging engineering and enterprise decision-making, his insights support growth, innovation, and investment planning across diverse technology markets.

Research Approach


Secondary Research

The secondary research process involved comprehensive analysis of technology regulatory databases, peer-reviewed data science journals, retail industry publications, and authoritative economic organizations. Key sources included the US Federal Trade Commission (FTC), Consumer Financial Protection Bureau (CFPB), US Census Bureau (Monthly Retail Trade Survey), Bureau of Labor Statistics (Retail Sector Data), National Institute of Standards and Technology (NIST), Payment Card Industry Security Standards Council (PCI SSC), European Data Protection Board (EDPB), Eurostat (Digital Economy & Society Statistics), Organisation for Economic Co-operation and Development (OECD) Digital Economy Outlook, National Retail Federation (NRF), Retail Industry Leaders Association (RILA), eCommerce Europe, Asia-Pacific Retailers Convention & Exhibition (APRCE), IEEE Computer Society Digital Library, ACM Digital Library, Gartner Research, IDC Retail Insights, Forrester Research, and national statistical offices from key markets. These sources were employed to gather retail sales data, digital transformation metrics, software adoption rates, data privacy compliance frameworks, consumer behavior analytics, and market landscape analysis for cloud-based analytics platforms, on-premise solutions, AI/ML-powered retail tools, and managed analytics services.


Primary Research

Qualitative and quantitative insights were obtained by interviewing supply-side and demand-side stakeholders during the primary research process. The supply-side sources consist of CEOs, Chief Technology Officers (CTOs), VPs of Product Development, Chief Data Officers, leaders of AI/ML divisions, and commercial directors from retail analytics software vendors, cloud service providers, system integrators, and AI platform developers. The demand-side sources included Chief Data Officers, VPs of Omnichannel Strategy, Directors of Digital Transformation, Heads of Customer Analytics, procurement leads from large retail chains, e-commerce platforms, grocery conglomerates, fashion retailers, specialty stores, and quick-service restaurant (QSR) groups. Primary research verified market segmentation across component categories, verified AI/ML product pipeline timelines, and collected insights on cloud migration patterns, software-as-a-service (SaaS) adoption rates, pricing models, and omnichannel implementation challenges.

Primary Respondent Breakdown:

• By Designation: C-level Primaries (40%), Director Level (35%), Others (25%)

• By Region: North America (40%), Europe (22%), Asia-Pacific (32%), Rest of World (6%)


Market Size Estimation

Revenue mapping and deployment volume analysis were implemented to determine global market valuation. The methodology comprised the following:

• Identification of over 45 significant software vendors and service providers in North America, Europe, Asia-Pacific, and Latin America

• Product mapping that encompasses managed services (consulting, implementation, and support), on-premises software platforms, AI/ML-powered analytics tools, and cloud-based solutions

• Examination of the annual revenues that have been reported and modeled for retail analytics portfolios

• Vendor coverage that accounts for 70-75% of the global market share in 2024

• Segment-specific valuations for large enterprises and SMEs are derived through extrapolation using bottom-up (enterprise deployment volume × average selling price by organization size and component type) and top-down (vendor revenue validation and IT expenditure analysis) approaches.

Download Free Sample

Kindly complete the form below to receive a free sample of this Report

Download PDF ×

We do not share your information with anyone. However, we may send you emails based on your report interest from time to time. You may contact us at any time to opt-out.