×
Hero Background
English
Chinese
French
Japanese
Korean
German
Spanish

Scale Inhibitors Market Trends

ID: MRFR/CnM/4941-CR
151 Pages
Chitranshi Jaiswal
September 2018

Scale Inhibitors Market Research Report Information By Type (Phosphonates, Carboxylate/Acrylate, Sulfonates and Others), By Application (Power, Mining, Oil & Gas, Petrochemicals, Paper Mills and Others) - Forecast till 2035

Share:
Download PDF ×

We do not share your information with anyone. However, we may send you emails based on your report interest from time to time. You may contact us at any time to opt-out.

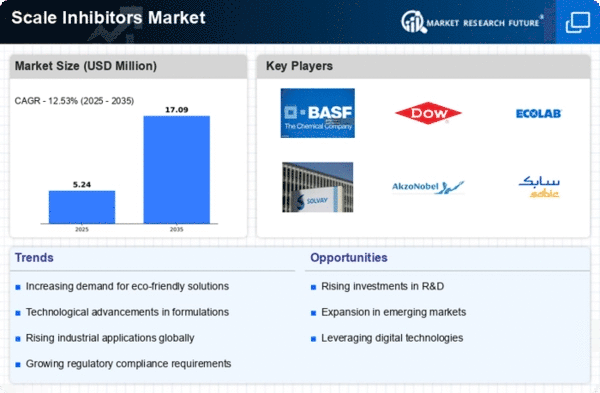
Scale Inhibitors Market Infographic
Purchase Options

Market Trends

Key Emerging Trends in the Scale Inhibitors Market

The demand for scale inhibitors has grown remarkably over the past years due substantially driven by increasing water treatment needs from various industries. That is why scale inhibitors that play vital role in preventing scales formation in industrial equipment’s, pipelines and water treatment facilities have experienced increased demand because of their effectiveness in cutting operational costs and maintaining equipment efficiency. Scale inhibitors sector trends have been greatly influenced by several main factors.

One of the major drivers enhancing growth in scale inhibitors market is the increasing emphasis on conserving water resources and efficient water management practices across sectors. As water scarcity becomes a global issue, industries have started deploying technologies that facilitate recycling of wastewater, minimizing wastage or reusing it altogether. In this regard, scale inhibitors take center stage by ensuring that no scaling problems arise within waters treatment systems thereby facilitating effective usage of water while stretching useful life of machinery.

Additionally, the expansion of industrialization particularly in regions experiencing high rates has hugely contributed to an increase in demand for scale inhibitors. They include oil & gas industry; chemical manufacturing plants; power generation facilities; food processing plants among others which consume large volumes of water during their operations. By avoiding scaling issues, corrosion or deposition into machinery or pipes used in these fields hence reducing downtime and maintenance expenses that occur when running smoothly.

Advancements related to technology and innovation within the sector have played a key role influencing trends pertaining to scale inhibitor formulation. Companies invest their time and money on research and development (R&D) so as to come up with more efficient yet environmentally friendly inhibiting agents. This involves the making of new chemicals and formulations that not only efficiently prevent scale but also meet strict environmental laws, thus boosting market growth.

Nevertheless, challenges like expensive advanced inhibitor formulas and availability of alternative solutions for water treatment inhibit scale inhibitors markets from realizing their full potential. Additionally, price volatility related to raw materials and global events affecting economies can affect market dynamics.

Author
Chitranshi Jaiswal
Research Analyst Level I

In her 3 years of experience in the market research field, she has handled critical cross-domain projects. She has an in-depth knowledge of market estimation & analysis, problem-solving, primary as well as secondary research, and team management.She holds an engineering degree and is an MBA professional from a well-known university, capable of evaluating the market and competitive conditions. An exceptional strategist with excellent communication skills and a passion for delivering cutting-edge & practical insights for the market. Proficient in multi-tasking, and can successfully deal with competing demands, while maintaining complete confidentiality. Generated business through active client and project development, networking, and high-quality responses. Her knowledge and skills have helped in making solid business decisions, securing funding from investors, and avoiding business failures.

Leave a Comment

FAQs

What is the contribution of the application segment towards the market?

The application segments comprise certain areas like petrochemicals, mining, oil and gas sectors, paper mills units, and many more. The power application units cover a growth of CAGR of 4.67% in the upcoming years where a huge amount is spent on the development. The power segment has marked that it owns a CAGR of 26.67% in the overall scale inhibitors market during the market forecast period. These power sectors and the units owe to the escalating requirement for the treatment of wastewater. The oil and gas units occupy the second-largest growth because the government is investing much more in deepwater as well as in ultra-deepwater exploration activities especially in the South China Sea along with an increase in the availability of oil reserves along with the regions of the Gulf of Mexico.

What notes about the North American market?

The scale inhibitors market growth in the North American region occupies a significant growth due to the large exploration activities of shale gas. The market in the United States is said to be the most advanced market throughout the market region where it should retain its contribution during the assessment period. In some of the industries of power and construction, mining industry, oil, and gas industry contribute to large advancement activities are the major factors that steer up the scale inhibitors market growth and scale inhibitors market size.

How does the progress in the Middle East and African region take place?

It has been found that the Middle East and African region occupies a CAGR of 5.61% during the forecast period. Concerning the rise in demand for crude oil the growth of scale, types of research pieces, types of researchGange of researchGangeinhibitors are largely used in industries where it has been used in mining sectors, power treatment, water treatment which will bolster up the market size.

Market Summary

The Global Scale Inhibitors Market is projected to grow from 2.89 USD Billion in 2024 to 4.13 USD Billion by 2035.

Key Market Trends & Highlights

Scale Inhibitors Market Key Trends and Highlights

  • The market is expected to expand at a compound annual growth rate of 3.28 percent from 2025 to 2035.
  • By 2035, the market valuation is anticipated to reach 4.13 USD Billion, indicating robust growth.
  • The base year market valuation for 2024 stands at 2.89 USD Billion, reflecting the current demand for scale inhibitors.
  • Growing adoption of advanced water treatment technologies due to increasing industrial applications is a major market driver.

Market Size & Forecast

2024 Market Size 2.89 (USD Million)
2035 Market Size 4.13 (USD Million)
CAGR (2025-2035) 3.28%
Largest Regional Market Share in 2024 latin_america)

Major Players

Kemira Oyj, DowDuPont, BASF SE, Solenis, American Water Chemicals Inc., Ecolab, SUEZ, Clariant, BWA Water Additives, Arkema SA

Market Trends

Scale Inhibitors Market Market Drivers

Increasing Industrial Demand

The Global Scale Inhibitors Market Industry experiences a surge in demand driven by various industrial sectors, particularly oil and gas, water treatment, and power generation. Industries are increasingly adopting scale inhibitors to enhance operational efficiency and reduce maintenance costs associated with scale formation. For instance, the oil and gas sector utilizes scale inhibitors to prevent mineral deposits in pipelines, which can lead to costly downtime. As of 2024, the market is valued at approximately 2.89 USD Billion, indicating a robust growth trajectory. This trend is expected to continue, with projections suggesting a market value of 4.13 USD Billion by 2035, reflecting a compound annual growth rate of 3.28% from 2025 to 2035.

Market Segment Insights

Regional Insights

Key Companies in the Scale Inhibitors Market market include

Industry Developments

May 2023:

 ScaleTek, a manufacturer of scale inhibitors, announced the acquisition of ScaleGuard, a competitor in the market. The acquisition is expected to strengthen ScaleTek's position in the market and expand its product offerings.

June 2023:

 ChemTreat, a provider of water treatment chemicals, announced the launch of its new scale inhibitor product, ChemTreat ScaleGuard Xtreme. The product is designed to be more effective than traditional scale inhibitors and to provide longer-lasting protection.

Future Outlook

Scale Inhibitors Market Future Outlook

The Scale Inhibitors Market is projected to grow at a 3.28% CAGR from 2024 to 2035, driven by increasing industrialization, water treatment needs, and technological advancements.

New opportunities lie in:

  • Develop eco-friendly scale inhibitors to meet regulatory demands.
  • Invest in R&D for advanced formulations targeting specific industries.
  • Expand distribution networks in emerging markets to capture new customer bases.

By 2035, the Scale Inhibitors Market is expected to demonstrate robust growth and innovation, solidifying its competitive landscape.

Market Segmentation

COMPETITIVE LANDSCAPE

  • Arkema SA of France.
  • BWA Water Additives of the United States and
  • Clariant of Switzerland,
  • SUEZ of France,
  • Ecolab of the United States,
  • American Water Chemicals Inc. of the United States,
  • Solenis of the United States,
  • BASF SE of Germany,
  • DowDuPont of the United States,
  • Kemira Oyj of Finland,

Report Scope

Report Attribute/Metric Details
  Market Size   USD 3286 million 2030
  CAGR   4.67% (2022-2030)
  Base Year   2021
  Forecast Period   2022-2030
  Historical Data   2019 & 2020
  Forecast Units   Value (USD Million)
  Report Coverage   Revenue Forecast, Competitive Landscape, Growth Factors, and Trends
  Segments Covered   Type, Application
  Geographies Covered   North America, Europe, Asia-Pacific, and Rest of the World (RoW)
  Key Vendors   Kemira Oyj (Finland), DowDuPont (U.S.), BASF SE (Germany), Solenis (U.S.), American Water Chemicals Inc. (U.S.), Ecolab (U.S.), Clariant (Switzerland), Arkema SA (France), SUEZ (France), BWA Water Additives (U.S.)
  Key Market Opportunities   The Middle East’s Vast Oil Reserves to be Major Opportunities
  Key Market Drivers   Strong Demand in Water & Wastewater Treatment to be a Key Growth Booster

FAQs

What is the contribution of the application segment towards the market?

The application segments comprise certain areas like petrochemicals, mining, oil and gas sectors, paper mills units, and many more. The power application units cover a growth of CAGR of 4.67% in the upcoming years where a huge amount is spent on the development. The power segment has marked that it owns a CAGR of 26.67% in the overall scale inhibitors market during the market forecast period. These power sectors and the units owe to the escalating requirement for the treatment of wastewater. The oil and gas units occupy the second-largest growth because the government is investing much more in deepwater as well as in ultra-deepwater exploration activities especially in the South China Sea along with an increase in the availability of oil reserves along with the regions of the Gulf of Mexico.

What notes about the North American market?

The scale inhibitors market growth in the North American region occupies a significant growth due to the large exploration activities of shale gas. The market in the United States is said to be the most advanced market throughout the market region where it should retain its contribution during the assessment period. In some of the industries of power and construction, mining industry, oil, and gas industry contribute to large advancement activities are the major factors that steer up the scale inhibitors market growth and scale inhibitors market size.

How does the progress in the Middle East and African region take place?

It has been found that the Middle East and African region occupies a CAGR of 5.61% during the forecast period. Concerning the rise in demand for crude oil the growth of scale, types of research pieces, types of researchGange of researchGangeinhibitors are largely used in industries where it has been used in mining sectors, power treatment, water treatment which will bolster up the market size.

  1. Report Prologue
  2. Market Introduction
    1. Definition 18
    2. Scope of the Study 18
    3. List of Assumptions
    4. Market Structure 19
  3. Market Insights
    1. Research Methodology
    2. Research Process 25
    3. Primary Research
    4. Secondary Research 26
    5. Market Size Estimation 27
    6. Forecast Model 28
  4. Market Dynamics
    1. Introduction
    2. Drivers 31
      1. Increasing Demand for Scale Inhibitors
      2. Rising Demand
      3. Growing
    3. in the Energy Sector and Water Treatment Industry 31
    4. for Water Treatment Additives in Developing Countries 32
    5. Demand for Biodegradable and Efficient Scale Inhibitors 32
    6. Restraints
      1. Volatile Prices of Raw Materials 33
      2. Environmental
    7. Impact of Scale Inhibitors 33
    8. Opportunity 34
      1. Increasing
    9. Investments in Exploration and Production of Oil & Gas 34
    10. Trend
      1. Water Scarcity and Focus on Energy Efficiency 34
    11. Market Factor Analysis
    12. Supply Chain Analysis 36
      1. Raw
      2. Scale Inhibitors Manufacturers 36
      3. End-Use Application Industry 37
      4. Threat of New Entrants 37
      5. Threat of Substitutes 38
      6. Bargaining
      7. Bargaining Power of Buyers 38
    13. Material Suppliers 36
    14. Distribution Channel 36
    15. Porter's Five Forces Analysis 37
    16. Threat of Rivalry 37
    17. Power of Suppliers 38
  5. Global Scale Inhibitors Market, by Type
    1. Introduction 40
    2. Phosphonates 42
    3. Carboxylate/Acrylate 43
    4. Sulfonates 44
    5. Others 45
  6. Global Scale Inhibitors Market, by Application
    1. Introduction 47
    2. Power 49
    3. Mining 50
    4. Oil
    5. & Gas 51
    6. Petrochemicals 52
    7. Paper Mills 53
    8. Others 54
  7. Global Scale Inhibitors Market, by Region
    1. Introduction 56
    2. NORTH AMERICA 60
      1. US 62
    3. Canada 64
    4. EUROPE 67
      1. Germany 70
      2. UK
      3. Spain 74
      4. Italy 76
      5. France 78
      6. Poland 82
      7. Rest of Europe 84
      8. China 89
      9. Japan 91
      10. India 95
      11. South Korea 97
    5. Russia 80
    6. ASIA-PACIFIC 86
    7. ASEAN 93
    8. Rest of Asia-Pacific 99
    9. LATIN AMERICA 101
      1. Brazil 104
      2. Argentina 108
      3. Rest of Latin America 110
      4. Turkey 115
      5. Saudi Arabia
      6. UAE 119
      7. North Africa 121
      8. Rest
    10. Mexico 106
    11. MIDDLE EAST & AFRICA 112
    12. of the Middle East & Africa 123
  8. Competitive Landscape
    1. Competitive Analysis 126
  9. Company Profiles
    1. American Water
      1. Company Overview 128
      2. Financial
      3. Products Offered 128
      4. Key Developments
      5. SWOT Analysis 129
      6. Key Strategy 129
      7. Company Overview 130
      8. Financial Overview
      9. Products Offered 130
      10. Key Developments 131
      11. Key Strategy 131
    2. Chemicals, Inc. 128
    3. Overview 128
    4. Clariant 130
    5. SWOT Analysis 131
    6. Kemira Oyj 132
      1. Financial Overview 132
      2. Products
      3. Key Developments 133
      4. SWOT Analysis
      5. Key Strategies 133
    7. Company Overview 132
    8. Offered 132
    9. SUEZ 134
      1. Financial Overview 134
      2. Products
      3. Key Developments 135
      4. SWOT Analysis
      5. Key Strategies 135
    10. Company Overview 134
    11. Offered 135
    12. Ecolab 136
      1. Financial Overview 136
      2. Key Developments 137
      3. SWOT
      4. Key Strategies 137
    13. 1.5.1Company Overview 136
    14. Products Offered 137
    15. Analysis 137
    16. BWA Water Additives
      1. Company Overview 138
      2. Financial Overview 138
      3. Key Developments 139
      4. SWOT
      5. Key Strategy 139
    17. Products Offered 138
    18. Analysis 139
    19. Solenis 140
      1. Financial Overview 140
      2. Products
      3. Key Developments 140
      4. SWOT Analysis
      5. Key Strategy 141
    20. Company Overview 140
    21. Offered 140
    22. Arkema SA 142
      1. Financial Overview 142
      2. Products
      3. Key Developments 143
      4. SWOT Analysis
      5. Key Strategies 143
    23. Company Overview 142
    24. Offered 143
    25. DowDuPont 144
      1. Financial Overview 144
      2. Products
      3. Key Developments 145
      4. SWOT Analysis
      5. Key Strategies 145
    26. Company Overview 144
    27. Offered 145
    28. BASF SE 146
      1. Financial Overview 146
      2. Key Developments 147
      3. SWOT
      4. Key Strategy 147
    29. Company Overview 146
    30. Products Offered 146
    31. Analysis 147
  10. Conclusion
    1. Key Findings 149
  11. List of Tables
    1. TABLE
  12. MARKET SYNOPSIS 16
  13. LIST OF ASSUMPTIONS 18
    1. TABLE 2
    2. GLOBAL SCALE INHIBITORS, BY TYPE, 2020-2027(USD MILLION) 40
  14. GLOBAL
  15. SCALE INHIBITORS MARKET, BY TYPE, 2020-2027(KT) 41
  16. GLOBAL SCALE
  17. INHIBITORS MARKET FOR PHOSPHONATES, BY REGION, 2020-2027(USD MILLION) 42
    1. TABLE
  18. GLOBAL SCALE INHIBITORS MARKET FOR PHOSPHONATES, BY REGION, 2020-2027(KT) 42
    1. TABLE
  19. GLOBAL SCALE INHIBITORS MARKET FOR CARBOXYLATE/ACRYLATE, BY REGION, 2020-2027(USD
    1. MILLION) 43
  20. GLOBAL SCALE INHIBITORS MARKET FOR CARBOXYLATE/ACRYLATE,
    1. BY REGION, 2020-2027(KT) 43
  21. GLOBAL SCALE INHIBITORS MARKET FOR
    1. SULFONATES, BY REGION, 2020-2027(USD MILLION) 44
  22. GLOBAL SCALE
  23. INHIBITORS MARKET FOR SULFONATES, BY REGION, 2020-2027(KT) 44
    1. TABLE 10
  24. GLOBAL SCALE INHIBITORS MARKET FOR OTHERS, BY REGION, 2020-2027(USD MILLION) 45
    1. TABLE
  25. GLOBAL SCALE INHIBITORS MARKET FOR OTHERS, BY REGION, 2020-2027(KT) 45
    1. TABLE
  26. GLOBAL SCALE INHIBITORS, BY APPLICATION, 2020-2027(USD MILLION) 47
    1. TABLE
  27. GLOBAL SCALE INHIBITORS MARKET, BY APPLICATION, 2020-2027(KT) 48
    1. TABLE
  28. GLOBAL SCALE INHIBITORS MARKET FOR POWER, BY REGION, 2020-2027(USD MILLION) 49
    1. TABLE
  29. GLOBAL SCALE INHIBITORS MARKET FOR POWER, BY REGION, 2020-2027(KT) 49
    1. TABLE
  30. GLOBAL SCALE INHIBITORS MARKET FOR MINING, BY REGION, 2020-2027(USD MILLION)
  31. GLOBAL SCALE INHIBITORS MARKET FOR MINING, BY REGION, 2020-2027(KT)
  32. GLOBAL SCALE INHIBITORS MARKET FOR OIL & GAS, BY REGION,
  33. GLOBAL SCALE INHIBITORS MARKET FOR
    1. OIL & GAS, BY REGION, 2020-2027(KT) 51
  34. GLOBAL SCALE INHIBITORS
  35. MARKET FOR PETROCHEMICALS, BY REGION, 2020-2027(USD MILLION) 52
    1. TABLE
  36. GLOBAL SCALE INHIBITORS MARKET FOR PETROCHEMICALS, BY REGION, 2020-2027(KT) 52
    1. TABLE
  37. GLOBAL SCALE INHIBITORS MARKET FOR PAPER MILLS, BY REGION, 2020-2027(USD MILLION)
  38. GLOBAL SCALE INHIBITORS MARKET FOR PAPER MILLS, BY REGION,
  39. GLOBAL SCALE INHIBITORS MARKET FOR MEDICAL,
    1. BY REGION, 2020-2027(USD MILLION) 54
  40. GLOBAL SCALE INHIBITORS
  41. MARKET FOR MEDICAL, BY REGION, 2020-2027(KT) 54
  42. GLOBAL SCALE
  43. INHIBITORS MARKET, BY REGION, 2020-2027(USD MILLION) 56
  44. GLOBAL
  45. SCALE INHIBITORS MARKET, BY REGION, 2020-2027(KT) 57
  46. GLOBAL SCALE
  47. INHIBITORS MARKET, BY TYPE, 2020-2027(USD MILLION) 58
  48. GLOBAL
  49. SCALE INHIBITORS MARKET, BY TYPE, 2020-2027(KT) 58
  50. GLOBAL SCALE
  51. INHIBITORS MARKET, BY APPLICATION, 2020-2027(USD MILLION) 59
    1. TABLE 31
  52. GLOBAL SCALE INHIBITORS MARKET, BY APPLICATION, 2020-2027(KT) 59
    1. TABLE
  53. NORTH AMERICA: SCALE INHIBITORS MARKET, BY COUNTRY, 2020-2027(USD MILLION) 60
    1. TABLE
  54. NORTH AMERICA: SCALE INHIBITORS MARKET, BY COUNTRY, 2020-2027(KT) 60
    1. TABLE
  55. NORTH AMERICA: SCALE INHIBITORS MARKET, BY TYPE, 2020-2027(USD MILLION) 60
    1. TABLE
  56. NORTH AMERICA: SCALE INHIBITORS MARKET, BY TYPE, 2020-2027(KT) 61
    1. TABLE
  57. NORTH AMERICA: SCALE INHIBITORS MARKET, BY APPLICATION, 2020-2027(USD MILLION)
  58. NORTH AMERICA: SCALE INHIBITORS MARKET, BY APPLICATION, 2020-2027(KT)
  59. US: SCALE INHIBITORS MARKET, BY TYPE, 2020-2027(USD MILLION)
  60. US: SCALE INHIBITORS MARKET, BY TYPE, 2020-2027(KT) 63
    1. TABLE
  61. US: SCALE INHIBITORS MARKET, BY APPLICATION, 2020-2027(USD MILLION) 63
    1. TABLE
  62. US: SCALE INHIBITORS MARKET, BY APPLICATION, 2020-2027(KT) 64
    1. TABLE
  63. CANADA: SCALE INHIBITORS MARKET, BY TYPE, 2020-2027(USD MILLION) 64
    1. TABLE
  64. CANADA: SCALE INHIBITORS MARKET, BY TYPE, 2020-2027(KT) 65
    1. TABLE 44
  65. CANADA: SCALE INHIBITORS MARKET, BY APPLICATION, 2020-2027(USD MILLION) 65
    1. TABLE
  66. CANADA: SCALE INHIBITORS MARKET, BY APPLICATION, 2020-2027(KT) 66
    1. TABLE
  67. EUROPE: SCALE INHIBITORS MARKET, BY COUNTRY, 2020-2027(USD MILLION) 67
    1. TABLE
  68. EUROPE: SCALE INHIBITORS MARKET, BY COUNTRY, 2020-2027(KT) 67
    1. TABLE
  69. EUROPE: SCALE INHIBITORS MARKET, BY TYPE, 2020-2027(USD MILLION) 68
    1. TABLE
  70. EUROPE: SCALE INHIBITORS MARKET, BY TYPE, 2020-2027(KT) 68
    1. TABLE 50
  71. EUROPE: SCALE INHIBITORS MARKET, BY APPLICATION, 2020-2027(USD MILLION) 69
    1. TABLE
  72. EUROPE: SCALE INHIBITORS MARKET, BY APPLICATION, 2020-2027(KT) 69
    1. TABLE
  73. GERMANY: SCALE INHIBITORS MARKET, BY TYPE, 2020-2027(USD MILLION) 70
    1. TABLE
  74. GERMANY: SCALE INHIBITORS MARKET, BY TYPE, 2020-2027(KT) 70
    1. TABLE 54
  75. GERMANY: SCALE INHIBITORS MARKET, BY APPLICATION, 2020-2027(USD MILLION) 71
    1. TABLE
  76. GERMANY: SCALE INHIBITORS MARKET, BY APPLICATION, 2020-2027(KT) 71
    1. TABLE
  77. UK: SCALE INHIBITORS MARKET, BY TYPE, 2020-2027(USD MILLION) 72
    1. TABLE
  78. UK: SCALE INHIBITORS MARKET, BY TYPE, 2020-2027(KT) 72
  79. UK:
  80. SCALE INHIBITORS MARKET, BY APPLICATION, 2020-2027(USD MILLION) 73
    1. TABLE
  81. UK: SCALE INHIBITORS MARKET, BY APPLICATION, 2020-2027(KT) 73
    1. TABLE
  82. SPAIN: SCALE INHIBITORS MARKET, BY TYPE, 2020-2027(USD MILLION) 74
    1. TABLE
  83. SPAIN: SCALE INHIBITORS MARKET, BY TYPE, 2020-2027(KT) 74
    1. TABLE 62
  84. SPAIN: SCALE INHIBITORS MARKET, BY APPLICATION, 2020-2027(USD MILLION) 75
    1. TABLE
  85. SPAIN: SCALE INHIBITORS MARKET, BY APPLICATION, 2020-2027(KT) 75
    1. TABLE
  86. ITALY: SCALE INHIBITORS MARKET, BY TYPE, 2020-2027(USD MILLION) 76
    1. TABLE
  87. ITALY: SCALE INHIBITORS MARKET, BY TYPE, 2020-2027(KT) 76
    1. TABLE 66
  88. ITALY: SCALE INHIBITORS MARKET, BY APPLICATION, 2020-2027(USD MILLION) 77
    1. TABLE
  89. ITALY: SCALE INHIBITORS MARKET, BY APPLICATION, 2020-2027(KT) 77
    1. TABLE
  90. FRANCE: SCALE INHIBITORS MARKET, BY TYPE, 2020-2027(USD MILLION) 78
    1. TABLE
  91. FRANCE: SCALE INHIBITORS MARKET, BY TYPE, 2020-2027(KT) 78
    1. TABLE 70
  92. FRANCE: SCALE INHIBITORS MARKET, BY APPLICATION, 2020-2027(USD MILLION) 79
    1. TABLE
  93. FRANCE: SCALE INHIBITORS MARKET, BY APPLICATION, 2020-2027(KT) 79
    1. TABLE
  94. RUSSIA: SCALE INHIBITORS MARKET, BY TYPE, 2020-2027(USD MILLION) 80
    1. TABLE
  95. RUSSIA: SCALE INHIBITORS MARKET, BY TYPE, 2020-2027(KT) 80
    1. TABLE 74
  96. RUSSIA: SCALE INHIBITORS MARKET, BY APPLICATION, 2020-2027(USD MILLION) 81
    1. TABLE
  97. RUSSIA: SCALE INHIBITORS MARKET, BY APPLICATION, 2020-2027(KT) 81
    1. TABLE
  98. POLAND: SCALE INHIBITORS MARKET, BY TYPE, 2020-2027(USD MILLION) 82
    1. TABLE
  99. POLAND: SCALE INHIBITORS MARKET, BY TYPE, 2020-2027(KT) 82
    1. TABLE 78
  100. POLAND: SCALE INHIBITORS MARKET, BY APPLICATION, 2020-2027(USD MILLION) 83
    1. TABLE
  101. POLAND: SCALE INHIBITORS MARKET, BY APPLICATION, 2020-2027(KT) 83
    1. TABLE
  102. REST OF EUROPE: SCALE INHIBITORS MARKET, BY TYPE, 2020-2027(USD MILLION) 84
    1. TABLE
  103. REST OF EUROPE: SCALE INHIBITORS MARKET, BY TYPE, 2020-2027(KT) 84
    1. TABLE
  104. REST OF EUROPE: SCALE INHIBITORS MARKET, BY APPLICATION, 2020-2027(USD MILLION)
  105. REST OF EUROPE: SCALE INHIBITORS MARKET, BY APPLICATION, 2020-2027(KT)
  106. ASIA-PACIFIC: SCALE INHIBITORS MARKET, BY COUNTRY, 2020-2027(USD
    1. MILLION) 86
  107. ASIA-PACIFIC: SCALE INHIBITORS MARKET, BY COUNTRY,
  108. ASIA-PACIFIC: SCALE INHIBITORS MARKET, BY TYPE,
  109. ASIA-PACIFIC: SCALE INHIBITORS MARKET,
    1. BY TYPE, 2020-2027(KT) 87
  110. ASIA-PACIFIC: SCALE INHIBITORS MARKET,
    1. BY APPLICATION, 2020-2027(USD MILLION) 88
  111. ASIA-PACIFIC: SCALE
  112. INHIBITORS MARKET, BY APPLICATION, 2020-2027(KT) 88
  113. CHINA: SCALE
  114. INHIBITORS MARKET, BY TYPE, 2020-2027(USD MILLION) 89
  115. CHINA:
  116. SCALE INHIBITORS MARKET, BY TYPE, 2020-2027(KT) 89
  117. CHINA: SCALE
  118. INHIBITORS MARKET, BY APPLICATION, 2020-2027(USD MILLION) 90
    1. TABLE 93
  119. CHINA: SCALE INHIBITORS MARKET, BY APPLICATION, 2020-2027(KT) 90
    1. TABLE
  120. JAPAN: SCALE INHIBITORS MARKET, BY TYPE, 2020-2027(USD MILLION) 91
    1. TABLE
  121. JAPAN: SCALE INHIBITORS MARKET, BY TYPE, 2020-2027(KT) 91
    1. TABLE 96
  122. JAPAN: SCALE INHIBITORS MARKET, BY APPLICATION, 2020-2027(USD MILLION) 92
    1. TABLE
  123. JAPAN: SCALE INHIBITORS MARKET, BY APPLICATION, 2020-2027(KT) 92
    1. TABLE
  124. ASEAN: SCALE INHIBITORS MARKET, BY TYPE, 2020-2027(USD MILLION) 93
    1. TABLE
  125. ASEAN: SCALE INHIBITORS MARKET, BY TYPE, 2020-2027(KT) 93
    1. TABLE 100
  126. ASEAN: SCALE INHIBITORS MARKET, BY APPLICATION, 2020-2027(USD MILLION) 94
    1. TABLE
  127. ASEAN: SCALE INHIBITORS MARKET, BY APPLICATION, 2020-2027(KT) 94
    1. TABLE
  128. INDIA: SCALE INHIBITORS MARKET, BY TYPE, 2020-2027(USD MILLION) 95
    1. TABLE
  129. INDIA: SCALE INHIBITORS MARKET, BY TYPE, 2020-2027(KT) 95
    1. TABLE 104
  130. INDIA: SCALE INHIBITORS MARKET, BY APPLICATION, 2020-2027(USD MILLION) 96
    1. TABLE
  131. INDIA: SCALE INHIBITORS MARKET, BY APPLICATION, 2020-2027(KT) 96
    1. TABLE
  132. SOUTH KOREA: SCALE INHIBITORS MARKET, BY TYPE, 2020-2027(USD MILLION) 97
    1. TABLE
  133. SOUTH KOREA: SCALE INHIBITORS MARKET, BY TYPE, 2020-2027(KT) 97
    1. TABLE
  134. SOUTH KOREA: SCALE INHIBITORS MARKET, BY APPLICATION, 2020-2027(USD MILLION)
  135. SOUTH KOREA: SCALE INHIBITORS MARKET, BY APPLICATION, 2020-2027(KT)
  136. REST OF ASIA-PACIFIC: SCALE INHIBITORS MARKET, BY TYPE, 2020-2027(USD
    1. MILLION) 99
  137. REST OF ASIA-PACIFIC: SCALE INHIBITORS MARKET, BY
    1. TYPE, 2020-2027(KT) 99
  138. REST OF ASIA-PACIFIC: SCALE INHIBITORS
  139. MARKET, BY APPLICATION, 2020-2027(USD MILLION) 100
  140. REST OF ASIA-PACIFIC:
  141. SCALE INHIBITORS MARKET, BY APPLICATION, 2020-2027(KT) 100
  142. LATIN
  143. AMERICA: SCALE INHIBITORS MARKET, BY COUNTRY, 2020-2027(USD MILLION) 101
    1. TABLE
  144. LATIN AMERICA: SCALE INHIBITORS MARKET, BY COUNTRY, 2020-2027(KT) 101
    1. TABLE
  145. LATIN AMERICA: SCALE INHIBITORS MARKET, BY TYPE, 2020-2027(USD MILLION) 102
    1. TABLE
  146. LATIN AMERICA: SCALE INHIBITORS MARKET, BY TYPE, 2020-2027(KT) 102
    1. TABLE
  147. LATIN AMERICA: SCALE INHIBITORS MARKET, BY APPLICATION, 2020-2027(USD MILLION)
  148. LATIN AMERICA: SCALE INHIBITORS MARKET, BY APPLICATION,
  149. BRAZIL: SCALE INHIBITORS MARKET, BY TYPE,
  150. BRAZIL: SCALE INHIBITORS MARKET,
    1. BY TYPE, 2020-2027(KT) 104
  151. BRAZIL: SCALE INHIBITORS MARKET,
    1. BY APPLICATION, 2020-2027(USD MILLION) 105
  152. BRAZIL: SCALE INHIBITORS
  153. MARKET, BY APPLICATION, 2020-2027(KT) 105
  154. MEXICO: SCALE INHIBITORS
  155. MARKET, BY TYPE, 2020-2027(USD MILLION) 106
  156. MEXICO: SCALE INHIBITORS
  157. MARKET, BY TYPE, 2020-2027(KT) 106
  158. MEXICO: SCALE INHIBITORS
  159. MARKET, BY APPLICATION, 2020-2027(USD MILLION) 107
  160. MEXICO: SCALE
  161. INHIBITORS MARKET, BY APPLICATION, 2020-2027(KT) 107
  162. ARGENTINA:
  163. SCALE INHIBITORS MARKET, BY TYPE, 2020-2027(USD MILLION) 108
    1. TABLE 129
  164. ARGENTINA: SCALE INHIBITORS MARKET, BY TYPE, 2020-2027(KT) 108
    1. TABLE 130
  165. ARGENTINA: SCALE INHIBITORS MARKET, BY APPLICATION, 2020-2027(USD MILLION) 109
    1. TABLE
  166. ARGENTINA: SCALE INHIBITORS MARKET, BY APPLICATION, 2020-2027(KT) 109
    1. TABLE
  167. REST OF LATIN AMERICA: SCALE INHIBITORS MARKET, BY TYPE, 2020-2027(USD MILLION)
  168. REST OF LATIN AMERICA: SCALE INHIBITORS MARKET, BY TYPE,
  169. REST OF LATIN AMERICA: SCALE INHIBITORS MARKET,
    1. BY APPLICATION, 2020-2027(USD MILLION) 111
  170. REST OF LATIN AMERICA:
  171. SCALE INHIBITORS MARKET, BY APPLICATION, 2020-2027(KT) 111
  172. MIDDLE
  173. EAST & AFRICA: SCALE INHIBITORS MARKET, BY COUNTRY, 2020-2027(USD MILLION) 112
    1. TABLE
  174. MIDDLE EAST & AFRICA: SCALE INHIBITORS MARKET, BY COUNTRY, 2020-2027(KT)
  175. MIDDLE EAST & AFRICA: SCALE INHIBITORS MARKET, BY TYPE,
  176. MIDDLE EAST & AFRICA: SCALE INHIBITORS
  177. MARKET, BY TYPE, 2020-2027(KT) 113
  178. MIDDLE EAST & AFRICA:
  179. SCALE INHIBITORS MARKET, BY APPLICATION, 2020-2027(USD MILLION) 114
    1. TABLE
  180. MIDDLE EAST & AFRICA: SCALE INHIBITORS MARKET, BY APPLICATION, 2020-2027(KT)
  181. TURKEY: SCALE INHIBITORS MARKET, BY TYPE, 2020-2027(USD
    1. MILLION) 115
  182. TURKEY: SCALE INHIBITORS MARKET, BY TYPE, 2020-2027(KT)
  183. TURKEY: SCALE INHIBITORS MARKET, BY APPLICATION, 2020-2027(USD
    1. MILLION) 116
  184. TURKEY: SCALE INHIBITORS MARKET, BY APPLICATION,
  185. SAUDI ARABIA: SCALE INHIBITORS MARKET, BY
    1. TYPE, 2020-2027(USD MILLION) 117
  186. SAUDI ARABIA: SCALE INHIBITORS
  187. MARKET, BY TYPE, 2020-2027(KT) 117
  188. SAUDI ARABIA: SCALE INHIBITORS
  189. MARKET, BY APPLICATION, 2020-2027(USD MILLION) 118
  190. SAUDI ARABIA:
  191. SCALE INHIBITORS MARKET, BY APPLICATION, 2020-2027(KT) 118
  192. UAE:
  193. SCALE INHIBITORS MARKET, BY TYPE, 2020-2027(USD MILLION) 119
    1. TABLE 151
  194. UAE: SCALE INHIBITORS MARKET, BY TYPE, 2020-2027(KT) 119
  195. UAE:
  196. SCALE INHIBITORS MARKET, BY APPLICATION, 2020-2027(USD MILLION) 120
    1. TABLE
  197. UAE: SCALE INHIBITORS MARKET, BY APPLICATION, 2020-2027(KT) 120
    1. TABLE
  198. NORTH AFRICA: SCALE INHIBITORS MARKET, BY TYPE, 2020-2027(USD MILLION) 121
    1. TABLE
  199. NORTH AFRICA: SCALE INHIBITORS MARKET, BY TYPE, 2020-2027(KT) 121
    1. TABLE
  200. NORTH AFRICA: SCALE INHIBITORS MARKET, BY APPLICATION, 2020-2027(USD MILLION)
  201. NORTH AFRICA: SCALE INHIBITORS MARKET, BY APPLICATION, 2020-2027(KT)
  202. REST OF THE MIDDLE EAST & AFRICA: SCALE INHIBITORS MARKET,
    1. BY TYPE, 2020-2027(USD MILLION) 123
  203. REST OF THE MIDDLE EAST
  204. & AFRICA: SCALE INHIBITORS MARKET, BY TYPE, 2020-2027(KT) 123
    1. TABLE
  205. REST OF THE MIDDLE EAST & AFRICA: SCALE INHIBITORS MARKET, BY APPLICATION,
  206. REST OF THE MIDDLE EAST & AFRICA:
  207. SCALE INHIBITORS MARKET, BY APPLICATION, 2020-2027(KT) 124
    1. List of Figures
  208. GLOBAL SCALE INHIBITORS MARKET: MARKET STRUCTURE
  209. NORTH AMERICA: MARKET SIZE & MARKET SHARE, BY COUNTRY
    1. (2020) 21
  210. EUROPE: MARKET SIZE & MARKET SHARE, BY COUNTRY
    1. (2020) 21
  211. ASIA-PACIFIC: MARKET SIZE & MARKET SHARE, BY COUNTRY
    1. (2020) 22
  212. LATIN AMERICA: MARKET SIZE & MARKET SHARE, BY COUNTRY
    1. (2020) 22
  213. MIDDLE EAST & AFRICA: MARKET SIZE & MARKET
    1. SHARE, BY COUNTRY (2020) 23
  214. RESEARCH PROCESS OF MRFR 25
    1. FIGURE
  215. TOP-DOWN AND BOTTOM-UP APPROACH 28
  216. MARKET DYNAMICS OVERVIEW
  217. DRIVERS IMPACT ANALYSIS 31
  218. RESTRAINTS
    1. IMPACT ANALYSIS 33
  219. SUPPLY CHAIN ANALYSIS 36
    1. FIGURE
  220. PORTER’S FIVE FORCES ANALYSIS OF THE GLOBAL SCALE INHIBITORS MARKET 37
    1. FIGURE
  221. GLOBAL SCALE INHIBITORS MARKET, BY TYPE, 2020-2027(USD MILLION) 40
    1. FIGURE
  222. GLOBAL SCALE INHIBITORS MARKET, BY TYPE, 2020-2027(KT) 41
    1. FIGURE 16
  223. GLOBAL SCALE INHIBITORS MARKET, BY APPLICATION, 2020-2027(USD MILLION) 47
    1. FIGURE
  224. GLOBAL SCALE INHIBITORS MARKET, BY APPLICATION, 2020-2027(KT) 48
    1. FIGURE
  225. GLOBAL SCALE INHIBITORS MARKET BY REGION, 2020-2027(USD MILLION) 56
    1. FIGURE
  226. GLOBAL SCALE INHIBITORS MARKET BY REGION, 2020-2027(KT) 57
    1. FIGURE 20
    2. GLOBAL SCALE INHIBITORS MARKET: REGIONAL SHARE, 2020, AND CAGR, 2020-2027(%) 150

Scale Inhibitors Market Segmentation

Market Segmentation Overview

  • Detailed segmentation data will be available in the full report
  • Comprehensive analysis by multiple parameters
  • Regional and country-level breakdowns
  • Market size forecasts by segment
Infographic

Free Sample Request

Kindly complete the form below to receive a free sample of this Report

Get Free Sample

Customer Strories

“I am very pleased with how market segments have been defined in a relevant way for my purposes (such as "Portable Freezers & refrigerators" and "last-mile"). In general the report is well structured. Thanks very much for your efforts.”

Victoria Milne

Founder

Compare Licence

×
Features License Type
Single User Multiuser License Enterprise User
Price $4,950 $5,950 $7,250
Maximum User Access Limit 1 User Upto 10 Users Unrestricted Access Throughout the Organization
Free Customization
Direct Access to Analyst
Deliverable Format
Platform Access
Discount on Next Purchase 10% 15% 15%
Printable Versions