×
Hero Background
English
Chinese
French
Japanese
Korean
German
Spanish

Silver Nitrate Market Analysis

ID: MRFR/CnM/17322-CR
161 Pages
Anshula Mandaokar
July 2025

Silver Nitrate Market Research Report Information by Grade Type (Analytical Reagent Grade (ARG), Active Pharmaceutical Ingredient (API) Grade, Photographic Grade, Others), by Application (Photography & Jewellery, Medicine & Healthcare, Glass Coating, Textile, Others) and Region (North America, Europe, Asia-Pacific, Middle East & Africa, South America) - Forecast till 2035

Share:
Download PDF ×

We do not share your information with anyone. However, we may send you emails based on your report interest from time to time. You may contact us at any time to opt-out.

Silver Nitrate Market Infographic
Purchase Options

Market Analysis

In-depth Analysis of Silver Nitrate Market Industry Landscape

The silver nitrate market exhibits dynamic characteristics driven by a combination of factors influencing both its supply and demand. Silver nitrate, a chemical compound consisting of silver and nitrate ions, finds applications in various industries, including photography, healthcare, electronics, and chemical synthesis. The dynamics of this market are shaped by factors such as technological advancements, regulatory policies, economic conditions, and changing consumer preferences.

Technological advancements play a crucial role in shaping the dynamics of the silver nitrate market. Continuous innovation in manufacturing processes, purification techniques, and product formulations has led to the development of high-purity silver nitrate products with enhanced performance characteristics. These advancements enable manufacturers to produce silver nitrate solutions and powders with precise specifications and consistent quality, meeting the demanding requirements of diverse applications. Moreover, advancements in silver recovery and recycling technologies contribute to the sustainability of the silver nitrate industry by reducing waste and environmental impact.

Regulatory policies and standards influence the dynamics of the silver nitrate market, particularly in industries such as healthcare and electronics. Silver nitrate is commonly used in medical applications, including wound care, eye treatments, and topical antiseptics, where it exhibits antimicrobial properties. Regulatory agencies impose stringent requirements for product safety, efficacy, and quality control to ensure the safe and effective use of silver nitrate-based products in healthcare settings. Similarly, regulations governing the use of silver in electronic components, such as conductive inks and coatings, aim to minimize environmental contamination and protect consumer health.

Economic conditions and market trends impact both supply and demand dynamics in the silver nitrate market. Fluctuations in silver prices, currency exchange rates, and industrial output can affect the cost of production and distribution of silver nitrate products, influencing market competitiveness and profitability. Moreover, changes in consumer preferences and purchasing behavior, such as increased demand for eco-friendly and sustainable products, drive innovation and market differentiation within the silver nitrate industry.

Market dynamics in the silver nitrate industry are also influenced by global supply chain disruptions and geopolitical tensions. Silver is a globally traded commodity, and disruptions in mining operations, trade tariffs, or export restrictions can impact the availability and cost of silver nitrate raw materials. Additionally, geopolitical tensions and trade disputes between major silver-producing countries can create market uncertainty and affect supply chain dynamics within the silver nitrate industry.

Consumer preferences and trends play a role in shaping the dynamics of the silver nitrate market, particularly in industries such as photography and personal care. Silver nitrate is commonly used in photographic films, papers, and printing plates, where it serves as a light-sensitive agent for image development. As digital photography continues to dominate the market, the demand for traditional silver-based photographic materials may decline, impacting the overall demand for silver nitrate in the photography industry. Similarly, changing consumer preferences for natural and eco-friendly skincare products drive demand for silver nitrate-based topical treatments and cosmetics.

Author
Anshula Mandaokar
Team Lead - Research

Anshula Mandaokar holds an academic degree in Chemical Engineering and has been contributing to the field for more than 5 years. She has expertise in Market Research and Business Consulting and serves as a Team Lead for a reputed Market Research firm under the Chemicals and Materials domain spectrum. She has worked on multiple projects, generating explicit results in a quick turnaround time. Her understanding of data interpretation justifies her role as a leader.

Leave a Comment

FAQs

What is the current valuation of the Silver Nitrate Market?

The Silver Nitrate Market was valued at 6.225 USD Billion in 2024.

What is the projected market size for Silver Nitrate by 2035?

The market is projected to reach 11.22 USD Billion by 2035.

What is the expected CAGR for the Silver Nitrate Market during the forecast period?

The expected CAGR for the Silver Nitrate Market from 2025 to 2035 is 5.5%.

Which companies are considered key players in the Silver Nitrate Market?

Key players include Sodium Nitrate Company, Fisher Scientific, GFS Chemicals, and Merck KGaA.

Market Summary

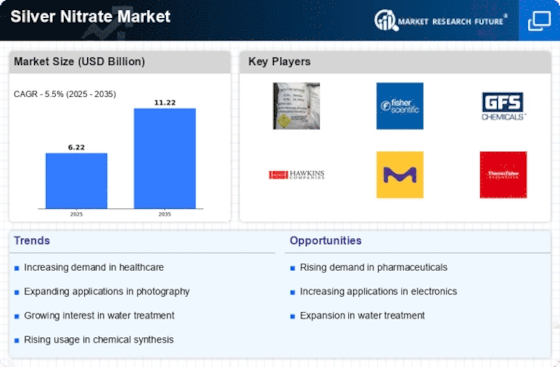
As per MRFR analysis, the Silver Nitrate Market Size was estimated at 6.225 USD Billion in 2024. The Silver Nitrate industry is projected to grow from 6.567 USD Billion in 2025 to 11.22 USD Billion by 2035, exhibiting a compound annual growth rate (CAGR) of 5.5 during the forecast period 2025 - 2035.

Key Market Trends & Highlights

The Silver Nitrate Market is experiencing robust growth driven by diverse applications and technological advancements.

  • North America remains the largest market for silver nitrate, primarily due to its extensive use in healthcare and photography.
  • The Asia-Pacific region is the fastest-growing market, fueled by increasing industrial applications and rising demand in pharmaceuticals.
  • The Analytical Reagent Grade segment dominates the market, while the Active Pharmaceutical Ingredient Grade segment is witnessing rapid growth.
  • Key market drivers include the rising applications in water treatment and the expansion in the pharmaceutical sector.

Market Size & Forecast

2024 Market Size 6.225 (USD Billion)
2035 Market Size 11.22 (USD Billion)
CAGR (2025 - 2035) 5.5%
Largest Regional Market Share in 2024 North America

Major Players

<p>Sodium Nitrate Company (US), Fisher Scientific (US), GFS Chemicals (US), Hawkins Inc. (US), Merck KGaA (DE), Thermo Fisher Scientific (US), Alfa Aesar (US), Acros Organics (US)</p>

Market Trends

The Silver Nitrate Market is currently experiencing a dynamic phase characterized by evolving applications and increasing demand across various sectors. This compound, known for its antiseptic properties, is widely utilized in the medical field, particularly in wound care and surgical procedures. Additionally, its role in photography and chemical synthesis further enhances its relevance in industrial applications. As industries seek innovative solutions, the market appears poised for growth, driven by advancements in technology and expanding use cases. Moreover, the Silver Nitrate Market is influenced by regulatory frameworks and environmental considerations. The compound's production and usage are subject to scrutiny, prompting manufacturers to adopt sustainable practices. This shift towards eco-friendly alternatives may reshape market dynamics, as stakeholders prioritize compliance and sustainability. The interplay between demand, regulatory pressures, and technological advancements suggests a complex landscape for the Silver Nitrate Market, where adaptability and innovation will be crucial for success.

Rising Demand in Healthcare

The healthcare sector is witnessing an uptick in the utilization of silver nitrate due to its effective antimicrobial properties. This trend is likely to continue as medical professionals increasingly recognize the benefits of silver-based compounds in treating infections and promoting wound healing.

Technological Advancements

Innovations in production techniques and applications are shaping the Silver Nitrate Market. Enhanced manufacturing processes may lead to improved purity and efficiency, thereby expanding the compound's applicability in various industries, including electronics and pharmaceuticals.

Sustainability Initiatives

There is a growing emphasis on sustainable practices within the Silver Nitrate Market. Manufacturers are exploring eco-friendly alternatives and methods to reduce environmental impact, which could influence product development and market strategies in the coming years.

Silver Nitrate Market Market Drivers

Growth in Pharmaceutical Sector

The Silver Nitrate Market is significantly influenced by the growth of the pharmaceutical sector. Silver nitrate is utilized in various medical applications, including wound care and as an antiseptic. The increasing prevalence of chronic wounds and infections is driving the demand for silver-based products in healthcare. Recent market analysis suggests that The Silver Nitrate Market is projected to exceed USD 20 billion by 2025, with silver nitrate being a key component in advanced wound dressings. This trend indicates a robust potential for silver nitrate in the pharmaceutical industry, as healthcare providers seek effective solutions for infection control and wound management. The expansion of the pharmaceutical sector is likely to further propel the Silver Nitrate Market.

Expansion in Chemical Manufacturing

The Silver Nitrate Market is poised for growth as the chemical manufacturing sector expands. Silver nitrate serves as a precursor in the synthesis of various chemical compounds, including catalysts and reagents. The increasing demand for specialty chemicals across industries such as pharmaceuticals, electronics, and agriculture is likely to drive the consumption of silver nitrate. Recent data indicates that the specialty chemicals market is projected to grow at a compound annual growth rate of 6% over the next five years. This growth trajectory suggests a corresponding increase in the demand for silver nitrate, as manufacturers seek high-purity chemicals for their processes. Consequently, the expansion of chemical manufacturing is expected to bolster the Silver Nitrate Market significantly.

Rising Applications in Water Treatment

The Silver Nitrate Market is witnessing a growing interest in water treatment applications. Silver nitrate is recognized for its antimicrobial properties, making it an effective agent in purifying water and preventing bacterial growth. As concerns over water quality and safety escalate, the adoption of silver nitrate in water treatment processes is likely to increase. Recent studies indicate that The Silver Nitrate Market is expected to reach USD 50 billion by 2026, with silver nitrate playing a pivotal role in this growth. The ability of silver nitrate to provide a sustainable solution for water purification aligns with the increasing emphasis on environmental safety, thereby enhancing its relevance in the Silver Nitrate Market.

Increasing Use in Photographic Applications

The Silver Nitrate Market experiences a notable surge in demand due to its essential role in photographic applications. Historically, silver nitrate has been a critical component in traditional photography, particularly in the production of black and white films. As the market evolves, there is a resurgence in interest in analog photography, driven by artistic trends and nostalgia. This trend appears to be fostering a niche market for silver nitrate, with estimates suggesting that the demand for photographic chemicals, including silver nitrate, could grow by approximately 5% annually. The unique properties of silver nitrate, such as its light sensitivity, continue to make it a preferred choice among photographers, thereby reinforcing its significance in the Silver Nitrate Market.

Emerging Trends in Electronics Manufacturing

The Silver Nitrate Market is experiencing a shift due to emerging trends in electronics manufacturing. Silver nitrate is increasingly being used in the production of conductive inks and pastes, which are essential for printed electronics and flexible circuits. As the demand for electronic devices continues to rise, particularly in the realms of wearable technology and IoT devices, the need for high-performance conductive materials is becoming paramount. Market forecasts suggest that the printed electronics market could reach USD 50 billion by 2027, indicating a substantial opportunity for silver nitrate. This trend underscores the importance of silver nitrate in the electronics sector, thereby enhancing its position within the Silver Nitrate Market.

Market Segment Insights

Silver Nitrate Market

Based on Grade Type, this segment includes Analytical Reagent Grade (ARG), Active Pharmaceutical Ingredient (API) Grade, Photographic Grade, Others. The Photographic Grade segment dominated the global market in 2024, while the others segment is projected to be the fastest–growing segment during the forecast period. Photographic grade silver nitrate is primarily used in producing light-sensitive materials for traditional film photography and medical imaging. 

This grade is essential in photography and jewelry, as it is the main component in black-and-white film development, X-ray films, fine art photography, holography, and security printing. In the medicine and healthcare sector, photographic-grade silver nitrate plays a crucial role in medical imaging, particularly in the production of X-ray films for diagnostic applications. Its glass coating application involves the manufacturing of specialized optical coatings for photographic and imaging lenses. Although its presence in the textile industry is minimal, it can be used in coatings for high-end reflective or photographic fabric applications.

FIGURE 2: SILVER NITRATE MARKET SHARE BY GRADE TYPE 2024 AND 2035 (USD BILLION)

Source: Secondary Research, Primary Research, MRFR Database and Analyst Review

Silver Nitrate Market

Based on Application, this segment includes Photography & Jewellery, Medicine & Healthcare, Glass Coating, Textile, Others. The Medicine & Healthcare segment dominated the global market in 2024, while the others segment is projected to be the fastest–growing segment during the forecast period. Silver nitrate, particularly API-grade and analytical reagent-grade, plays a crucial role in the medicine and healthcare industry due to its powerful antimicrobial, cauterizing, and diagnostic properties. Its application spans across pharmaceuticals, dermatology, ophthalmology, wound care, and medical imaging. 

One of the most common uses of API-grade silver nitrate is wound care and dermatology. It is widely used as a cauterizing agent for minor injuries, burns, and chronic ulcers. Silver nitrate sticks are frequently used in medical settings for removing warts and treating skin infections. In ophthalmology, silver nitrate solutions have been historically used in newborn eye drops to prevent bacterial infections such as neonatal conjunctivitis. With growing concerns about antibiotic resistance, the demand for silver-based antimicrobial agents is increasing, further driving the need for silver nitrate in pharmaceutical and medical applications.

Get more detailed insights about Silver Nitrate Market Research Report – Forecast Till 2035

Regional Insights

North America : Market Leader in Silver Nitrate Market

North America is the largest market for silver nitrate, accounting for approximately 40% of the global share. The region's growth is driven by increasing demand in the healthcare sector, particularly in wound care and diagnostics. Regulatory support, including FDA approvals for new applications, further catalyzes market expansion. The presence of key players and advanced manufacturing capabilities also contribute to this robust growth. The United States dominates the North American market, with significant contributions from Canada. Major companies like Thermo Fisher Scientific and GFS Chemicals are pivotal in driving innovation and meeting the rising demand. The competitive landscape is characterized by a mix of established firms and emerging players, ensuring a dynamic market environment. The focus on research and development is expected to enhance product offerings and market reach.

Europe : Regulatory Framework and Growth

Europe is the second-largest market for silver nitrate, holding around 30% of the global share. The region's growth is propelled by increasing applications in pharmaceuticals and agriculture, alongside stringent regulations that ensure product safety and efficacy. The European Medicines Agency (EMA) plays a crucial role in regulating the use of silver nitrate, which supports its market growth and innovation. Germany and the United Kingdom are the leading countries in this market, with a strong presence of key players like Merck KGaA and Acros Organics. The competitive landscape is marked by collaborations and partnerships aimed at enhancing product development. The focus on sustainable practices and eco-friendly products is also gaining traction, influencing market dynamics and consumer preferences.

Asia-Pacific : Rapid Growth and Demand

Asia-Pacific is witnessing rapid growth in the silver nitrate market, accounting for approximately 20% of the global share. The increasing demand for silver nitrate in electronics, photography, and healthcare sectors is a significant driver. Countries like China and India are experiencing a surge in industrial activities, which is expected to boost market growth. Additionally, favorable government policies and investments in healthcare infrastructure are further propelling demand. China is the largest market in the region, followed by India and Japan. The competitive landscape features both local and international players, with companies like Alfa Aesar and Hawkins Inc. expanding their footprint. The focus on innovation and product diversification is crucial for companies to maintain a competitive edge in this rapidly evolving market.

Middle East and Africa : Emerging Market Potential

The Middle East and Africa region is gradually emerging as a potential market for silver nitrate, holding about 10% of the global share. The growth is primarily driven by increasing industrial applications, particularly in water treatment and agriculture. The region's diverse economic landscape and investments in infrastructure are expected to enhance market opportunities. Regulatory frameworks are evolving, which may further support market growth in the coming years. South Africa and the UAE are the leading countries in this market, with a growing presence of key players. The competitive landscape is characterized by a mix of local manufacturers and international companies looking to expand their operations. The focus on sustainable practices and compliance with international standards is becoming increasingly important for market players in this region.

Key Players and Competitive Insights

Many global, regional, and local vendors characterize the Silver Nitrate Market. The market is highly competitive, with all the players competing to gain market share. Intense competition, rapid advances in technology, frequent changes in government policies, and environmental regulations are key factors that confront market growth. The vendors compete based on cost, product quality, reliability, and government regulations. Vendors must provide cost-efficient, high-quality products to survive and succeed in an intensely competitive market.

The major competitors in the market are American Elements, Avantor, Merck, Ames Goldsmith Corporation, Columbus Chemical Industries (CCI), GFS Chemicals, Spectrum Chemical Manufacturing Corp, Rochester Silver Works LLC, Forbes Pharmaceuticals, Thermo Fisher Scientific are among others. The Silver Nitrate Market is a consolidated market due to increasing competition, acquisitions, mergers and other strategic market developments and decisions to improve operational effectiveness.

Key Companies in the Silver Nitrate Market market include

Industry Developments

Future Outlook

Silver Nitrate Market Future Outlook

<p>The Silver Nitrate Market is projected to grow at a 5.5% CAGR from 2024 to 2035, driven by increasing demand in pharmaceuticals, electronics, and water treatment.</p>

New opportunities lie in:

  • <p>Expansion into emerging markets with tailored product offerings.</p>
  • <p>Development of eco-friendly silver nitrate production methods.</p>
  • <p>Investment in advanced applications for medical and industrial uses.</p>

<p>By 2035, the Silver Nitrate Market is expected to solidify its position as a key player in various industries.</p>

Market Segmentation

Silver Nitrate Market Grade Type Outlook

  • Analytical Reagent Grade (ARG)
  • Active Pharmaceutical Ingredient (API) Grade
  • Photographic Grade
  • Others

Silver Nitrate Market Application Outlook

  • Photography & Jewellery
  • Medicine & Healthcare
  • Glass Coating
  • Textile
  • Others

Report Scope

MARKET SIZE 20246.225(USD Billion)
MARKET SIZE 20256.567(USD Billion)
MARKET SIZE 203511.22(USD Billion)
COMPOUND ANNUAL GROWTH RATE (CAGR)5.5% (2024 - 2035)
REPORT COVERAGERevenue Forecast, Competitive Landscape, Growth Factors, and Trends
BASE YEAR2024
Market Forecast Period2025 - 2035
Historical Data2019 - 2024
Market Forecast UnitsUSD Billion
Key Companies ProfiledMarket analysis in progress
Segments CoveredMarket segmentation analysis in progress
Key Market OpportunitiesGrowing demand for Silver Nitrate in pharmaceuticals and water treatment applications presents significant market opportunities.
Key Market DynamicsRising demand for silver nitrate in pharmaceuticals drives innovation and competitive dynamics in the market.
Countries CoveredNorth America, Europe, APAC, South America, MEA

FAQs

What is the current valuation of the Silver Nitrate Market?

The Silver Nitrate Market was valued at 6.225 USD Billion in 2024.

What is the projected market size for Silver Nitrate by 2035?

The market is projected to reach 11.22 USD Billion by 2035.

What is the expected CAGR for the Silver Nitrate Market during the forecast period?

The expected CAGR for the Silver Nitrate Market from 2025 to 2035 is 5.5%.

Which companies are considered key players in the Silver Nitrate Market?

Key players include Sodium Nitrate Company, Fisher Scientific, GFS Chemicals, and Merck KGaA.

  1. SECTION I: EXECUTIVE SUMMARY AND KEY HIGHLIGHTS
    1. EXECUTIVE SUMMARY
      1. Market Overview
      2. Key Findings
      3. Market Segmentation
      4. Competitive Landscape
      5. Challenges and Opportunities
      6. Future Outlook
  2. SECTION II: SCOPING, METHODOLOGY AND MARKET STRUCTURE
    1. MARKET INTRODUCTION
      1. Definition
      2. Scope of the study
    2. RESEARCH METHODOLOGY
      1. Overview
      2. Data Mining
      3. Secondary Research
      4. Primary Research
      5. Forecasting Model
      6. Market Size Estimation
      7. Data Triangulation
      8. Validation
  3. SECTION III: QUALITATIVE ANALYSIS
    1. MARKET DYNAMICS
      1. Overview
      2. Drivers
      3. Restraints
      4. Opportunities
    2. MARKET FACTOR ANALYSIS
      1. Value chain Analysis
      2. Porter's Five Forces Analysis
      3. COVID-19 Impact Analysis
  4. SECTION IV: QUANTITATIVE ANALYSIS
    1. Chemicals and Materials, BY Grade Type (USD Billion)
      1. Analytical Reagent Grade (ARG)
      2. Active Pharmaceutical Ingredient (API) Grade
      3. Photographic Grade
      4. Others
    2. Chemicals and Materials, BY Application (USD Billion)
      1. Photography & Jewellery
      2. Medicine & Healthcare
      3. Glass Coating
      4. Textile
      5. Others
    3. Chemicals and Materials, BY Region (USD Billion)
      1. North America
      2. Europe
      3. APAC
      4. South America
      5. MEA
  5. SECTION V: COMPETITIVE ANALYSIS
    1. Competitive Landscape
      1. Overview
      2. Competitive Analysis
      3. Market share Analysis
      4. Major Growth Strategy in the Chemicals and Materials
      5. Competitive Benchmarking
      6. Leading Players in Terms of Number of Developments in the Chemicals and Materials
      7. Key developments and growth strategies
      8. Major Players Financial Matrix
    2. Company Profiles
      1. Sodium Nitrate Company (US)
      2. Fisher Scientific (US)
      3. GFS Chemicals (US)
      4. Hawkins Inc. (US)
      5. Merck KGaA (DE)
      6. Thermo Fisher Scientific (US)
      7. Alfa Aesar (US)
      8. Acros Organics (US)
    3. Appendix
      1. References
      2. Related Reports
  6. LIST OF FIGURES
    1. MARKET SYNOPSIS
    2. NORTH AMERICA MARKET ANALYSIS
    3. US MARKET ANALYSIS BY GRADE TYPE
    4. US MARKET ANALYSIS BY APPLICATION
    5. CANADA MARKET ANALYSIS BY GRADE TYPE
    6. CANADA MARKET ANALYSIS BY APPLICATION
    7. EUROPE MARKET ANALYSIS
    8. GERMANY MARKET ANALYSIS BY GRADE TYPE
    9. GERMANY MARKET ANALYSIS BY APPLICATION
    10. UK MARKET ANALYSIS BY GRADE TYPE
    11. UK MARKET ANALYSIS BY APPLICATION
    12. FRANCE MARKET ANALYSIS BY GRADE TYPE
    13. FRANCE MARKET ANALYSIS BY APPLICATION
    14. RUSSIA MARKET ANALYSIS BY GRADE TYPE
    15. RUSSIA MARKET ANALYSIS BY APPLICATION
    16. ITALY MARKET ANALYSIS BY GRADE TYPE
    17. ITALY MARKET ANALYSIS BY APPLICATION
    18. SPAIN MARKET ANALYSIS BY GRADE TYPE
    19. SPAIN MARKET ANALYSIS BY APPLICATION
    20. REST OF EUROPE MARKET ANALYSIS BY GRADE TYPE
    21. REST OF EUROPE MARKET ANALYSIS BY APPLICATION
    22. APAC MARKET ANALYSIS
    23. CHINA MARKET ANALYSIS BY GRADE TYPE
    24. CHINA MARKET ANALYSIS BY APPLICATION
    25. INDIA MARKET ANALYSIS BY GRADE TYPE
    26. INDIA MARKET ANALYSIS BY APPLICATION
    27. JAPAN MARKET ANALYSIS BY GRADE TYPE
    28. JAPAN MARKET ANALYSIS BY APPLICATION
    29. SOUTH KOREA MARKET ANALYSIS BY GRADE TYPE
    30. SOUTH KOREA MARKET ANALYSIS BY APPLICATION
    31. MALAYSIA MARKET ANALYSIS BY GRADE TYPE
    32. MALAYSIA MARKET ANALYSIS BY APPLICATION
    33. THAILAND MARKET ANALYSIS BY GRADE TYPE
    34. THAILAND MARKET ANALYSIS BY APPLICATION
    35. INDONESIA MARKET ANALYSIS BY GRADE TYPE
    36. INDONESIA MARKET ANALYSIS BY APPLICATION
    37. REST OF APAC MARKET ANALYSIS BY GRADE TYPE
    38. REST OF APAC MARKET ANALYSIS BY APPLICATION
    39. SOUTH AMERICA MARKET ANALYSIS
    40. BRAZIL MARKET ANALYSIS BY GRADE TYPE
    41. BRAZIL MARKET ANALYSIS BY APPLICATION
    42. MEXICO MARKET ANALYSIS BY GRADE TYPE
    43. MEXICO MARKET ANALYSIS BY APPLICATION
    44. ARGENTINA MARKET ANALYSIS BY GRADE TYPE
    45. ARGENTINA MARKET ANALYSIS BY APPLICATION
    46. REST OF SOUTH AMERICA MARKET ANALYSIS BY GRADE TYPE
    47. REST OF SOUTH AMERICA MARKET ANALYSIS BY APPLICATION
    48. MEA MARKET ANALYSIS
    49. GCC COUNTRIES MARKET ANALYSIS BY GRADE TYPE
    50. GCC COUNTRIES MARKET ANALYSIS BY APPLICATION
    51. SOUTH AFRICA MARKET ANALYSIS BY GRADE TYPE
    52. SOUTH AFRICA MARKET ANALYSIS BY APPLICATION
    53. REST OF MEA MARKET ANALYSIS BY GRADE TYPE
    54. REST OF MEA MARKET ANALYSIS BY APPLICATION
    55. KEY BUYING CRITERIA OF CHEMICALS AND MATERIALS
    56. RESEARCH PROCESS OF MRFR
    57. DRO ANALYSIS OF CHEMICALS AND MATERIALS
    58. DRIVERS IMPACT ANALYSIS: CHEMICALS AND MATERIALS
    59. RESTRAINTS IMPACT ANALYSIS: CHEMICALS AND MATERIALS
    60. SUPPLY / VALUE CHAIN: CHEMICALS AND MATERIALS
    61. CHEMICALS AND MATERIALS, BY GRADE TYPE, 2024 (% SHARE)
    62. CHEMICALS AND MATERIALS, BY GRADE TYPE, 2024 TO 2035 (USD Billion)
    63. CHEMICALS AND MATERIALS, BY APPLICATION, 2024 (% SHARE)
    64. CHEMICALS AND MATERIALS, BY APPLICATION, 2024 TO 2035 (USD Billion)
    65. BENCHMARKING OF MAJOR COMPETITORS
  7. LIST OF TABLES
    1. LIST OF ASSUMPTIONS
    2. North America MARKET SIZE ESTIMATES; FORECAST
      1. BY GRADE TYPE, 2025-2035 (USD Billion)
      2. BY APPLICATION, 2025-2035 (USD Billion)
    3. US MARKET SIZE ESTIMATES; FORECAST
      1. BY GRADE TYPE, 2025-2035 (USD Billion)
      2. BY APPLICATION, 2025-2035 (USD Billion)
    4. Canada MARKET SIZE ESTIMATES; FORECAST
      1. BY GRADE TYPE, 2025-2035 (USD Billion)
      2. BY APPLICATION, 2025-2035 (USD Billion)
    5. Europe MARKET SIZE ESTIMATES; FORECAST
      1. BY GRADE TYPE, 2025-2035 (USD Billion)
      2. BY APPLICATION, 2025-2035 (USD Billion)
    6. Germany MARKET SIZE ESTIMATES; FORECAST
      1. BY GRADE TYPE, 2025-2035 (USD Billion)
      2. BY APPLICATION, 2025-2035 (USD Billion)
    7. UK MARKET SIZE ESTIMATES; FORECAST
      1. BY GRADE TYPE, 2025-2035 (USD Billion)
      2. BY APPLICATION, 2025-2035 (USD Billion)
    8. France MARKET SIZE ESTIMATES; FORECAST
      1. BY GRADE TYPE, 2025-2035 (USD Billion)
      2. BY APPLICATION, 2025-2035 (USD Billion)
    9. Russia MARKET SIZE ESTIMATES; FORECAST
      1. BY GRADE TYPE, 2025-2035 (USD Billion)
      2. BY APPLICATION, 2025-2035 (USD Billion)
    10. Italy MARKET SIZE ESTIMATES; FORECAST
      1. BY GRADE TYPE, 2025-2035 (USD Billion)
      2. BY APPLICATION, 2025-2035 (USD Billion)
    11. Spain MARKET SIZE ESTIMATES; FORECAST
      1. BY GRADE TYPE, 2025-2035 (USD Billion)
      2. BY APPLICATION, 2025-2035 (USD Billion)
    12. Rest of Europe MARKET SIZE ESTIMATES; FORECAST
      1. BY GRADE TYPE, 2025-2035 (USD Billion)
      2. BY APPLICATION, 2025-2035 (USD Billion)
    13. APAC MARKET SIZE ESTIMATES; FORECAST
      1. BY GRADE TYPE, 2025-2035 (USD Billion)
      2. BY APPLICATION, 2025-2035 (USD Billion)
    14. China MARKET SIZE ESTIMATES; FORECAST
      1. BY GRADE TYPE, 2025-2035 (USD Billion)
      2. BY APPLICATION, 2025-2035 (USD Billion)
    15. India MARKET SIZE ESTIMATES; FORECAST
      1. BY GRADE TYPE, 2025-2035 (USD Billion)
      2. BY APPLICATION, 2025-2035 (USD Billion)
    16. Japan MARKET SIZE ESTIMATES; FORECAST
      1. BY GRADE TYPE, 2025-2035 (USD Billion)
      2. BY APPLICATION, 2025-2035 (USD Billion)
    17. South Korea MARKET SIZE ESTIMATES; FORECAST
      1. BY GRADE TYPE, 2025-2035 (USD Billion)
      2. BY APPLICATION, 2025-2035 (USD Billion)
    18. Malaysia MARKET SIZE ESTIMATES; FORECAST
      1. BY GRADE TYPE, 2025-2035 (USD Billion)
      2. BY APPLICATION, 2025-2035 (USD Billion)
    19. Thailand MARKET SIZE ESTIMATES; FORECAST
      1. BY GRADE TYPE, 2025-2035 (USD Billion)
      2. BY APPLICATION, 2025-2035 (USD Billion)
    20. Indonesia MARKET SIZE ESTIMATES; FORECAST
      1. BY GRADE TYPE, 2025-2035 (USD Billion)
      2. BY APPLICATION, 2025-2035 (USD Billion)
    21. Rest of APAC MARKET SIZE ESTIMATES; FORECAST
      1. BY GRADE TYPE, 2025-2035 (USD Billion)
      2. BY APPLICATION, 2025-2035 (USD Billion)
    22. South America MARKET SIZE ESTIMATES; FORECAST
      1. BY GRADE TYPE, 2025-2035 (USD Billion)
      2. BY APPLICATION, 2025-2035 (USD Billion)
    23. Brazil MARKET SIZE ESTIMATES; FORECAST
      1. BY GRADE TYPE, 2025-2035 (USD Billion)
      2. BY APPLICATION, 2025-2035 (USD Billion)
    24. Mexico MARKET SIZE ESTIMATES; FORECAST
      1. BY GRADE TYPE, 2025-2035 (USD Billion)
      2. BY APPLICATION, 2025-2035 (USD Billion)
    25. Argentina MARKET SIZE ESTIMATES; FORECAST
      1. BY GRADE TYPE, 2025-2035 (USD Billion)
      2. BY APPLICATION, 2025-2035 (USD Billion)
    26. Rest of South America MARKET SIZE ESTIMATES; FORECAST
      1. BY GRADE TYPE, 2025-2035 (USD Billion)
      2. BY APPLICATION, 2025-2035 (USD Billion)
    27. MEA MARKET SIZE ESTIMATES; FORECAST
      1. BY GRADE TYPE, 2025-2035 (USD Billion)
      2. BY APPLICATION, 2025-2035 (USD Billion)
    28. GCC Countries MARKET SIZE ESTIMATES; FORECAST
      1. BY GRADE TYPE, 2025-2035 (USD Billion)
      2. BY APPLICATION, 2025-2035 (USD Billion)
    29. South Africa MARKET SIZE ESTIMATES; FORECAST
      1. BY GRADE TYPE, 2025-2035 (USD Billion)
      2. BY APPLICATION, 2025-2035 (USD Billion)
    30. Rest of MEA MARKET SIZE ESTIMATES; FORECAST
      1. BY GRADE TYPE, 2025-2035 (USD Billion)
      2. BY APPLICATION, 2025-2035 (USD Billion)
    31. PRODUCT LAUNCH/PRODUCT DEVELOPMENT/APPROVAL
    32. ACQUISITION/PARTNERSHIP

Global Outlook (USD Billion,Tons,2019-2035)


Global Silver Nitrate, By Grade Type (USD Billion,Tons,2019-2035)

  • Analytical Reagent Grade (ARG)
  • Active Pharmaceutical Ingredient (API) Grade
  • Photographic Grade
  • Others

Global Silver Nitrate, By Application (USD Billion,Tons,2019-2035)

  • Photography & Jewellery
  • Medicine & Healthcare
  • Glass Coating
  • Textile
  • Others

North America Outlook (USD Billion,Tons,2019-2035)


North America Silver Nitrate, By Grade Type (USD Billion,Tons,2019-2035)

  • Analytical Reagent Grade (ARG)
  • Active Pharmaceutical Ingredient (API) Grade
  • Photographic Grade
  • Others

North America Silver Nitrate, By Application (USD Billion,Tons,2019-2035)

  • Photography & Jewellery
  • Medicine & Healthcare
  • Glass Coating
  • Textile
  • Others

United States Outlook (USD Billion,Tons,2019-2035)


United States Silver Nitrate, By Grade Type (USD Billion,Tons,2019-2035)

  • Analytical Reagent Grade (ARG)
  • Active Pharmaceutical Ingredient (API) Grade
  • Photographic Grade
  • Others

United States Silver Nitrate, By Application (USD Billion,Tons,2019-2035)

  • Photography & Jewellery
  • Medicine & Healthcare
  • Glass Coating
  • Textile
  • Others

Canada Outlook (USD Billion,Tons,2019-2035)


Canada Silver Nitrate, By Grade Type (USD Billion,Tons,2019-2035)

  • Analytical Reagent Grade (ARG)
  • Active Pharmaceutical Ingredient (API) Grade
  • Photographic Grade
  • Others

Canada Silver Nitrate, By Application (USD Billion,Tons,2019-2035)

  • Photography & Jewellery
  • Medicine & Healthcare
  • Glass Coating
  • Textile
  • Others

Mexico Outlook (USD Billion,Tons,2019-2035)


Mexico Silver Nitrate, By Grade Type (USD Billion,Tons,2019-2035)

  • Analytical Reagent Grade (ARG)
  • Active Pharmaceutical Ingredient (API) Grade
  • Photographic Grade
  • Others

Mexico Silver Nitrate, By Application (USD Billion,Tons,2019-2035)

  • Photography & Jewellery
  • Medicine & Healthcare
  • Glass Coating
  • Textile
  • Others

Europe Outlook (USD Billion,Tons,2019-2035)


Europe Silver Nitrate, By Grade Type (USD Billion,Tons,2019-2035)

  • Analytical Reagent Grade (ARG)
  • Active Pharmaceutical Ingredient (API) Grade
  • Photographic Grade
  • Others

Europe Silver Nitrate, By Application (USD Billion,Tons,2019-2035)

  • Photography & Jewellery
  • Medicine & Healthcare
  • Glass Coating
  • Textile
  • Others

Germany Outlook (USD Billion,Tons,2019-2035)


Germany Silver Nitrate, By Grade Type (USD Billion,Tons,2019-2035)

  • Analytical Reagent Grade (ARG)
  • Active Pharmaceutical Ingredient (API) Grade
  • Photographic Grade
  • Others

Germany Silver Nitrate, By Application (USD Billion,Tons,2019-2035)

  • Photography & Jewellery
  • Medicine & Healthcare
  • Glass Coating
  • Textile
  • Others

United Kingdom Outlook (USD Billion,Tons,2019-2035)


United Kingdom Silver Nitrate, By Grade Type (USD Billion,Tons,2019-2035)

  • Analytical Reagent Grade (ARG)
  • Active Pharmaceutical Ingredient (API) Grade
  • Photographic Grade
  • Others

United Kingdom Silver Nitrate, By Application (USD Billion,Tons,2019-2035)

  • Photography & Jewellery
  • Medicine & Healthcare
  • Glass Coating
  • Textile
  • Others

France Outlook (USD Billion,Tons,2019-2035)


France Silver Nitrate, By Grade Type (USD Billion,Tons,2019-2035)

  • Analytical Reagent Grade (ARG)
  • Active Pharmaceutical Ingredient (API) Grade
  • Photographic Grade
  • Others

France Silver Nitrate, By Application (USD Billion,Tons,2019-2035)

  • Photography & Jewellery
  • Medicine & Healthcare
  • Glass Coating
  • Textile
  • Others

Italy Outlook (USD Billion,Tons,2019-2035)


Italy Silver Nitrate, By Grade Type (USD Billion,Tons,2019-2035)

  • Analytical Reagent Grade (ARG)
  • Active Pharmaceutical Ingredient (API) Grade
  • Photographic Grade
  • Others

Italy Silver Nitrate, By Application (USD Billion,Tons,2019-2035)

  • Photography & Jewellery
  • Medicine & Healthcare
  • Glass Coating
  • Textile
  • Others

Russia Outlook (USD Billion,Tons,2019-2035)


Russia Silver Nitrate, By Grade Type (USD Billion,Tons,2019-2035)

  • Analytical Reagent Grade (ARG)
  • Active Pharmaceutical Ingredient (API) Grade
  • Photographic Grade
  • Others

Russia Silver Nitrate, By Application (USD Billion,Tons,2019-2035)

  • Photography & Jewellery
  • Medicine & Healthcare
  • Glass Coating
  • Textile
  • Others

Spain Outlook (USD Billion,Tons,2019-2035)


Spain Silver Nitrate, By Grade Type (USD Billion,Tons,2019-2035)

  • Analytical Reagent Grade (ARG)
  • Active Pharmaceutical Ingredient (API) Grade
  • Photographic Grade
  • Others

Spain Silver Nitrate, By Application (USD Billion,Tons,2019-2035)

  • Photography & Jewellery
  • Medicine & Healthcare
  • Glass Coating
  • Textile
  • Others


Rest of Europe Outlook (USD Billion,Tons,2019-2035)


Rest of Europe Silver Nitrate, By Grade Type (USD Billion,Tons,2019-2035)

  • Analytical Reagent Grade (ARG)
  • Active Pharmaceutical Ingredient (API) Grade
  • Photographic Grade
  • Others

Rest of Europe Silver Nitrate, By Application (USD Billion,Tons,2019-2035)

  • Photography & Jewellery
  • Medicine & Healthcare
  • Glass Coating
  • Textile
  • Others

Asia-Pacific Outlook (USD Billion,Tons,2019-2035)


Asia-Pacific Silver Nitrate, By Grade Type (USD Billion,Tons,2019-2035)

  • Analytical Reagent Grade (ARG)
  • Active Pharmaceutical Ingredient (API) Grade
  • Photographic Grade
  • Others

Asia-Pacific Silver Nitrate, By Application (USD Billion,Tons,2019-2035)

  • Photography & Jewellery
  • Medicine & Healthcare
  • Glass Coating
  • Textile
  • Others

China Outlook (USD Billion,Tons,2019-2035)


China Silver Nitrate, By Grade Type (USD Billion,Tons,2019-2035)

  • Analytical Reagent Grade (ARG)
  • Active Pharmaceutical Ingredient (API) Grade
  • Photographic Grade
  • Others

China Silver Nitrate, By Application (USD Billion,Tons,2019-2035)

  • Photography & Jewellery
  • Medicine & Healthcare
  • Glass Coating
  • Textile
  • Others

India Outlook (USD Billion,Tons,2019-2035)


India Silver Nitrate, By Grade Type (USD Billion,Tons,2019-2035)

  • Analytical Reagent Grade (ARG)
  • Active Pharmaceutical Ingredient (API) Grade
  • Photographic Grade
  • Others

India Silver Nitrate, By Application (USD Billion,Tons,2019-2035)

  • Photography & Jewellery
  • Medicine & Healthcare
  • Glass Coating
  • Textile
  • Others

Japan Outlook (USD Billion,Tons,2019-2035)


Japan Silver Nitrate, By Grade Type (USD Billion,Tons,2019-2035)

  • Analytical Reagent Grade (ARG)
  • Active Pharmaceutical Ingredient (API) Grade
  • Photographic Grade
  • Others

Japan Silver Nitrate, By Application (USD Billion,Tons,2019-2035)

  • Photography & Jewellery
  • Medicine & Healthcare
  • Glass Coating
  • Textile
  • Others

South Korea Outlook (USD Billion,Tons,2019-2035)


South Korea Silver Nitrate, By Grade Type (USD Billion,Tons,2019-2035)

  • Analytical Reagent Grade (ARG)
  • Active Pharmaceutical Ingredient (API) Grade
  • Photographic Grade
  • Others

South Korea Silver Nitrate, By Application (USD Billion,Tons,2019-2035)

  • Photography & Jewellery
  • Medicine & Healthcare
  • Glass Coating
  • Textile
  • Others

Malaysia Outlook (USD Billion,Tons,2019-2035)

Malaysia Silver Nitrate, By Grade Type (USD Billion,Tons,2019-2035)

  • Analytical Reagent Grade (ARG)
  • Active Pharmaceutical Ingredient (API) Grade
  • Photographic Grade
  • Others

Malaysia Silver Nitrate, By Application (USD Billion,Tons,2019-2035)

  • Photography & Jewellery
  • Medicine & Healthcare
  • Glass Coating
  • Textile
  • Others

Thailand Outlook (USD Billion,Tons,2019-2035)


Thailand Silver Nitrate, By Grade Type (USD Billion,Tons,2019-2035)

  • Analytical Reagent Grade (ARG)
  • Active Pharmaceutical Ingredient (API) Grade
  • Photographic Grade
  • Others

Thailand Silver Nitrate, By Application (USD Billion,Tons,2019-2035)

  • Photography & Jewellery
  • Medicine & Healthcare
  • Glass Coating
  • Textile
  • Others

Indonesia Outlook (USD Billion,Tons,2019-2035)


Indonesia Silver Nitrate, By Grade Type (USD Billion,Tons,2019-2035)

  • Analytical Reagent Grade (ARG)
  • Active Pharmaceutical Ingredient (API) Grade
  • Photographic Grade
  • Others

Indonesia Silver Nitrate, By Application (USD Billion,Tons,2019-2035)

  • Photography & Jewellery
  • Medicine & Healthcare
  • Glass Coating
  • Textile
  • Others

Rest of Asia-Pacific Outlook (USD Billion,Tons,2019-2035)


Rest of Asia-Pacific Silver Nitrate, By Grade Type (USD Billion,Tons,2019-2035)

  • Analytical Reagent Grade (ARG)
  • Active Pharmaceutical Ingredient (API) Grade
  • Photographic Grade
  • Others

Rest of Asia-Pacific Silver Nitrate, By Application (USD Billion,Tons,2019-2035)

  • Photography & Jewellery
  • Medicine & Healthcare
  • Glass Coating
  • Textile
  • Others

Middle East & Africa Outlook (USD Billion,Tons,2019-2035)


Middle East & Africa Silver Nitrate, By Grade Type (USD Billion,Tons,2019-2035)

  • Analytical Reagent Grade (ARG)
  • Active Pharmaceutical Ingredient (API) Grade
  • Photographic Grade
  • Others

Middle East & Africa Silver Nitrate, By Application (USD Billion,Tons,2019-2035)

  • Photography & Jewellery
  • Medicine & Healthcare
  • Glass Coating
  • Textile
  • Others

GCC Countries Outlook (USD Billion,Tons,2019-2035)

GCC Countries Silver Nitrate, By Grade Type (USD Billion,Tons,2019-2035)

  • Analytical Reagent Grade (ARG)
  • Active Pharmaceutical Ingredient (API) Grade
  • Photographic Grade
  • Others

GCC Countries Silver Nitrate, By Application (USD Billion,Tons,2019-2035)

  • Photography & Jewellery
  • Medicine & Healthcare
  • Glass Coating
  • Textile
  • Others

South Africa Outlook (USD Billion,Tons,2019-2035)


South Africa Silver Nitrate, By Grade Type (USD Billion,Tons,2019-2035)

  • Analytical Reagent Grade (ARG)
  • Active Pharmaceutical Ingredient (API) Grade
  • Photographic Grade
  • Others

South Africa Silver Nitrate, By Application (USD Billion,Tons,2019-2035)

  • Photography & Jewellery
  • Medicine & Healthcare
  • Glass Coating
  • Textile
  • Others

Rest of Middle East & Africa Outlook (USD Billion,Tons,2019-2035)


Rest of Middle East & Africa Silver Nitrate, By Grade Type (USD Billion,Tons,2019-2035)

  • Analytical Reagent Grade (ARG)
  • Active Pharmaceutical Ingredient (API) Grade
  • Photographic Grade
  • Others

Rest of Middle East & Africa Silver Nitrate, By Application (USD Billion,Tons,2019-2035)

  • Photography & Jewellery
  • Medicine & Healthcare
  • Glass Coating
  • Textile
  • Others

South America Outlook (USD Billion,Tons,2019-2035)


South America Silver Nitrate, By Grade Type (USD Billion,Tons,2019-2035)

  • Analytical Reagent Grade (ARG)
  • Active Pharmaceutical Ingredient (API) Grade
  • Photographic Grade
  • Others

South America Silver Nitrate, By Application (USD Billion,Tons,2019-2035)

  • Photography & Jewellery
  • Medicine & Healthcare
  • Glass Coating
  • Textile
  • Others

Argentina Outlook (USD Billion,Tons,2019-2035)


Argentina Silver Nitrate, By Grade Type (USD Billion,Tons,2019-2035)

  • Analytical Reagent Grade (ARG)
  • Active Pharmaceutical Ingredient (API) Grade
  • Photographic Grade
  • Others

Argentina Silver Nitrate, By Application (USD Billion,Tons,2019-2035)

  • Photography & Jewellery
  • Medicine & Healthcare
  • Glass Coating
  • Textile
  • Others

Brazil Outlook (USD Billion,Tons,2019-2035)


Brazil Silver Nitrate, By Grade Type (USD Billion,Tons,2019-2035)

  • Analytical Reagent Grade (ARG)
  • Active Pharmaceutical Ingredient (API) Grade
  • Photographic Grade
  • Others

Brazil Silver Nitrate, By Application (USD Billion,Tons,2019-2035)

  • Photography & Jewellery
  • Medicine & Healthcare
  • Glass Coating
  • Textile
  • Others


Rest of South America Outlook (USD Billion,Tons,2019-2035)


Rest of South America Silver Nitrate, By Grade Type (USD Billion,Tons,2019-2035)

  • Analytical Reagent Grade (ARG)
  • Active Pharmaceutical Ingredient (API) Grade
  • Photographic Grade
  • Others

Rest of South America Silver Nitrate, By Application (USD Billion,Tons,2019-2035)

  • Photography & Jewellery
  • Medicine & Healthcare
  • Glass Coating
  • Textile
  • Others
Infographic

Free Sample Request

Kindly complete the form below to receive a free sample of this Report

Get Free Sample

Customer Strories

“I am very pleased with how market segments have been defined in a relevant way for my purposes (such as "Portable Freezers & refrigerators" and "last-mile"). In general the report is well structured. Thanks very much for your efforts.”

Victoria Milne

Founder

Compare Licence

×
Features License Type
Single User Multiuser License Enterprise User
Price $4,950 $5,950 $7,250
Maximum User Access Limit 1 User Upto 10 Users Unrestricted Access Throughout the Organization
Free Customization
Direct Access to Analyst
Deliverable Format
Platform Access
Discount on Next Purchase 10% 15% 15%
Printable Versions