Smart Home Appliances Market (2026 - 2035)

Smart Home Appliances Market Size, Share and Research Report: By Product (Refrigerator, Dishwasher, Washing Machine, Air Conditioner), By Technology (Wi-Fi, ZigBee, Bluetooth, Cellular Technology, Radio Frequency Identification), By Distribution Channel (Offline, Online) and By Regional (North America, Europe, South America, Asia Pacific, Middle East and Africa) - Industry Forecast Till 2035
ID: MRFR/SEM/2502-HCR
200 Pages
Aarti Dhapte, Shubham Munde
Last Updated: July 20, 2026
Smart Home Appliances Market
Market Size
Forecast Period2026-2035
CAGR (2026-2035)10.9%
2025 Market SizeUSD 185.14 Billion
2035 Market SizeUSD 520.93 Billion
Key Players
Samsung Electronics
LG Electronics
Whirlpool Corporation
Haier Smart Home
BSH Home Appliances
Midea Group
Opportunities
  • Appliance-as-a-Service and Subscription Models
  • Edge-AI and On-Device Generative Assistance
  • Emerging-Market Expansion Through Localized Manufacturing

Smart Home Appliances Market Summary

The Smart Home Appliances Market reached an estimated USD 185.14 Billion in 2025 and is projected to grow from USD 205.34 Billion in 2026 to USD 520.93 Billion by 2035, registering a CAGR of 10.9% across the forecast period. Two catalysts anchor this trajectory: the U.S. Inflation Reduction Act's expanded rebates for Energy Star–certified connected appliances and the European Commission's updated Ecodesign for Sustainable Products Regulation, which mandates digital product passports for white goods sold after 2027 [1][2]. Together, these policy instruments are pulling forward replacement cycles and rewarding manufacturers who embed connectivity at the chipset level.

A generational technology shift is underway. Legacy single-function appliances controlled by mechanical timers are giving way to sensor-rich, cloud-connected platforms that learn household routines and respond to grid signals in real time. Global semiconductor investment earmarked for IoT-grade chipsets exceeded USD 14 billion in 2024, according to the Semiconductor Industry Association, reflecting OEM confidence that embedded intelligence will become table stakes rather than a premium differentiator [3]. The Connectivity Standards Alliance's Matter protocol is accelerating this shift by lowering the engineering cost of multi-ecosystem compatibility.

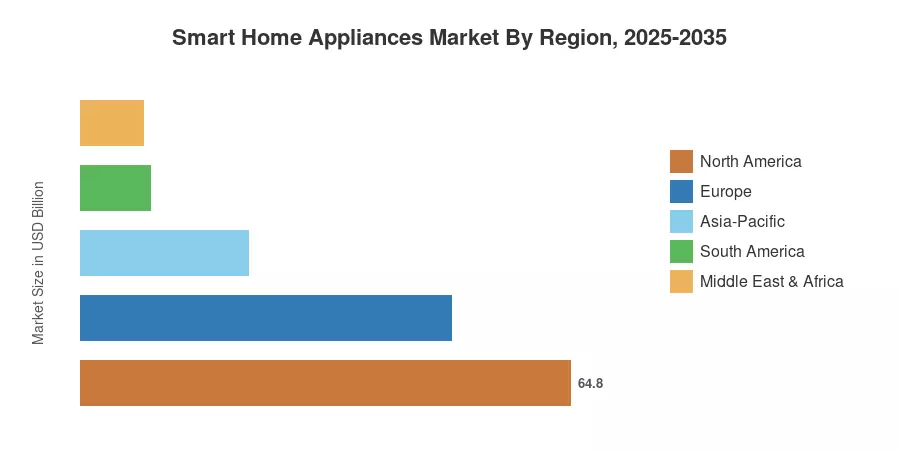
North America commands roughly 35% of the Smart Home Appliances Market, buoyed by high broadband penetration and aggressive retail promotions from home-improvement chains. Asia-Pacific is the fastest-growing region at a projected 12.0% CAGR through 2035, fueled by urbanization across China, India, and Southeast Asia. Europe holds the second-largest share at approximately 26.5%, where strict energy-labeling directives continue to drive appliance upgrades. As 5G fixed-wireless access widens the addressable household base, the next decade will bring connected appliance adoption into demographics previously considered out of reach.


Key Report Takeaways

• By Product Type

  • Smart washing machines and dryers accounted for roughly 26% of the Smart Home Appliances Market in 2025, driven by utility demand-response enrollment and water-conservation mandates.
  • Smart cookware and cooktops are forecast to expand at a 13.7% CAGR through 2035, reflecting the rise of induction platforms with integrated recipe guidance.

• By Connectivity Technology

  • Wi-Fi-enabled appliances captured approximately 63% of revenue in 2025, benefiting from existing home-router infrastructure.
  • Thread-based devices are advancing at a 13.9% CAGR, propelled by Matter certification requirements that favor low-power mesh protocols.

• By Distribution Channel

  • Offline retail outlets generated around 66% of the Smart Home Appliances Market revenue in 2025, with experiential showrooms proving decisive for high-ticket items.
  • Online channels are projected to grow at a 12.6% CAGR as brands invest in augmented-reality kitchen planners.

• By End-User

  • Residential consumers represented about 71% of the Smart Home Appliances Market in 2025.
  • Commercial end users are expanding at a 12.2% CAGR, led by hospitality and co-living operators standardizing connected kitchenettes.

• By Region

  • North America led with a 35% share of the Smart Home Appliances Market in 2025.
  • Asia-Pacific is forecast to grow at a 12.0% CAGR, the highest among all regions, through 2035.


Market Size and Forecast (2021–2035)

Market Research Future's estimates combine primary surveys of appliance OEMs and component suppliers with secondary data from national statistical offices, trade associations, and customs databases. Historical values (2021–2024) draw on audited company filings; the 2025 base year incorporates preliminary shipment data through Q3 2025. Forecast values apply a calibrated compound annual growth model adjusted for macroeconomic variables and policy scenarios.
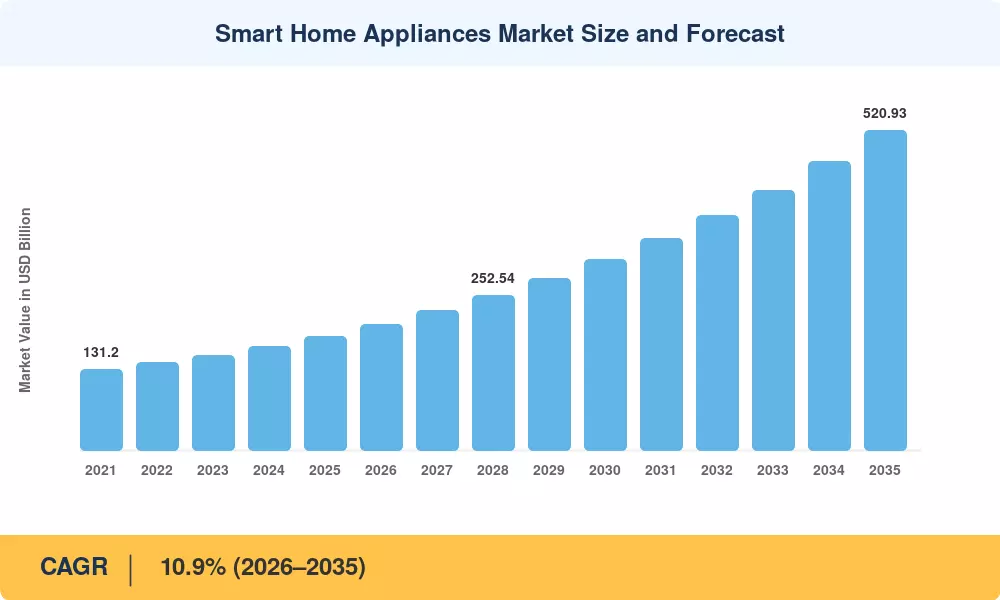
Smart Home Appliances Market Size and Forecast
Our Impact
Enabled $4.3B Revenue Impact for Fortune 500 and Leading Multinationals
Partnering with 2000+ Global Organizations Each Year
30K+ Citations by Top-Tier Firms in the Industry

Driver Impact Analysis

Driver ~% Impact on CAGR Geographic Relevance Impact Timeline
Energy-efficiency rebates & time-of-use tariffs 18–22% North America, Europe Short-term (≤2 yr)
Matter protocol & multi-ecosystem interoperability 14–18% Global Medium-term (2–4 yr)
AI-powered predictive maintenance & personalization 12–15% North America, Asia-Pacific Medium-term (2–4 yr)
Urbanization & smart-city housing mandates 10–13% Asia-Pacific, MEA Long-term (≥4 yr)
5G / Wi-Fi 6E broadband expansion 8–11% Global Medium-term (2–4 yr)
Cybersecurity compliance & data-privacy regulation 6–9% Europe, North America Short-term (≤2 yr)
Semiconductor cost reduction & supply normalization 5–8% Global Short-term (≤2 yr)


Energy-Efficiency Rebates and Utility Incentives

Government rebate schemes are one of the immediate drivers for the Smart Home Appliances Market. The U.S. Department of Energy has provided more than USD 9 billion through the IRA’s Home Energy Rebate programs, some of which cover connected HVAC equipment, water heaters, and smart thermostats that are part of demand-response schemes [1]. Utilities in California, Texas, and New York have put out time-of-use tariff structures that financially incentivize homes to use linked washers and dryers during off-peak hours, creating a new income-generating asset class for appliances.


Matter Protocol and Multi-Ecosystem Interoperability

Appliance manufacturers that adopt Matter can reach consumers across Amazon Alexa, Google Home, and Apple HomeKit ecosystems without maintaining separate firmware stacks. This reduces per-unit software engineering costs by an estimated 30%, according to industry working-group disclosures, and encourages mid-tier brands to enter the Smart Home Appliances Market for the first time.

AI-Powered Predictive Maintenance

Refrigerators, dishwashers and HVAC systems now have embedded machine learning algorithms that can sense component degradation weeks before failure. Samsung’s AI-driven Bespoke range and LG’s ThinQ platform both show double-digit falls in warranty claim rates for connected versus non-connected products [7]. These savings are passed on to the consumer in the form of no emergency repair bills, and to the manufacturer in the form of real-time field-reliability data that reduces next-generation development cycles.


Urbanization and Smart-City Housing Mandates

Rapid urbanization in India, China, and Southeast Asia is creating millions of new housing units annually, and municipal planners increasingly stipulate connectivity-ready electrical infrastructure in building codes [8]. India's Production-Linked Incentive (PLI) scheme for white goods, budgeted at approximately USD 800 million, directly subsidizes domestic manufacturing of connected air conditioners, pulling down retail price points and accelerating adoption.


Restraints Impact Analysis

The restraint impacts below follow the same directional methodology described in Section 4. They represent headwinds that moderate — but do not reverse — the overall growth trajectory of the Smart Home Appliances Market.

Restraint ~% Negative Impact on CAGR Geographic Relevance Impact Timeline
Data-privacy concerns & consumer trust deficit –3 to –5% Global Short-term (≤2 yr)
High upfront cost premium over conventional appliances –3 to –4% South America, MEA Medium-term (2–4 yr)
Fragmented connectivity standards in legacy installs –2 to –3% Europe, Asia-Pacific Medium-term (2–4 yr)
Cybersecurity vulnerability & firmware update fatigue –2 to –3% North America, Europe Long-term (≥4 yr)
Limited rural broadband infrastructure –1 to –2% Asia-Pacific, South America Long-term (≥4 yr)


Data-Privacy Concerns and Consumer Trust Deficit

High-profile incidents — such as a connected camera vendor's unauthorized data sharing disclosed by the U.S. Federal Trade Commission in 2023 — have made privacy a front-page issue. Manufacturers that cannot demonstrate end-to-end encryption and transparent data-governance policies risk losing share to privacy-first competitors, particularly in the European Smart Home Appliances Market.

High Upfront Cost Premium

Point-of-sale data [13] shows that in most categories, connected appliances still cost 20–35% more than their conventional equivalents. In price-sensitive areas like South America and portions of Southeast Asia, this premium limits adoption to higher-income households. Emerging economies will lag mature markets in bulk penetration until component costs (especially Wi-Fi/Thread radios and edge-AI chipsets) come down further.


Fragmented Connectivity Standards in Legacy Installations

Matter solves new-build interoperability, but there are millions of installed smart appliances running proprietary Zigbee profiles or early Z-Wave software that cannot be updated over the air [5]. Mixed-generation gadgets within the home create faulty automations and consumer frustration. Adding bridge hardware to retrofit legacy appliances adds expense and complexity that slows the upgrade route and suppresses net-new subscription income for platform operators.


Smart Home Appliances Market Opportunities

Appliance-as-a-Service and Subscription Models

Appliance brands continue to explore auto-replenishment integrations, allowing connected washing machines to track liquid usage and auto-order detergent supplies via digital stores. While comprehensive hardware-and-consumable monthly leasing models remain heavily restricted to specialized B2B and real-estate procurement channels, automated retail ecosystems help stabilize secondary brand margins.

Edge-AI and On-Device Generative Assistance

As on-device neural processing units mature, appliances will execute generative AI tasks — meal planning, energy optimization, natural-language troubleshooting — without round-tripping data to the cloud. This addresses the privacy restraint discussed in Section 5.1 while unlocking premium pricing for AI-enabled SKUs. Qualcomm's IoT-optimized Snapdragon platforms and MediaTek's Genio series are already enabling OEMs to embed large-language-model inference at the appliance level [7].

Emerging-Market Expansion Through Localized Manufacturing

The smart home appliances market is a big white space for India, Vietnam & Brazil. Incentives to encourage local manufacture, such as India’s PLI initiative or Vietnam’s electronics-FDI corridors, can cut landed cost by 15–20%, bringing connected appliances on par with traditional imports [8]. Brands that are willing to customize their portfolios to regional voltage standards, water quality, and cuisine tastes will reap first-mover benefits.


Grid-Edge Monetization and Virtual Power Plants

Utilities are enrolling connected water heaters, HVAC units, and EV chargers in virtual power plant (VPP) programs that compensate households for automated load shifting [9]. The U.S. DOE estimates that residential VPPs could displace 80-160 GW of peak generation capacity by 2030. Appliance OEMs that embed grid-response firmware unlock a new value proposition — households earn utility credits, and manufacturers differentiate on energy-revenue potential.

Data Monetization Through Anonymized Usage Analytics

Aggregated, anonymized appliance-usage data holds commercial value for urban planners, utility forecasters, and CPG companies seeking real-time consumption insights. Manufacturers that build compliant data platforms — with explicit consumer opt-in and GDPR/CCPA alignment — can unlock ancillary revenue, scaling significantly as installed bases grow [12].


Smart Home Appliances Market Future Outlook

AI-Autonomous Appliance Operations

By the early 2030s, appliances will shift from responding to user commands to anticipating household needs autonomously. Refrigerators will track inventory via computer vision and trigger grocery orders; washing machines will schedule cycles around real-time electricity pricing without human input [7]. The IEA projects that AI-optimized home energy management could reduce residential electricity consumption, making the Smart Home Appliances Market a material contributor to national decarbonization targets.

Platform Economics and Ecosystem Lock-In

As Matter reduces protocol-level friction, competitive differentiation will migrate from connectivity to platform services — recipe ecosystems, health-monitoring dashboards, and predictive maintenance subscriptions. The Smart Home Appliances Market will increasingly resemble the smartphone market, where hardware margins compress and lifetime value accrues through software. Companies that build sticky service layers will capture disproportionate profit pools [10].

Electrification and Grid-Interactive Buildings

The global push to electrify heating and cooking aligns tightly with the Smart Home Appliances Market. The DOE's Building Technologies Office estimates that grid-interactive efficient buildings could provide up to 116 GW of flexible capacity in the United States alone by 2030 [9]. Connected heat-pump water heaters, induction cooktops, and smart HVAC systems sit at the intersection of electrification and demand flexibility, positioning them for policy tailwinds through at least 2035.

Circular Economy and Sustainability Reporting

ESG disclosure frameworks — the EU Corporate Sustainability Reporting Directive and the SEC's climate-risk rules — are pressuring appliance OEMs to demonstrate product-lifecycle stewardship [18]. Digital product passports tied to smart appliances will enable end-of-life tracking, component-level recycling, and verified carbon footprints. Brands that embed circularity into their connected-product architectures will meet both regulatory mandates and consumer expectations in the Smart Home Appliances Market.


Smart Home Appliances Market Segmentation

By Product Type

Segment Key Metric Primary Demand Driver
Smart Washing Machines & Dryers 26% share (2025) Utility demand-response enrollment
Smart Refrigerators USD 42.60 Billion (2025) AI inventory management, energy savings
Smart Ovens 11.5% CAGR Guided cooking and recipe integration
Smart Dishwashers USD 18.50 Billion (2025) Water conservation regulations
Smart Cookware & Cooktops 13.7% CAGR Induction technology and precision cooking
Other Smart Appliances USD 22.30 Billion (2025) HVAC, air purifiers, robot vacuums


Smart washing machines and dryers anchor the Smart Home Appliances Market by product type, accounting for approximately 26% of 2025 revenue. Their dominance reflects a practical value proposition: grid-connected laundry appliances can shift cycles to off-peak windows, yielding utility bill savings of 10–20% per household. OEM investment in fabric-sensing algorithms and auto-dosing detergent systems has further widened the performance gap versus conventional machines.

Smart cookware and cooktops represent the fastest-expanding category at a 13.7% CAGR, driven by the global transition from gas to induction cooking. Induction platforms with integrated temperature probes and recipe-guided cooking are attracting both home chefs and health-conscious consumers seeking precise nutritional control. Brands like Breville and Thermomix are blurring the line between standalone appliances and connected culinary platforms.

By Connectivity Technology

Segment Key Metric Primary Demand Driver
Wi-Fi 63% share (2025) Ubiquitous home-router infrastructure
Bluetooth USD 15.40 Billion (2025) Low-cost pairing for small accessories
Zigbee 7.8% CAGR Legacy smart-home hub ecosystems
Z-Wave USD 7.20 Billion (2025) Sub-GHz reliability in dense environments
Thread 13.9% CAGR Matter protocol endorsement, low-power mesh
Other Technologies USD 4.80 Billion (2025) Proprietary RF, NFC proximity triggers


Wi-Fi dominates the Smart Home Appliances Market connectivity mix because it leverages infrastructure already present in over 85% of broadband households globally. However, Wi-Fi's higher power draw and limited mesh scalability create openings for Thread, which is gaining momentum as the backbone protocol for Matter-certified devices. Thread's IPv6-native mesh architecture eliminates the need for proprietary hubs, reducing system complexity and aligning with consumer demand for plug-and-play setup.

By Distribution Channel

Segment Key Metric Primary Demand Driver
Offline 66% share (2025) Experiential retail, installation services
Online 12.6% CAGR AR kitchen planners, doorstep delivery


Offline retail continues to dominate because connected appliances are high-consideration purchases; consumers prefer to see, touch, and test smart interfaces before committing. Large-format retailers like Best Buy, MediaMarkt, and Croma have invested in connected-home experience zones that demonstrate whole-kitchen ecosystems. Online channels are closing the gap rapidly, with augmented-reality placement tools and hassle-free return policies reducing perceived purchase risk for the Smart Home Appliances Market.

By End-User Industry

Segment Key Metric Primary Demand Driver
Residential 71% share (2025) Homeowner upgrades, energy-bill savings
Commercial 12.2% CAGR Hospitality, co-living, managed multifamily


Residential consumers generate the bulk of Smart Home Appliances Market revenue, motivated by convenience, energy savings, and integration with voice assistants. The commercial segment is accelerating as hotel chains, co-living operators, and property developers standardize connected kitchenettes and in-unit laundry to attract tech-savvy tenants and reduce facilities-management overhead.


Regional Market Share Analysis

Region Key Metric (2025) Primary Investment Themes
North America 35.0% share Utility demand-response, AI-integrated platforms
Europe 26.5% share Ecodesign regulation, digital product passports
Asia-Pacific 12.0% CAGR (2026–2035) Urbanization, PLI manufacturing incentives
South America USD 9.26 Billion E-commerce growth, middle-class expansion
Middle East & Africa USD 8.33 Billion Smart-city megaprojects, hospitality modernization
Total USD 185.14 Billion

The Smart Home Appliances Market exhibits a tri-polar structure, with North America, Europe, and Asia-Pacific collectively accounting for over 90% of global revenue. South America and the Middle East & Africa remain nascent but are growing off low bases as broadband penetration and urbanization accelerate.


North America

Country Key Metric Key Driver
United States 72% of regional share IRA rebates, VPP enrollment, retail promotions
Canada 15% of regional share Provincial energy-efficiency programs
Mexico 13% of regional share Nearshoring manufacturing investment


The United States remains the engine of North American demand for the Smart Home Appliances Market, supported by the highest smart-speaker penetration rate globally — over 45% of households, per CTA estimates [14]. Canada's provincial utilities incentivize connected water heaters and thermostats through programs like BC Hydro's smart-appliance rebate. Mexico is emerging as both a manufacturing hub and a consumption center, with Whirlpool and Mabe expanding connected-appliance assembly lines in Monterrey and Querétaro.

Europe

Country Key Metric Key Driver
Germany 10.4% CAGR Industry 4.0 crossover, BSH domestic strength
United Kingdom USD 8.95 Billion by 2035 Smart-meter rollout enabling appliance integration
France 9.8% CAGR Rénovation énergétique subsidies
Italy USD 5.20 Billion by 2035 Premium kitchen-appliance heritage brands
Spain 10.1% CAGR Tourism-driven hospitality modernization
Nordic Countries USD 4.80 Billion by 2035 High sustainability orientation, district-heating integration
Russia 9.2% CAGR Import-substitution policies
Rest of Europe USD 6.40 Billion by 2035 EU cohesion-fund digitalization grants


Europe's regulatory environment acts as both a driver and a quality filter for the Smart Home Appliances Market. The EU Ecodesign for Sustainable Products Regulation, effective from 2027, will require digital product passports embedding repairability scores and recycled-content data, compelling OEMs to redesign product architectures [2]. Germany's BSH Home Appliances and Sweden's Electrolux lead regional innovation, while the UK's mandated smart-meter rollout creates a ready data backbone for appliance-grid coordination.

Asia-Pacific

Country Key Metric Key Driver
China 38% of regional share Midea and Haier domestic dominance, 5G rollout
India 14.1% CAGR PLI-II incentives, rising middle class
Japan USD 9.10 Billion by 2035 Aging-population assistive-technology demand
South Korea 11.8% CAGR Samsung/LG innovation hubs, K-smart-home exports
ASEAN 13.2% CAGR Urbanization, cross-border e-commerce
Rest of Asia-Pacific USD 3.60 Billion by 2035 Australia/New Zealand energy-efficiency standards


Asia-Pacific is the fastest-growing region in the Smart Home Appliances Market, driven by a convergence of urbanization, government manufacturing subsidies, and rapidly expanding e-commerce logistics. China alone accounts for 38% of regional revenue, anchored by vertically integrated conglomerates like Midea and Haier that control everything from compressor production to cloud-platform software [15]. India's PLI-II scheme and Japan's aging-society technology programs add distinct growth vectors that make this region structurally diverse.

South America

Country Key Metric Key Driver
Brazil 58% of regional share Largest consumer base, Mercosul trade preferences
Argentina 10.5% CAGR Post-reform economic stabilization
Rest of South America USD 2.10 Billion by 2035 Chile and Colombia smart-city pilots


Brazil dominates the South American Smart Home Appliances Market, where Electrolux and Whirlpool operate major manufacturing facilities. E-commerce platforms such as Mercado Libre are accelerating connected-appliance discovery, particularly in Tier-2 cities where brick-and-mortar retail presence is sparse. Currency volatility and import duties remain structural headwinds, but localized production is gradually mitigating price premiums [13].

Middle East & Africa

Country Key Metric Key Driver
Saudi Arabia 34% of regional share Vision 2030 smart-city investments (NEOM, The Line)
UAE 11.9% CAGR Expo-legacy infrastructure, premium hospitality
South Africa USD 1.20 Billion by 2035 Growing urban middle class
Egypt 12.4% CAGR New Administrative Capital smart-housing stock
Rest of MEA USD 1.80 Billion by 2035 Institutional hospitality and healthcare


The Middle East & Africa region is small in absolute terms but exhibits pockets of rapid adoption tied to government-led megaprojects. Saudi Arabia's NEOM and Egypt's New Administrative Capital are specifying connected appliances as standard fit-outs, giving OEMs large-volume procurement contracts [16]. South Africa's market is more consumer-driven, with load-shedding concerns motivating purchases of smart inverters and connected backup systems.


Smart Home Appliances Market By Region, 2025-2035

Competitive Benchmarking

The Smart Home Appliances Market exhibits moderate concentration, with the top five players accounting for an estimated 40–48% of global revenue. The Herfindahl-Hirschman Index sits in the low-moderate range, reflecting a mix of vertically integrated conglomerates and nimble ecosystem-native entrants. Competition is intensifying along three axes: AI feature depth, ecosystem breadth, and after-sale service monetization.

Company Est. Revenue Share Range Key Offerings for Smart Home Appliances Market Strategic Positioning
Samsung Electronics ~10–14% Bespoke AI suite, SmartThings platform Full-stack ecosystem with semiconductor leverage
LG Electronics ~8–12% ThinQ AI, InstaView refrigerators Premium UX, webOS appliance integration
Whirlpool Corporation ~6–9% Smart washer/dryer, connected kitchen hub North America volume leader, subscription pilots
Haier Smart Home ~7–10% Casarte premium line, U+ Smart Living Vertical integration from compressor to cloud
BSH Home Appliances (Bosch/Siemens) ~5–8% Home Connect platform, Thermador Pro European market leadership, design emphasis
Midea Group ~5–8% M-Smart, COLMO AI brand Cost leadership, aggressive ASEAN expansion
Electrolux ~3–5% AEG connected cooking, Pure i9 robotics Sustainability branding, Scandinavian design
Panasonic Holdings ~2–4% Nanoe X air purifiers, IoT kitchen suite Japan-centric R&D, health-wellness positioning
GE Appliances (Haier subsidiary) ~3–5% SmartHQ platform, Profile smart ranges U.S. brand heritage, Haier R&D synergies
Amazon (Ring, Echo, AmazonBasics) ~2–4% Alexa ecosystem appliances, smart displays Platform gatekeeper, data-network advantage


Recent News & Developments

  • Samsung Electronics (January 2024): Unveiled the Bespoke AI Laundry Combo with an on-device language model at CES 2025, enabling natural-language cycle customization and predictive stain-treatment recommendations [7].
  • Connectivity Standards Alliance (November 2024): Formally released the Matter 1.4 specification standard, focusing extensively on advanced home energy management clusters by introducing native interoperability profiles for solar panels, grid battery storage, and smart heat pumps.
  • Whirlpool Corporation (January 2018): Expanded its integrated digital kitchen ecosystem at CES by connecting its Yummly 2.0 recipe platform with Instacart logistics, enabling consumers to automatically order exact meal ingredients for home delivery.
  • European Commission (December 2024): Finalized implementing rules for the Ecodesign for Sustainable Products Regulation, requiring digital product passports for washing machines and dishwashers sold in the EU from 2027 [2].


Smart Home Appliances Market Report Scope

Parameter Detail
Market Scope Global Smart Home Appliances Market — connected household appliances with embedded sensors, wireless connectivity, and cloud/AI capabilities
Study Period 2021–2035
CAGR (Forecast) 10.9% (2026–2035)
Market Size — Base Year (2025) USD 185.14 Billion
Market Size — Forecast Endpoint (2035) USD 520.93 Billion
Fastest Growing Segment Smart Cookware & Cooktops (By Product Type); Thread (By Connectivity); Asia-Pacific (By Region)
Companies Profiled Samsung, LG, Whirlpool, Haier, BSH, Midea, Electrolux, Panasonic, GE Appliances, Amazon (10 companies)
Valuation Currency USD Billion


FAQs

How does the Matter protocol affect appliance purchasing decisions today?
Matter certification assures buyers that an appliance will work across Alexa, Google Home, and Apple HomeKit without additional bridges. Consumers should verify the Matter version on the product label, as earlier versions lack support for major appliance categories [5].
What total cost of ownership difference exists between connected and conventional refrigerators over a ten-year span?
Connected refrigerators command a 20% to 35% upfront retail price premium. While integration of smart sensors and advanced scheduling yields verifiable operational energy efficiency, net long-term monetary payback values vary broadly based on localized utility tariff variations.
Which cybersecurity certifications should procurement teams require for commercial smart appliances?
Buyers should prioritize UL 2900 series or ETSI EN 303 645 compliance, both of which mandate secure boot, encrypted firmware updates, and vulnerability-disclosure processes [12]. These certifications reduce liability exposure for property operators.
How do subscription-based appliance models compare to outright purchase for multifamily property developers?
Subscription bundles shift capital expenditure to operating expenditure, easing financing for large deployments. Developers benefit from bundled maintenance and automatic hardware refresh cycles every five to seven years [10].
What role do smart appliances play in residential demand-response programs, and how are homeowners compensated?
Enrolled appliances shift loads to off-peak windows automatically, earning homeowners USD 50–150 annually in utility credits. Compensation varies by utility territory and appliance category [9][21].
How should buyers evaluate AI feature claims when comparing smart-appliance brands?
Look for on-device inference capability rather than cloud-only AI, as on-device processing ensures functionality during internet outages. Published latency benchmarks and offline feature lists are reliable comparison criteria [7].
What is the expected appliance hardware refresh cycle as AI capabilities evolve rapidly?
Most OEMs now support three to five years of firmware upgrades via over-the-air updates, extending useful AI capability without hardware swap. LG's ThinQ UP program exemplifies this upgrade-in-place approach [7].    
Author
Author
Author Profile
Aarti Dhapte LinkedIn
AVP - Research
A consulting professional focused on helping businesses navigate complex markets through structured research and strategic insights. I partner with clients to solve high-impact business problems across market entry strategy, competitive intelligence, and opportunity assessment. Over the course of my experience, I have led and contributed to 100+ market research and consulting engagements, delivering insights across multiple industries and geographies, and supporting strategic decisions linked to $500M+ market opportunities. My core expertise lies in building robust market sizing, forecasting, and commercial models (top-down and bottom-up), alongside deep-dive competitive and industry analysis. I have played a key role in shaping go-to-market strategies, investment cases, and growth roadmaps, enabling clients to make confident, data-backed decisions in dynamic markets.
Co-Author
Co-Author Profile
Shubham Munde LinkedIn
Team Lead - Research
Shubham brings over 7 years of expertise in Market Intelligence and Strategic Consulting, with a strong focus on the Automotive, Aerospace, and Defense sectors. Backed by a solid foundation in semiconductors, electronics, and software, he has successfully delivered high-impact syndicated and custom research on a global scale. His core strengths include market sizing, forecasting, competitive intelligence, consumer insights, and supply chain mapping. Widely recognized for developing scalable growth strategies, Shubham empowers clients to navigate complex markets and achieve a lasting competitive edge. Trusted by start-ups and Fortune 500 companies alike, he consistently converts challenges into strategic opportunities that drive sustainable growth.
Download Free Sample

Kindly complete the form below to receive a free sample of this Report

Download PDF ×

We do not share your information with anyone. However, we may send you emails based on your report interest from time to time. You may contact us at any time to opt-out.

















