Soda Ash Market

Key Players: Solvay SA, Tata Chemicals Ltd, Ciner Group, WE Soda (incl. Genesis Alkali), GHCL Limited, Tangshan Sanyou Group, Shandong Haihua Co., Ciech SA

Soda Ash Market

Soda Ash Market Research Report By Application (Glass Manufacturing, Detergents, Chemical Manufacturing, Sodium Bicarbonate Production, Pulp and Paper), By Type (Dense Soda Ash, Light Soda Ash, Soda Ash By-product), By End Use (Construction, Automotive, Food and Beverage, Pharmaceuticals, Household Care), By Source (Natural Soda Ash, Synthetic Soda Ash) and By Regional (North America, Europe, South America, Asia Pacific, Middle East and Africa) - Forecast to 2035.
ID: MRFR/CnM/1723-HCR
111 Pages
Chitranshi Jaiswal
Last Updated: June 12, 2026
 

Soda Ash Market Summary

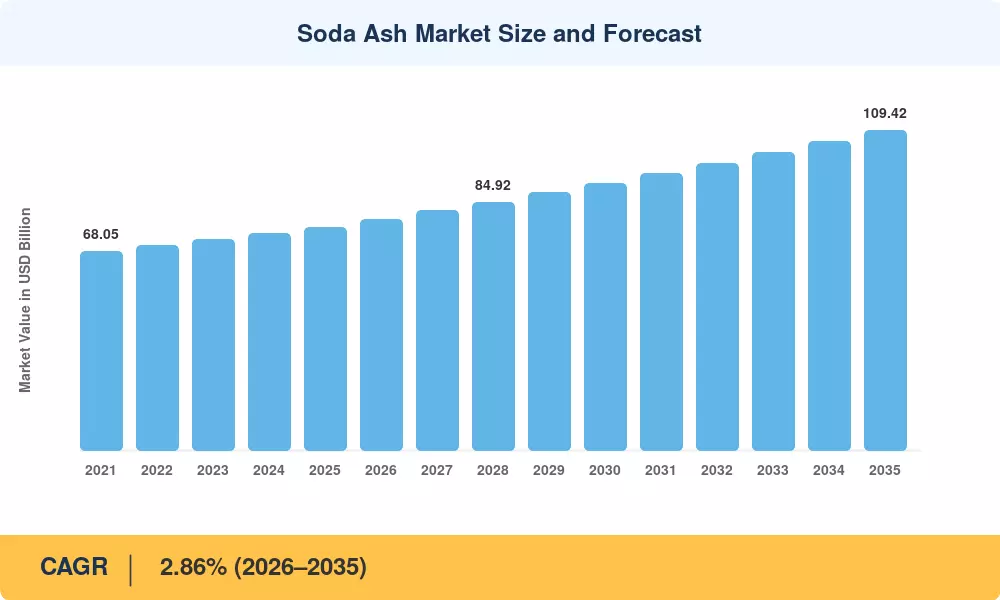
The Soda Ash Market reached an estimated 76.18 million tons in 2025 and is projected to start the forecast window at 78.04 million tons in 2026 before climbing to 109.42 million tons by 2035, registering a CAGR of 2.86% across the outlook period. Two catalysts anchor that trajectory: India's Production-Linked Incentive scheme channeling over USD 1.2 billion into flat-glass capacity, and China's mandate requiring 30% cullet utilization in container glass by 2030—both of which sustain robust sodium carbonate offtake [2][3].

A structural production shift is reshaping the Soda Ash Market's cost curve. Carbon-intensive Solvay-process plants in Europe and China face tightening emissions caps under the EU Carbon Border Adjustment Mechanism, accelerating retirement of legacy synthetic capacity. Trona-based producers in Wyoming's Green River Basin and Türkiye's Kazan district are absorbing the displaced volume, with Genesis Energy and WE Soda collectively investing over USD 800 million in solution-mining expansions through 2028 [4]. Dense soda ash availability is tightening as photovoltaic glass production scales, pushing producers to prioritize industrial alkali materials for solar panel manufacturing lines.

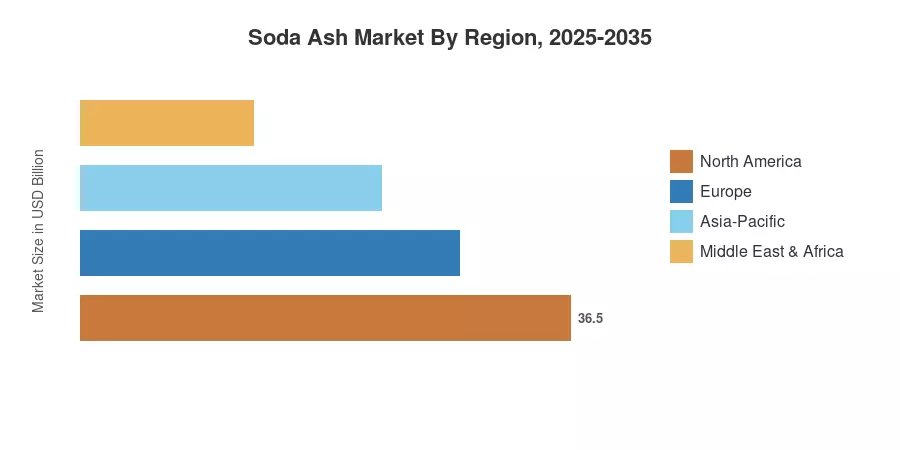
Asia-Pacific commands roughly 46% of global consumption, underpinned by China's glass manufacturing chemicals demand and India's detergent sector expansion. The Middle East & Africa region is the fastest-growing corridor in the Soda Ash Market, driven by Gulf construction megaprojects, while North America holds the second-largest share at approximately 21%, buoyed by natural trona extraction advantages


Key Report Takeaways

• By Type

  • Dense soda ash led with approximately 62% of Soda Ash Market volume in 2024, reflecting persistent pull from flat glass and photovoltaic glass lines
  • Light soda ash is forecast to expand at a 4.21% CAGR through 2035, propelled by rising detergent chemicals consumption across South and Southeast Asia

• By Source

  • Synthetic plants (Solvay, Hou, dual-process) retained roughly 56% revenue share in 2024, though tightening carbon regulations erode their cost advantage
  • Natural trona-based extraction is positioned to grow at a 4.48% CAGR between 2026 and 2035

• By Application

  • Glass manufacturing captured an estimated 55% of the Soda Ash Market revenue in 2024, spanning flat, container, and specialty glass segments
  • Water treatment chemicals applications show the fastest trajectory at a 5.34% CAGR through 2035

• By End-User

  • Building and construction commanded roughly 41% of 2024 revenues within the Soda Ash Market
  • Renewable energy end-uses are projected to climb at a 5.52% CAGR through 2035

• By Region

  • Asia-Pacific accounted for 46% of 2024 consumption in the Soda Ash Market
  • The Middle East & Africa region promises the fastest regional expansion, with a CAGR of 4.08% over the outlook period


Soda Ash Market Size and Forecast (2021–2035)

MRFR's estimates blend bottom-up plant-level capacity data with top-down trade-flow modeling. Historical figures draw on UN Comtrade records, national chemical industry associations, and company annual reports. Forecast projections apply a calibrated CAGR anchored to glass manufacturing chemicals demand pipelines, detergent chemicals consumption surveys, and announced capacity expansions across trona and synthetic routes[5].

Soda Ash Market Size and Forecast
Our Impact
Enabled $4.3B Revenue Impact for Fortune 500 and Leading Multinationals
Partnering with 2000+ Global Organizations Each Year
30K+ Citations by Top-Tier Firms in the Industry
 

Driver Impact Analysis

Driver ~% Impact on CAGR Geographic Relevance Impact Timeline
Solar & photovoltaic glass expansion ~22% Global Medium-term (2–4 yr)
Infrastructure-led flat glass demand ~20% Asia-Pacific, MEA Short-term (≤2 yr)
Natural trona cost advantages ~15% North America, Türkiye Long-term (≥4 yr)
Sodium-ion battery commercialization ~12% China, Europe Medium-term (2–4 yr)
Detergent demand in emerging economies ~11% South Asia, Africa Short-term (≤2 yr)
Water treatment regulatory mandates ~10% Global Long-term (≥4 yr)
Lithium carbonate precipitation growth ~10% South America, Australia Medium-term (2–4 yr)


Solar and Photovoltaic Glass Expansion

IRENA estimates that by 2030, the installed base of solar photovoltaics worldwide will exceed 5,500 GW, and each gigawatt of new crystalline-silicon capacity will require between 5,000 and 6,000 tons of ultra-clear flat glass [7]. Dense soda ash is the main flux agent used in that glass. In 2024, China's National Energy Administration alone authorized 210 GW of additional solar power, bringing an additional 1.2 million tons of inorganic chemical compounds into supply chains for glass manufacturing. The medium-term growth trajectory of the soda ash market is directly supported by this driver.


Infrastructure-Led Flat Glass Demand

By 2026, 20 million urban housing units—each requiring an average of 45 kg of flat glass—are the goal of India's Pradhan Mantri Awas Yojana housing program [3]. Construction-grade glass continues to be the single biggest volume driver for sodium carbonate consumption, especially when combined with Saudi Arabia's NEOM and Red Sea Project, which require more than 800,000 tons of industrial mineral chemicals for architectural glazing. An additional 600,000 tons of additional annual demand are added by Southeast Asian infrastructure routes, such as Vietnam's North-South Expressway and Indonesia's new capital, Nusantara [10].


Natural Trona Cost Advantage and Production Shift

Trona-based soda ash production emits roughly 40% less CO₂ per ton than the Solvay process, and the EU CBAM mechanism—set at EUR 90 per ton of embedded carbon by 2026—will widen the cost gap by an estimated USD 35–50 per ton [8]. Ciner Group's Wyoming operations and Eti Soda's Kazan complex together supply approximately 18 million tons annually of industrial alkali materials at a delivered cost 15–20% below European synthetic competitors. This structural shift is accelerating capacity retirements in Poland, Romania, and northeast China.

Sodium-Ion Battery and Lithium Carbonate Precipitation

CATL's first-generation sodium-ion cells entered commercial production in 2024, consuming approximately 0.8 tons of dense soda ash per MWh of cell capacity [9]. Chemical processing materials for lithium carbonate precipitation—where sodium carbonate is the primary reagent—are scaling alongside lithium output in Chile's Salar de Atacama and Australia's Pilbara region. The sources estimate these two downstream segments could absorb 4–6 million incremental tons of soda ash annually by 2032.


Restraints Impact Analysis

Restraint impact percentages are directional and represent the estimated drag on the Soda Ash Market's growth rate. They do not sum to offset the full CAGR.

Restraint ~% Drag on CAGR Geographic Relevance Impact Timeline
Synthetic plant carbon penalties ~−18% Europe, China Short-term (≤2 yr)
Cullet substitution in glass ~−14% EU, Japan Medium-term (2–4 yr)
Overcapacity risk from Türkiye expansion ~−12% Global Medium-term (2–4 yr)
Energy cost volatility for Solvay plants ~−10% Europe Short-term (≤2 yr)
Liquid detergent shift reducing light grade demand ~−8% North America, Europe Long-term (≥4 yr)


Carbon Penalty Exposure for Synthetic Production

Solvay-process plants in Europe face cumulative carbon costs exceeding EUR 120 per ton of soda ash once CBAM Phase 2 is fully enforced, squeezing margins for producers like Solvay SA and Ciech SA [8]. Several Polish and Bulgarian facilities have already announced partial curtailments totaling 1.5 million tons of annual capacity. While this benefits natural producers, it introduces short-term supply dislocations that inflate spot prices and disrupt downstream procurement cycles for glass manufacturing chemicals buyers.

Cullet Substitution Reducing Virgin Soda Ash Intensity

By 2030, glass packaging must include 65% recycled material, according to the EU's updated Packaging and Packaging Waste Regulation [13]. About 25 kg of sodium carbonate are displaced for every 10 percentage points increase in cullet consumption per ton of molten glass. The container glass industry in Japan now operates at 78% cullet rates. This substitution impact will limit volume growth in the major application sector of the soda ash market as recycling infrastructure develops in developing economies.


Overcapacity Risk from Turkish Expansion

After Ciner Group's Polatlı project and Kazan Soda Elektrik's Phase III development, Turkey's total solution-mining capacity is expected to surpass 12 million tons by 2028 [4]. Surplus volumes might lower FOB Mediterranean prices by 8–12% if demand growth in Southeast Asia and Africa underperforms. This would squeeze profits for both natural and synthetic suppliers of industrial alkali minerals.


Soda Ash Market Opportunities

Sodium-Ion Battery Supply Chains

Sodium-ion batteries represent a transformative downstream channel for the Soda Ash Market. With CATL, BYD, and Faradion scaling production to an estimated 50 GWh by 2028, sodium carbonate feedstock demand could reach 3 million tons annually—a market that barely existed in 2022 [9]

Carbon Capture Integration at Solvay Plants

Rather than shutting down, several European chemical processing materials producers are piloting carbon capture, utilization, and storage (CCUS). Solvay SA's Dombasle-sur-Meurthe facility is testing a 200,000-ton CO₂ capture unit that could restore synthetic competitiveness and preserve 1.8 million tons of annual capacity [14]

African Industrialization and Detergent Demand

Sub-Saharan Africa's powdered detergent chemicals market is projected to grow at over 6% annually through 2035, yet the region imports over 90% of its soda ash from Türkiye and China. Establishing local production—whether natural deposits near Kenya's Lake Magadi or small-scale Hou-process plants in Nigeria—presents a compelling import-substitution opportunity

Lithium-Processing Reagent Contracts

Long-term sodium carbonate supply agreements with lithium producers offer pricing stability that spot-market sales cannot match. Albemarle and SQM collectively consume over 800,000 tons of soda ash for lithium carbonate precipitation annually, and their expansion plans in Chile and Australia could double that figure by 2030 [9]

Smart Water Treatment Infrastructure

Municipal water treatment chemicals spending across India, Vietnam, and the Philippines is accelerating as governments enforce stricter effluent standards. Soda ash serves as a pH buffer and softening agent, and the Asian Development Bank's USD 2.5 billion clean-water lending program through 2028 directly supports procurement volumes for inorganic chemical compounds [12]


Soda Ash Market Future Outlook

Decarbonization of Soda Ash Production

The next decade will determine whether the Solvay process survives on any meaningful scale. The IEA's Net Zero Emissions scenario calls for a 45% reduction in industrial process emissions by 2035, directly targeting synthetic soda ash plants [16]. CCUS retrofits at flagship facilities in France and India could preserve 5–8 million tons of capacity, but only if carbon credit pricing remains above EUR 80 per ton. Trona-based producers of industrial alkali materials stand to capture displaced market share.

Circular Economy and Glass Recycling

Cullet utilization rates will rise globally from an average 35% in 2024 to an estimated 50% by 2035, moderating virgin sodium carbonate intensity in the Soda Ash Market's glass segment [13]. However, absolute glass production volumes—driven by solar panels, EV windshields, and pharmaceutical packaging—are growing faster than substitution effects, ensuring net positive demand. Closed-loop glass recycling systems in Europe and Japan will set benchmarks that emerging economies will gradually adopt.

Energy Storage and New Chemical Pathways

Sodium-ion batteries and lithium carbonate precipitation together represent the most significant new end-use categories for chemical processing materials in this market's history. CATL's second-generation sodium-ion cells, expected by 2027, will improve energy density to 200 Wh/kg and accelerate adoption in grid storage applications [9]. Every 10 GWh of sodium-ion manufacturing capacity absorbs approximately 60,000 tons of dense soda ash—a multiplier that could redirect 5–8% of global output toward battery-grade applications by 2035.

Digital Supply Chain and Pricing Transparency

Commodity trading platforms like Open Mineral and ChemDirect are bringing real-time price discovery to the Soda Ash Market, reducing the opacity that historically favored incumbent producers. Blockchain-based traceability—piloted by Ciner Group in 2024—enables downstream buyers of inorganic chemical compounds to verify carbon footprint claims, supporting ESG procurement mandates from multinational glass and detergent manufacturers [17].


Soda Ash Market Segmentation

By Type

Segment Key Metric Primary Demand Driver
Dense Soda Ash ~62% of 2024 volume Flat glass, photovoltaic glass, and chemical processing materials
Light Soda Ash 4.21% CAGR (2026–2035) Detergent chemicals, water treatment chemicals


The Soda Ash Market's dense grade dominance reflects its critical role as a flux in glass manufacturing. Dense soda ash's higher bulk density and lower dust generation make it the preferred feedstock for float glass furnaces, where furnace charge consistency directly affects yield. Photovoltaic glass lines in China and India exclusively specify dense grade, and the tightening of ultra-low-iron specifications for solar panels is pushing producers to invest in granulation and purification upgrades.

Light soda ash, meanwhile, anchors the detergent chemicals and water treatment chemicals segments. Its higher solubility makes it ideal for powdered detergent formulations that dominate South Asian and African markets. As municipal water treatment mandates expand across Southeast Asia, light-grade consumption is accelerating—particularly in pH adjustment and hardness removal applications that consume sodium carbonate as a primary reagent.

By Source

Segment Key Metric Primary Demand Driver
Natural (Trona-Based) 4.48% CAGR (2026–2035) Lower emissions, cost advantage for industrial alkali materials
Synthetic (Solvay, Hou, Dual-Process) ~56% of 2024 revenue Proximity to downstream consumers in Europe and China


Synthetic production still supplies the majority of global volume in the Soda Ash Market, but its revenue share is eroding as carbon penalties widen the cost gap. The Hou process—dominant in China—generates ammonium chloride as a co-product, which partially offsets production costs through fertilizer sales. Natural extraction's expansion from Wyoming and Türkiye is reshaping trade flows, with FOB Green River prices consistently undercutting CIF European synthetic costs by USD 40–60 per ton.

By Application

Segment Key Metric Primary Demand Driver
Glass Manufacturing ~55% of 2024 revenue Construction, automotive, solar glass
Detergents and Soaps ~18% of 2024 revenue Powdered detergent formulations
Water Treatment 5.34% CAGR (2026–2035) Municipal and industrial effluent standards
Chemicals and Metallurgy ~12% of 2024 revenue Sodium bicarbonate, lithium carbonate
Others ~15% of 2024 revenue Pulp and paper, flue gas desulfurization


Glass manufacturing chemicals demand constitutes the backbone of the Soda Ash Market, spanning flat glass for construction, container glass for food and beverage packaging, and specialty glass for electronics and solar panels. The segment's dominance is structural—each ton of float glass requires approximately 200 kg of sodium carbonate, and no commercially viable substitute exists at scale.

By End-User Industry

Segment Key Metric Primary Demand Driver
Building and Construction ~41% of 2024 revenue Architectural glazing, insulated glass units
Automotive ~14% of 2024 revenue Windshields, EV panoramic roofs
Renewable Energy 5.52% CAGR (2026–2035) Solar panel glass, sodium-ion batteries
Consumer Goods ~16% of 2024 revenue Detergent chemicals, personal care
Industrial Processing ~29% share of remaining revenue Chemical processing materials, metallurgy


Regional Market Share Analysis

Region Key Metric Primary Investment Themes
Asia-Pacific ~46% of 2024 volume Solar glass, construction glass, detergent chemicals
North America ~21% of 2024 volume Trona extraction, sodium-ion batteries
Europe 2.48% CAGR (2026–2035) CCUS retrofit, CBAM compliance
South America ~6% of 2024 volume Lithium processing, import substitution
Middle East & Africa 4.08% CAGR (2026–2035) Construction megaprojects, industrial diversification
Total 76.18 Million tons (2025)

The Soda Ash Market exhibits a concentrated geographic footprint, with Asia-Pacific and North America together commanding over two-thirds of global volume. Regional dynamics are shaped by the interplay of natural resource endowments, glass manufacturing chemicals demand intensity, and environmental regulation stringency.


North America

Country Key Metric Key Driver
US ~78% of regional volume Green River Basin trona, industrial alkali materials exports
Canada 2.62% CAGR Western Potash Co-Processing Synergies
Mexico ~8% of regional volume Container glass for beverage packaging


North America's position in the Soda Ash Market is anchored by Wyoming's trona reserves, which hold an estimated 100 billion tons of ore—enough for centuries of extraction. Tata Chemicals' operations at Green River and Genesis Energy's Granger complex supply both domestic glass manufacturing chemicals demand and growing export volumes to Brazil and India. The U.S. Department of Energy's 2024 designation of sodium-ion batteries as a critical clean-energy technology has catalyzed pilot-scale procurement contracts worth over 200,000 tons annually [15].

Europe

Country Key Metric Key Driver
Germany ~22% of regional volume Automotive glass, dense soda ash specification
UK 2.35% CAGR Tata Chemicals Northwich operations
France ~14% of regional share Solvay legacy plants, CCUS pilots
Italy ~11% of regional share Container glass for wine and food packaging
Spain 2.55% CAGR Solar glass capacity additions
Nordic Countries ~5% of regional share Water treatment chemicals applications
Russia ~15% of regional volume Bashkir Soda, domestic construction glass
Rest of Europe 2.20% CAGR Poland and Romania Solvay curtailments


Europe's Soda Ash Market is undergoing a structural transition as CBAM penalties compress Solvay-process margins. Ciech SA has announced a phased shutdown of 400,000 tons of annual capacity in Poland, while Solvay SA redirects capital toward CCUS-enabled sodium carbonate production at its French facilities. Spain's photovoltaic glass buildout—targeting 8 GW of new solar capacity annually—provides a counter-balancing demand uplift for dense soda ash [8].

Asia-Pacific

Country Key Metric Key Driver
China ~58% of regional volume Glass manufacturing chemicals, chemical processing materials
India 4.65% CAGR Tata Chemicals Mithapur, PLI-driven glass
Japan ~7% of regional share High-cullet container glass, specialty applications
South Korea 2.90% CAGR Display glass, sodium-ion battery R&D
ASEAN 3.82% CAGR Construction glass, detergent chemicals demand
Rest of Asia-Pacific ~4% of regional share Bangladesh and Sri Lanka detergent growth


The Asia-Pacific Soda Ash Market is dominated by China, where over 30 million tons of synthetic and natural capacity serve the world's largest float glass industry. Tangshan Sanyou and Shandong Haihua together operate more than 8 million tons of annual dense soda ash capacity. India's Tata Chemicals and GHCL Limited are expanding production at Mithapur and Sutrapada, respectively, targeting the domestic solar glass and industrial mineral chemicals segments that benefit from PLI subsidies [3].

South America

Country Key Metric Key Driver
Brazil ~68% of regional volume Container glass, Companhia Brasileira de Álcalis
Argentina 3.15% CAGR Lithium triangle sodium carbonate demand
Rest of South America ~12% of regional share Import-dependent detergent chemicals markets


South America's Soda Ash Market relies heavily on imports from the United States and Türkiye, as the region lacks large-scale natural trona deposits. Brazil's Companhia Brasileira de Álcalis supplies roughly 40% of domestic demand, with the balance sourced via Atlantic shipping routes. Argentina's lithium boom in Jujuy and Salta provinces is creating a new downstream channel for sodium carbonate as a precipitation reagent [9].

Middle East & Africa

Country Key Metric Key Driver
Saudi Arabia ~30% of regional volume NEOM and Red Sea Project glass demand
UAE 3.95% CAGR Urban construction, smart-city glazing
South Africa ~18% of regional share Botash operations, regional distribution
Egypt 3.60% CAGR New Administrative Capital construction
Rest of MEA ~22% of regional share Kenya Lake Magadi trona, Nigerian imports


The Middle East & Africa Soda Ash Market represents the fastest-growing regional corridor, fueled by construction megaprojects and industrial diversification strategies. Saudi Arabia's Vision 2030 program alone requires an estimated 2.5 million tons of flat glass through 2030, translating to over 600,000 tons of cumulative sodium carbonate demand. Kenya's Tata Chemicals Magadi operation remains Africa's only significant natural soda ash producer, exporting to South and East African detergent chemicals markets [10].


Soda Ash Market By Region, 2025-2035
 

Competitive Benchmarking

The Soda Ash Market exhibits medium concentration, with the top five producers accounting for an estimated 38–44% of global capacity. The Herfindahl-Hirschman Index sits in the 800–1,200 range, reflecting a competitive but consolidating field. WE Soda's acquisition of Genesis Alkali in 2024 compressed the competitive set, while Chinese producers maintain fragmented but collectively dominant capacity [4][18].

Company Est. Revenue Share Range Key Offerings Strategic Positioning
Solvay SA ~8–11% Dense and light soda ash, sodium bicarbonate European incumbent; CCUS retrofit strategy
Tata Chemicals Ltd ~7–10% Natural soda ash (Wyoming, Kenya), synthetic (India) Vertically integrated across three continents
Ciner Group ~6–9% Natural trona-based soda ash (Wyoming, Türkiye) Low-cost producer; capacity expansion focus
WE Soda (incl. Genesis Alkali) ~5–8% Solution-mined natural soda ash, dense grade Türkiye-based; post-merger scale advantages
GHCL Limited ~3–5% Synthetic soda ash, industrial alkali materials Indian domestic market leader; Sutrapada expansion
Tangshan Sanyou Group ~4–6% Solvay and Hou process, chemical processing materials China's largest single-site producer
Shandong Haihua Co. ~3–5% Dense soda ash, sodium bicarbonate Export-oriented Chinese producer
Ciech SA ~2–4% Synthetic soda ash, sodium carbonate specialties EU producer navigating CBAM transition
Nirma Limited ~2–4% Synthetic soda ash, detergent chemicals integration Backward-integrated Indian conglomerate
Sisecam Group ~3–5% Natural and synthetic soda ash, glass integration Vertically integrated Turkish glass-chemicals group


Recent News & Developments

  • WE Soda (March 2024): Completed acquisition of Genesis Alkali for USD 1.8 billion, creating the world's largest natural soda ash producer with combined capacity exceeding 8 million tons annually [4].
  • Ciner Group (June 2024): Broke ground on the 2.5 million ton Polatlı solution-mining facility in Türkiye, targeting first production by Q3 2027 and positioning Türkiye as the world's second-largest sodium carbonate exporter [4].
  • Tata Chemicals (September 2024): Announced a USD 450 million expansion at its Mithapur complex in Gujarat, adding 1 million tons of dense soda ash capacity to serve India's solar glass sector [3].
  • EU Commission (January 2025): Published final CBAM Phase 2 implementing rules, setting embedded carbon thresholds for inorganic chemical compounds, including soda ash at EUR 90 per ton of CO₂ equivalent [8].
  • CATL (April 2024): Commenced commercial shipments of first-generation sodium-ion battery cells from its Yichang facility, sourcing dense soda ash under long-term supply agreements [9].
  • GHCL Limited (November 2024): Completed debottlenecking at Sutrapada, raising annual capacity to 1.2 million tons and targeting water treatment chemicals end-users [12].
  • Sisecam Group (February 2025): Inaugurated a 600,000-ton natural soda ash facility at its Kazan site, integrated with existing glass manufacturing operations [18].


Soda Ash Market Report Scope

Parameter Details
Market Scope Global Soda Ash Market by Type, Source, Application, End-User, Geography
Study Period 2021–2035
CAGR 2.86% (2026–2035)
Market Size (2025) 76.18 Million tons
Market Size (2035) 109.42 Million tons
Fastest Growing Segments Water treatment (application); renewable energy (end-user); MEA (region)
Companies Profiled 10 (Solvay, Tata Chemicals, Ciner, WE Soda, GHCL, Tangshan Sanyou, Shandong Haihua, Ciech, Nirma, Sisecam)
Valuation Unit Volume (Million tons)


FAQs

How do soda ash procurement contracts typically structure pricing for glass manufacturers?

Most glass manufacturers secure 60–70% of sodium carbonate volumes through annual fixed-price contracts indexed to natural gas costs, with the remaining balance purchased on spot markets. This hybrid approach hedges energy-driven cost volatility while maintaining flexibility for seasonal demand swings.

What technical barriers prevent the full substitution of synthetic soda ash by natural trona extraction?

Trona deposits are geographically concentrated in Wyoming and Türkiye, limiting inland freight economics for buyers more than 1,500 km from mine-mouth [15]. Solvay-process plants remain competitive where co-product credits from calcium chloride or ammonium chloride offset higher energy costs.

How does the shift to sodium-ion batteries affect soda ash purity specifications?

Battery-grade sodium carbonate requires less than 50 ppm of iron and chloride impurities, which exceeds standard dense soda ash specifications by a factor of three [9]. Producers must invest in recrystallization and wash circuits, adding USD 20–30 per ton to production costs.

What role does soda ash play in carbon capture solvent regeneration?

Sodium carbonate solutions serve as low-cost CO₂ absorption media in post-combustion capture systems, competing with amine-based solvents [16]. Pilot programs at U.S. coal plants have demonstrated 85% capture rates using hot potassium carbonate derived from soda ash.

How are anti-dumping duties affecting global soda ash trade flows?

India's Directorate General of Trade Remedies imposed anti-dumping duties of USD 12–42 per ton on imports from Türkiye, Iran, and Pakistan in 2023 [3]. These duties redirected approximately 800,000 tons of annual trade toward domestic producers like Tata Chemicals and GHCL.

What quality differences exist between the Hou-process and Solvay-process sodium carbonate?

Hou-process soda ash typically contains higher ammonium chloride residues (200–400 ppm versus under 100 ppm for Solvay), limiting its suitability for pharmaceutical and food-grade glass applications. Dense grade from Hou plants requires additional washing steps before meeting export-quality specifications.

How might direct lithium extraction technologies reduce soda ash demand in lithium processing?

Direct lithium extraction bypasses the evaporation-precipitation step that consumes sodium carbonate, potentially displacing 30–40% of soda ash used in conventional brine processing by 2032 [9]. However, DLE adoption remains limited to pilot scale, and most Salar-based producers still rely on traditional precipitation circuits.


FAQs

What is the current valuation of the Soda Ash Market as of 2024?

The Soda Ash Market was valued at 17.76 USD Billion in 2024.

What is the projected market size for the Soda Ash Market in 2035?

The Soda Ash Market is projected to reach 25.01 USD Billion by 2035.

What is the expected CAGR for the Soda Ash Market during the forecast period 2025 - 2035?

The expected CAGR for the Soda Ash Market during the forecast period 2025 - 2035 is 3.16%.

Which companies are considered key players in the Soda Ash Market?

Key players in the Soda Ash Market include Solvay, Tata Chemicals, OCI, Ciner Resources, FMC Corporation, Nirma Limited, Shandong Haihua Group, Yuanfar Chemical, and Kuwait Chemical Industries Company.

What are the main applications of Soda Ash and their market valuations?

The main applications of Soda Ash include Glass Manufacturing (6.0 to 8.5 USD Billion), Detergents (3.0 to 4.5 USD Billion), and Chemical Manufacturing (4.0 to 5.5 USD Billion).

How does the market for Dense and Light Soda Ash compare?

The market for Dense Soda Ash ranges from 7.0 to 10.0 USD Billion, while Light Soda Ash ranges from 8.0 to 11.0 USD Billion.

What are the end-use segments for Soda Ash and their respective valuations?

End-use segments for Soda Ash include Construction (3.0 to 4.2 USD Billion), Automotive (2.5 to 3.5 USD Billion), and Food and Beverage (1.8 to 2.5 USD Billion).

What is the valuation range for Natural and Synthetic Soda Ash?

Natural Soda Ash is valued between 8.88 and 12.0 USD Billion, whereas Synthetic Soda Ash ranges from 8.88 to 13.01 USD Billion.

What trends are influencing the growth of the Soda Ash Market?

The growth of the Soda Ash Market appears to be influenced by increasing demand in glass manufacturing and construction sectors.

How does the Soda Ash Market's growth potential compare to other chemical markets?

The Soda Ash Market's growth potential, with a projected CAGR of 3.16%, suggests a steady increase, although it may vary compared to other chemical markets.

Author
Author
Author Profile
Chitranshi Jaiswal LinkedIn
Team Lead - Research
Chitranshi is a Team Leader in the Chemicals & Materials (CnM) and Energy & Power (EnP) domains, with 6+ years of experience in market research. She leads and mentors teams to deliver cross-domain projects that equip clients with actionable insights and growth strategies. She is skilled in market estimation, forecasting, competitive benchmarking, and both primary & secondary research, enabling her to turn complex data into decision-ready insights. An engineer and MBA professional, she combines technical expertise with strategic acumen to solve dynamic market challenges. Chitranshi has successfully managed projects that support market entry, investment planning, and competitive positioning, while building strong client relationships. Certified in Advanced Excel & Power BI she leverages data-driven approaches to ensure accuracy, clarity, and impactful outcomes.

Research Approach


Secondary Research

The secondary research process involved comprehensive analysis of regulatory databases, industry publications, chemical manufacturing reports, and authoritative industrial organizations. Key sources included the US Geological Survey (USGS), European Chemical Industry Council (Cefic), American Chemistry Council (ACC), International Council of Chemical Associations (ICCA), US Environmental Protection Agency (EPA), European Environment Agency (EEA), National Institute of Standards and Technology (NIST), China National Chemical Information Center (CNCIC), Indian Chemical Council (ICC), Brazilian Chemical Industry Association (ABIQUIM), OECD Chemical Safety Database, World Trade Organization (WTO) Trade Statistics, UN Comtrade Database, International Energy Agency (IEA) Energy Statistics, US Department of Commerce - Bureau of Industry and Security, European Commission - Eurostat Industrial Production Database, China Ministry of Industry and Information Technology (MIIT), India Ministry of Chemicals and Fertilizers, Glass Manufacturing Industry Council (GMIC), Soap and Detergent Association (SDA), and national mining and mineral resources departments from key producing regions. These sources were used to collect production statistics, trade flow data, environmental compliance standards, capacity utilization rates, and market landscape analysis for dense soda ash, light soda ash, natural soda ash from trona mining, and synthetic soda ash via the Solvay process.


Primary Research

Qualitative and quantitative insights were obtained by interviewing supply-side and demand-side stakeholders during the primary research process. Soda ash manufacturers, trona mining companies, and chemical processing facilities were among the supply-side sources, which included CEOs, VPs of Operations, plant managers, and commercial directors. Procurement heads from glass manufacturing facilities, detergent formulators, chemical production managers, construction material specialists, and automotive glass buyers from flat glass producers, container glass manufacturers, specialty chemical companies, and building materials suppliers comprised demand-side sources. The market segmentation was validated across glass manufacturing, detergents, chemical manufacturing, sodium bicarbonate production, and pulp & paper applications through primary research. Production capacity expansion timelines were confirmed, and insights were gathered on pricing dynamics, energy cost impacts, logistics optimization, and sustainability transition strategies.

Primary Respondent Breakdown:

By Designation: C-level Primaries (28%), Director Level (35%), Others (37%)

By Region: North America (32%), Europe (30%), Asia-Pacific (28%), Rest of World (10%)


Market Size Estimation

Global market valuation was derived through production capacity mapping and consumption volume analysis. The methodology included:

Identification of over 35 significant manufacturers in North America, Europe, Asia-Pacific, the Middle East, and Africa

Product mapping across dense soda ash, light soda ash, natural soda ash (trona-based), and synthetic soda ash (Solvay process) categories

Analysis of reported and modeled annual production capacities and revenues specific to soda ash portfolios

Coverage of manufacturers representing 75-80% of global production capacity in 2024

Extrapolation using bottom-up (consumption volume × ASP by application and region) and top-down (manufacturer revenue validation) approaches to derive segment-specific valuations for glass manufacturing, detergents, chemicals, sodium bicarbonate, and pulp & paper end-use segments

Download Free Sample

Kindly complete the form below to receive a free sample of this Report

Download PDF ×

We do not share your information with anyone. However, we may send you emails based on your report interest from time to time. You may contact us at any time to opt-out.