• Cat-intel
  • MedIntelliX
  • Resources
  • About Us
  • Hero Background
    English
    Chinese
    French
    Japanese
    Korean
    German
    Spanish

    Software Quality Assurance Market Share

    ID: MRFR/ICT/6914-HCR
    111 Pages
    Aarti Dhapte
    October 2025

    Software Quality Assurance Market Research Report Information by Solution (Supplier Quality Management, Non-Conformances/Corrective & Preventative, Change Management, Document Control, Audit Management, Complaint Handling, Calibration Management, Employee Training, Others), Deployment (Cloud, On-premise), Organization Size (Large Enterprise, Small & Medium-Sized Enterprise) - Forecast t...

    Share:
    Download PDF ×

    We do not share your information with anyone. However, we may send you emails based on your report interest from time to time. You may contact us at any time to opt-out.

    Software Quality Assurance Market Infographic
    $ 4,950.0
    $ 5,950.0
    $ 7,250.0

    Market Share

    Software Quality Assurance Market Share Analysis

    The SQA market is highly competitive, prompting firms to use a wide range of share (position) strategies to establish some niche position as part of the industry. These strategies are the shape of SQA market dynamics as per my latest update, so companies can set themselves apart and have a large portion of it. One widely used strategy in the SQA market is Differentiation through Specialization.

    Some companies, however, prefer to focus on sectors or specialised market segments such as healthcare industry and financial sector. Focusing on a specific industry, these companies gain deep domain expertise that enables them to understand the characteristics and compliance differences of their chosen market. By embarking on this specialization, not only do they stand out but also emerge as preferred providers among organizations that need customised and sector-specific SQA solutions.

    A cornerstone of the market share defensive strategy for companies in this SQA sector is Technology Integration. Using advanced technologies, including AI and ML in SQA services may help gain a competitive edge. AI and ML-based testing tools help improve efficiency, correctness, predictive evaluation in accordance with the industry’s call for high SQA standards. This technological convergence ensures that companies are innovators, capable of coming up with cutting-edge testing solutions to satisfy the fluctuating needs of organizations.

    Market share positioning with respect to the SQA market includes Strategic Partnerships and Collaborations. Organizations that enter strategic alliances with technology providers, industry-specific partners or consultant firms widen their capabilities. Such relationships allow SQA providers to provide a wider scope of services, penetrate new markets and utilize other core competencies.

    Partnering with leading individuals in the software development infrastructure improves market position and provides a comprehensive service package. A Customer-Centric Approach is a core strategy for taking market share in the SQA market. The companies that are focused on the client’s specific needs, provide individualized SQA solutions and have attentive customer care win customers for life. Satisfied customers result in repeat business and referrals that strengthen the company’s market standing as a reliable client-focused SQA partner.

    The two concepts of Innovation and Continuous Improvement lie at the core of effective market share positioning in the SQA sector. Companies that invest in R&D, stays abreast of the new developments, and makes updates to their testing procedures based on changing technologies are showing commitment towards innovation.

    Market Summary

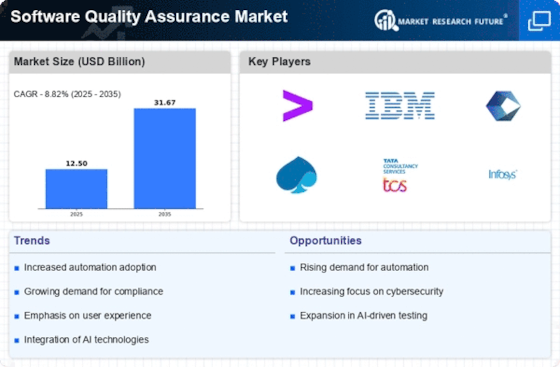
    As per Market Research Future Analysis, the Software Quality Assurance Market is projected to grow from USD 12.50 Billion in 2024 to USD 31.67 Billion by 2035, with a CAGR of 8.8% during the forecast period. The market was valued at USD 12.50 Billion in 2024. The increasing complexity of software necessitates rigorous testing to ensure quality, as poor software can disrupt operations. The demand for quality assurance is surging across various industries, particularly in telecommunications, driven by the need for reliable products and services. The COVID-19 pandemic initially hindered market growth due to production issues, but post-pandemic recovery is expected to bring new growth opportunities. Key challenges include data security concerns and a lack of expertise in managing software changes.

    Key Market Trends & Highlights

    The Software Quality Assurance Market is witnessing significant growth driven by technological advancements and increasing demand for error-free operations.

    • Market Size in 2024: USD 12.50 Billion; projected to reach USD 31.67 Billion by 2035. CAGR of 8.8% during the forecast period (2024 - 2032). Valued at USD 11.5 Billion in 2023, indicating a strong growth trajectory. Rising demand from telecommunications and IT sectors for quality assurance services.

    Market Size & Forecast

    2024 Market Size USD 12.50 Billion
    2035 Market Size USD 31.67 Billion
    CAGR 8.82%

    Major Players

    <p>A1QA, Sparta Systems, Digital Dream Forge, Performance Lab, Lighthouse Technologies, QA Consultants, Cognizant, Oracle Corporation, Microsoft, Siemens, Verse Solutions</p>

    Market Trends

    <p>The ongoing evolution of software development methodologies appears to drive an increasing emphasis on quality assurance practices, suggesting a critical need for organizations to adapt and enhance their testing frameworks to ensure software reliability and performance.</p>

    U.S. Department of Commerce

    Software Quality Assurance Market Market Drivers

    Market Growth Projections

    The Global Software Quality Assurance Market Industry is poised for substantial growth, with projections indicating a market value of 12.5 USD Billion in 2024 and an anticipated increase to 31.7 USD Billion by 2035. This growth trajectory suggests a robust compound annual growth rate (CAGR) of 8.82% from 2025 to 2035. The expansion of the market is driven by various factors, including technological advancements, increasing demand for quality assurance services, and the growing importance of regulatory compliance. As organizations continue to prioritize software quality, the market is likely to evolve, presenting new opportunities and challenges for stakeholders.

    Rising Cybersecurity Concerns

    Cybersecurity concerns are driving the Global Software Quality Assurance Market Industry as organizations recognize the critical need for secure software solutions. With the increasing frequency of cyberattacks, companies are prioritizing security testing as an integral part of their quality assurance processes. This focus on security not only protects sensitive data but also safeguards organizational reputation. As a result, investments in security-focused quality assurance practices are on the rise, contributing to the overall growth of the market. Organizations are likely to allocate more resources towards ensuring that their software is resilient against potential threats, further propelling the demand for quality assurance services.

    Regulatory Compliance and Standards

    Regulatory compliance remains a critical driver in the Global Software Quality Assurance Market Industry. As industries face increasing scrutiny from regulatory bodies, the need for robust quality assurance processes becomes essential. Organizations are compelled to adhere to standards such as ISO and CMMI, which necessitate comprehensive testing and validation of software products. This compliance not only mitigates legal risks but also enhances customer trust and satisfaction. Consequently, the market is likely to experience growth as companies invest in quality assurance to meet regulatory requirements, ensuring that their software solutions are reliable and compliant with industry standards.

    Technological Advancements in Testing Tools

    Technological advancements are significantly shaping the Global Software Quality Assurance Market Industry. The introduction of automation tools and artificial intelligence in testing processes enhances efficiency and accuracy. These innovations allow for faster test execution and improved defect detection, which are crucial in today’s fast-paced software development environments. As organizations adopt these advanced tools, the market is expected to expand, with a projected CAGR of 8.82% from 2025 to 2035. This growth is indicative of a broader trend towards integrating sophisticated technologies into quality assurance practices, enabling companies to deliver high-quality software products more efficiently.

    Growing Adoption of Agile and DevOps Methodologies

    The adoption of Agile and DevOps methodologies is transforming the Global Software Quality Assurance Market Industry. These frameworks emphasize continuous integration and delivery, necessitating a shift in quality assurance practices to keep pace with rapid development cycles. As organizations embrace these methodologies, the demand for integrated quality assurance solutions that can operate within Agile and DevOps environments is increasing. This trend is expected to contribute to the market's growth, with projections indicating a rise to 31.7 USD Billion by 2035. The alignment of quality assurance with development processes is becoming a strategic imperative for organizations aiming to enhance software quality and speed to market.

    Increasing Demand for Software Quality Assurance Services

    The Global Software Quality Assurance Market Industry is witnessing a surge in demand for quality assurance services as organizations increasingly prioritize software reliability and performance. In 2024, the market is projected to reach 12.5 USD Billion, reflecting a growing recognition of the importance of quality assurance in software development. Companies are investing in comprehensive testing strategies to mitigate risks associated with software failures. This trend is particularly evident in sectors such as finance and healthcare, where software reliability is paramount. As businesses strive for competitive advantage, the emphasis on quality assurance is likely to intensify, driving further growth in the industry.

    Market Segment Insights

    Regional Insights

    Key Companies in the Software Quality Assurance Market market include

    Industry Developments

    The key players of the market are developing a hybrid software quality insurance technology that can make quick and reliable tests.

    The key players are increasing security standards of the market. It will reduce security issues in the market.

    The key players are expanding their production in emerging economies. Middle East and South America are regions that will have higher penetration.

    Future Outlook

    Software Quality Assurance Market Future Outlook

    <p>The Software Quality Assurance Market is projected to grow at 8.82% CAGR from 2025 to 2035, driven by increasing software complexity, demand for automation, and <a href="https://www.marketresearchfuture.com/reports/regulatory-reporting-and-compliance-market-26177">regulatory compliance</a>.</p>

    New opportunities lie in:

    • <p>Invest in AI-driven testing tools to enhance efficiency and accuracy. Develop specialized QA solutions for emerging technologies like IoT and blockchain. Expand services to include continuous testing and <a href="https://www.marketresearchfuture.com/reports/devops-market-6518">DevOps</a> integration for agile methodologies.</p>

    <p>By 2035, the Software Quality Assurance Market is expected to be robust, reflecting substantial growth and innovation.</p>

    Market Segmentation

    By Region

    • Europe
    • North America
    • Asia pacific

    By Vertical

    • IT
    • Telecom
    • Consumer goods
    • Defense
    • Aerospace
    • Manufacturing
    • Consumer goods
    • Retail

    By Deployment

    • Cloud
    • On premise

    By Organization

    • Small scale
    • Large scale

    The key players of the software quality assurance market are

    • A1QA
    • Sparta Systems
    • Digital Dream Forge
    • Performance Lab
    • Lighthouse Technologies
    • QA Consultants
    • Cognizant
    • Oracle Corporation
    • Microsoft
    • Siemens
    • Verse solutions

    Report Scope

    Report Attribute/Metric Details
    Market Size 2024  USD 12.5 billion
    Market Size 2035 31.67 ( Value (USD Billion))
    Compound Annual Growth Rate (CAGR) 8.82% (2025 - 2035)
    Base Year 2024
    Market Forecast Period 2025 - 2035
    Historical Data  2018 & 2020
    Market Forecast Units  Value (USD Billion)
    Report Coverage  Revenue Forecast, Competitive Landscape,   Growth Factors, and Trends
    Segments Covered  Solution, Development
    Geographies Covered  North America, Europe, Asia-Pacific
    Key Companies Profiled  A1QA Sparta Systems Digital Dream Forge Performance Lab Lighthouse Technologies QA Consultants Cognizant Oracle Corporation Microsoft Siemens Verse solutions
    Key Market Opportunities  Need for organization effectives will lead to high investments for the software quality assurance market.
    Key Market Dynamics  Quality assurance tasks are getting higher.
    Market Size 2025 13.60 ( Value (USD Billion))

    Market Highlights

    Author

    Aarti Dhapte
    Team Lead - Research

    She holds an experience of about 6+ years in market research and business consulting, working under the spectrum of information communication technology, telecommunications and semiconductor domains. aarti conceptualizes and implements a scalable business strategy and provides strategic leadership to the clients. her expertise lies in market estimation, competitive intelligence, pipeline analysis, customer assessment, etc.

    Leave a Comment

    Latest Comments

    John Doe
    john@example.com

    This is a great article! Really helped me understand the topic better.

    Posted on July 23, 2025, 10:15 AM
    Jane Smith
    jane@domain.com

    Thanks for sharing this. I’ve bookmarked it for later reference.

    Posted on July 22, 2025, 7:45 PM

    FAQs

    How much is the market expected to be valued at by 2032?

    By 2032, the valuation of the market is expected to reach USD 24.6 Bn.

    What are the segments of the market based on solution?

    The solution-based segments of the market are supplier quality management, change management, document control, non-conformances/corrective &amp; preventative, audit management, complaint handling, employee training, calibration management, and others.

    What CAGR is the market expected to register?

    The market is expected to strike 8.8% CAGR.

    Which regions are anticipated to hold the largest and the second-largest share of the market?

    North America and Europe are presumed to account for the pole position and second position in the global market place.

    Which country-level market is expected to lead North America?

    The U.S. is anticipated to lead North America during the assessment period.

    1. --- "Table of Contents
    2.     Executive Summary
      1.     Market Attractiveness Analysis
        1.     Global Software Quality Assurance Market, by Solution
        2.     Global Software Quality Assurance Market, by Deployment
        3.     Global Software Quality Assurance Market, by Organization Size
        4.     Global Software Quality Assurance Market, by Vertical
        5.     Global Software Quality Assurance Market, by Region
    3.     Market Introduction
      1.     Definition
      2.     Scope of the Study
      3.     Market Structure
    4.     Research Methodology
      1.     Research Process
      2.     Primary Research
      3.     Secondary Research
      4.     Market Size Estimation
      5.     Forecast Deployment
      6.     List of Assumptions
    5.     MARKET DYNAMICS
      1.     Introduction
      2.     Drivers
        1.     Growing need to increase organizational effectiveness
        2.     Growing demand to reduce the total cost of production by improving quality
      3.     Restraints
        1.     Security threats involved in cloud-based platforms
      4.     Opportunities
        1.     Increasing demand across Deployments
        2.     Implementation of advanced technologies for quality assurance
    6.     MARKET FACTOR ANALYSIS
      1.     Value Chain Analysis/Supply Chain Analysis
      2.     Porter’s Five Forces Deployment
        1.     Bargaining Power of Suppliers
        2.     Bargaining Power of Buyers
        3.     Threat of New Entrants
        4.     Threat of Substitutes
        5.     Intensity of Rivalry
    7.     GLOBAL SOFTWARE QUALITY ASSURANCE MARKET, BY SOLUTION 
      1.     Introduction
      2.     Supplier Quality Management
      3.     Non-Conformances/Corrective & Preventative
      4.     Change Management
      5.     Document Control
      6.     Audit Management
      7.     Complaint Handling
      8.     Calibration Management
      9.     Employee Training
      10.     Others
    8.     GLOBAL SOFTWARE QUALITY ASSURANCE MARKET, BY DEPLOYMENT 
      1.     Introduction
      2.     Cloud
      3.     On-premise
    9.     GLOBAL SOFTWARE QUALITY ASSURANCE MARKET, BY ORGANIZATION SIZE 
      1.     Introduction
      2.     Small and Medium-Sized Enterprises
      3.     Large Enterprises
    10.     GLOBAL SOFTWARE QUALITY ASSURANCE MARKET, BY VERTICAL 
      1.     Introduction
      2.     IT & Telecom
      3.     Defense & Aerospace
      4.     Transportation & Logistics
      5.     Healthcare
      6.     Manufacturing
      7.     Consumer Goods & Retail
      8.     Others
    11.     GLOBAL SOFTWARE QUALITY ASSURANCE MARKET, BY REGION
      1.     Overview
      2.     North America
        1.     US
        2.     Canada
        3.     Mexico
      3.     Europe
        1.     Germany
        2.     UK
        3.     France
        4.     Rest of Europe
      4.     Asia Pacific
        1.     China
        2.     Japan
        3.     India
        4.     Rest of Asia-Pacific
      5.     Middle East & Africa
      6.     South America
    12.     Competitive Landscape
      1.     Introduction
      2.     Competitive Benchmarking
      3.     Key Developments & Growth Strategies
      4.     Vendor Share Analysis
    13.     COMPANY PROFILES
      1.     Microsoft Corporation
        1.     Company Overview
        2.     Financial Overview
        3.     Products/Solutions/Deployments Offered
        4.     Key Developments
        5.     SWOT Analysis
        6.     Key Strategies
      2.     Oracle Corporation
        1.     Company Overview
        2.     Financial Overview
        3.     Products/Solutions/Deployments Offered
        4.     Key Developments
        5.     SWOT Analysis
        6.     Key Strategies
      3.     Siemens AG
        1.     Company Overview
        2.     Financial Overview
        3.     Products/Solutions/Deployments Offered
        4.     Key Developments
        5.     SWOT Analysis
        6.     Key Strategies
      4.     Iqms, Inc.
        1.     Company Overview
        2.     Financial Overview
        3.     Products/Solutions/Deployments Offered
        4.     Key Developments
        5.     SWOT Analysis
        6.     Key Strategies
      5.     MetricStream, Inc.
        1.     Company Overview
        2.     Financial Overview
        3.     Products/Solutions/Deployments Offered
        4.     Key Developments
        5.     SWOT Analysis
        6.     Key Strategies
      6.     Pilgrim Quality Solution, Inc.
        1.     Company Overview
        2.     Financial Overview
        3.     Products/Solutions/Deployments Offered
        4.     Key Developments
        5.     SWOT Analysis
        6.     Key Strategies
      7.     Unipoint Software, Inc.
        1.     Company Overview
        2.     Financial Overview
        3.     Products/Solutions/Deployments Offered
        4.     Key Developments
        5.     SWOT Analysis
        6.     Key Strategies
      8.     EtQ Management Consultants, Inc.
        1.     Company Overview
        2.     Financial Overview
        3.     Products/Solutions/Deployments Offered
        4.     Key Developments
        5.     SWOT Analysis
        6.     Key Strategies
      9.     Verse Solutions, Inc.
        1.     Company Overview
        2.     Financial Overview
        3.     Products/Solutions/Deployments Offered
        4.     Key Developments
        5.     SWOT Analysis
        6.     Key Strategies
      10.     Cority Software Inc.
        1.     Company Overview
        2.     Financial Overview
        3.     Products/Solutions/Deployments Offered
        4.     Key Developments
        5.     SWOT Analysis
        6.     Key Strategies
      11.     Enablon (Wolters Kluwer N.V.)
        1.     Company Overview
        2.     Financial Overview
        3.     Products/Solutions/Deployments Offered
        4.     Key Developments
        5.     SWOT Analysis
        6.     Key Strategies
      12.     QT9 Software
        1.     Company Overview
        2.     Financial Overview
        3.     Products/Solutions/Deployments Offered
        4.     Key Developments
        5.     SWOT Analysis
        6.     Key Strategies
      13.     Biovia Corp (Dassault Systemes SE)
        1.     Company Overview
        2.     Financial Overview
        3.     Products/Solutions/Deployments Offered
        4.     Key Developments
        5.     SWOT Analysis
        6.     Key Strategies
      14.     SAP SE
        1.     Company Overview
        2.     Financial Overview
        3.     Products/Solutions/Deployments Offered
        4.     Key Developments
        5.     SWOT Analysis
        6.     Key Strategies
      15.     Sparta Systems Inc.
        1.     Company Overview
        2.     Financial Overview
        3.     Products/Solutions/Deployments Offered
        4.     Key Developments
        5.     SWOT Analysis
        6.     Key Strategies
    14.  
    15. List of Tables and Figures
      1. LIST OF TABLES
      2. TABLE 1    LIST OF ASSUMPTIONS
      3. TABLE 2    GLOBAL SOFTWARE QUALITY ASSURANCE MARKET, BY SOLUTION, 2020–2027 (USD MILLION)
      4. TABLE 3    GLOBAL SOFTWARE QUALITY ASSURANCE MARKET, BY DEPLOYMENT, 2020–2027 (USD MILLION)
      5. TABLE 4    GLOBAL SOFTWARE QUALITY ASSURANCE MARKET, BY ORGANIZATION SIZE, 2020–2027 (USD MILLION)
      6. TABLE 6    GLOBAL SOFTWARE QUALITY ASSURANCE MARKET, BY VERTICAL, 2020–2027 (USD MILLION)
      7. TABLE 7    GLOBAL SOFTWARE QUALITY ASSURANCE MARKET, BY REGION, 2020–2027 (USD MILLION)
      8. TABLE 8    NORTH AMERICA: SOFTWARE QUALITY ASSURANCE MARKET, BY COUNTRY, 2020–2027 (USD MILLION)
      9. TABLE 9    NORTH AMERICA: SOFTWARE QUALITY ASSURANCE MARKET, BY SOLUTION, 2020–2027 (USD MILLION)
      10. TABLE 10    NORTH AMERICA: SOFTWARE QUALITY ASSURANCE MARKET, BY DEPLOYMENT, 2020–2027 (USD MILLION)
      11. TABLE 11    NORTH AMERICA: SOFTWARE QUALITY ASSURANCE MARKET, BY ORGANIZATION SIZE, 2020–2027 (USD MILLION)
      12. TABLE 13    NORTH AMERICA: SOFTWARE QUALITY ASSURANCE MARKET, BY VERTICAL, 2020–2027 (USD MILLION)
      13. TABLE 14    US: SOFTWARE QUALITY ASSURANCE MARKET, BY SOLUTION, 2020–2027 (USD MILLION)
      14. TABLE 15    US: SOFTWARE QUALITY ASSURANCE MARKET, BY DEPLOYMENT, 2020–2027 (USD MILLION)
      15. TABLE 16    US: SOFTWARE QUALITY ASSURANCE MARKET, BY ORGANIZATION SIZE, 2020–2027 (USD MILLION)
      16. TABLE 18    US: SOFTWARE QUALITY ASSURANCE MARKET, BY VERTICAL, 2020–2027 (USD MILLION)
      17. TABLE 19    CANADA: SOFTWARE QUALITY ASSURANCE MARKET, BY SOLUTION, 2020–2027 (USD MILLION)
      18. TABLE 20    CANADA: SOFTWARE QUALITY ASSURANCE MARKET, BY DEPLOYMENT, 2020–2027 (USD MILLION)
      19. TABLE 21    CANADA: SOFTWARE QUALITY ASSURANCE MARKET, BY ORGANIZATION SIZE, 2020–2027 (USD MILLION)
      20. TABLE 23    CANADA: SOFTWARE QUALITY ASSURANCE MARKET, BY VERTICAL, 2020–2027 (USD MILLION)
      21. TABLE 24    MEXICO: SOFTWARE QUALITY ASSURANCE MARKET, BY SOLUTION, 2020–2027 (MEXICOD MILLION)
      22. TABLE 25    MEXICO: SOFTWARE QUALITY ASSURANCE MARKET, BY DEPLOYMENT, 2020–2027 (MEXICOD MILLION)
      23. TABLE 26    MEXICO: SOFTWARE QUALITY ASSURANCE MARKET, BY ORGANIZATION SIZE, 2020–2027 (MEXICOD MILLION)
      24. TABLE 28    MEXICO: SOFTWARE QUALITY ASSURANCE MARKET, BY VERTICAL, 2020–2027 (MEXICOD MILLION)
      25. TABLE 29    EUROPE: SOFTWARE QUALITY ASSURANCE MARKET, BY COUNTRY, 2020–2027 (USD MILLION)
      26. TABLE 30    EUROPE: SOFTWARE QUALITY ASSURANCE MARKET, BY SOLUTION, 2020–2027 (USD MILLION)
      27. TABLE 31    EUROPE: SOFTWARE QUALITY ASSURANCE MARKET, BY DEPLOYMENT, 2020–2027 (USD MILLION)
      28. TABLE 32    EUROPE: SOFTWARE QUALITY ASSURANCE MARKET, BY ORGANIZATION SIZE, 2020–2027 (USD MILLION)
      29. TABLE 34    EUROPE: SOFTWARE QUALITY ASSURANCE MARKET, BY VERTICAL, 2020–2027 (USD MILLION)
      30. TABLE 35    UK: SOFTWARE QUALITY ASSURANCE MARKET, BY SOLUTION, 2020–2027 (USD MILLION)
      31. TABLE 36    UK: SOFTWARE QUALITY ASSURANCE MARKET, BY DEPLOYMENT, 2020–2027 (USD MILLION)
      32. TABLE 37    UK: SOFTWARE QUALITY ASSURANCE MARKET, BY ORGANIZATION SIZE, 2020–2027 (USD MILLION)
      33. TABLE 39    UK: SOFTWARE QUALITY ASSURANCE MARKET, BY VERTICAL, 2020–2027 (USD MILLION)
      34. TABLE 40    GERMANY: SOFTWARE QUALITY ASSURANCE MARKET, BY SOLUTION, 2020–2027 (USD MILLION)
      35. TABLE 41    GERMANY: SOFTWARE QUALITY ASSURANCE MARKET, BY DEPLOYMENT, 2020–2027 (USD MILLION)
      36. TABLE 42    GERMANY: SOFTWARE QUALITY ASSURANCE MARKET, BY ORGANIZATION SIZE, 2020–2027 (USD MILLION)
      37. TABLE 44    GERMANY: SOFTWARE QUALITY ASSURANCE MARKET, BY VERTICAL, 2020–2027 (USD MILLION)
      38. TABLE 45    FRANCE: SOFTWARE QUALITY ASSURANCE MARKET, BY SOLUTION, 2020–2027 (USD MILLION)
      39. TABLE 46    FRANCE: SOFTWARE QUALITY ASSURANCE MARKET, BY DEPLOYMENT, 2020–2027 (USD MILLION)
      40. TABLE 47    FRANCE: SOFTWARE QUALITY ASSURANCE MARKET, BY ORGANIZATION SIZE, 2020–2027 (USD MILLION)
      41. TABLE 49    FRANCE: SOFTWARE QUALITY ASSURANCE MARKET, BY VERTICAL, 2020–2027 (USD MILLION)
      42. TABLE 50    REST OF EUROPE: SOFTWARE QUALITY ASSURANCE MARKET, BY SOLUTION, 2020–2027 (USD MILLION)
      43. TABLE 51    REST OF EUROPE: SOFTWARE QUALITY ASSURANCE MARKET, BY DEPLOYMENT, 2020–2027 (USD MILLION)
      44. TABLE 52    REST OF EUROPE: SOFTWARE QUALITY ASSURANCE MARKET, BY ORGANIZATION SIZE, 2020–2027 (USD MILLION)
      45. TABLE 54    REST OF EUROPE: SOFTWARE QUALITY ASSURANCE MARKET, BY VERTICAL, 2020–2027 (USD MILLION)
      46. TABLE 55    ASIA-PACIFIC: SOFTWARE QUALITY ASSURANCE MARKET, BY COUNTRY, 2020–2027 (USD MILLION)
      47. TABLE 56    ASIA-PACIFIC: SOFTWARE QUALITY ASSURANCE MARKET, BY SOLUTION, 2020–2027 (USD MILLION)
      48. TABLE 57    ASIA-PACIFIC: SOFTWARE QUALITY ASSURANCE MARKET, BY DEPLOYMENT, 2020–2027 (USD MILLION)
      49. TABLE 58    ASIA-PACIFIC: SOFTWARE QUALITY ASSURANCE MARKET, BY ORGANIZATION SIZE, 2020–2027 (USD MILLION)
      50. TABLE 60    ASIA-PACIFIC: SOFTWARE QUALITY ASSURANCE MARKET, BY VERTICAL, 2020–2027 (USD MILLION)
      51. TABLE 61    CHINA: SOFTWARE QUALITY ASSURANCE MARKET, BY SOLUTION, 2020–2027 (USD MILLION)
      52. TABLE 62    CHINA: SOFTWARE QUALITY ASSURANCE MARKET, BY DEPLOYMENT, 2020–2027 (USD MILLION)
      53. TABLE 63    CHINA: SOFTWARE QUALITY ASSURANCE MARKET, BY ORGANIZATION SIZE, 2020–2027 (USD MILLION)
      54. TABLE 65    CHINA: SOFTWARE QUALITY ASSURANCE MARKET, BY VERTICAL, 2020–2027 (USD MILLION)
      55. TABLE 66    INDIA: SOFTWARE QUALITY ASSURANCE MARKET, BY SOLUTION, 2020–2027 (USD MILLION)
      56. TABLE 67    INDIA: SOFTWARE QUALITY ASSURANCE MARKET, BY DEPLOYMENT, 2020–2027 (USD MILLION)
      57. TABLE 68    INDIA: SOFTWARE QUALITY ASSURANCE MARKET, BY ORGANIZATION SIZE, 2020–2027 (USD MILLION)
      58. TABLE 70    INDIA: SOFTWARE QUALITY ASSURANCE MARKET, BY VERTICAL, 2020–2027 (USD MILLION)
      59. TABLE 71    JAPAN: SOFTWARE QUALITY ASSURANCE MARKET, BY SOLUTION, 2020–2027 (USD MILLION)
      60. TABLE 72    JAPAN: SOFTWARE QUALITY ASSURANCE MARKET, BY DEPLOYMENT, 2020–2027 (USD MILLION)
      61. TABLE 73    JAPAN: SOFTWARE QUALITY ASSURANCE MARKET, BY ORGANIZATION SIZE, 2020–2027 (USD MILLION)
      62. TABLE 75    JAPAN: SOFTWARE QUALITY ASSURANCE MARKET, BY VERTICAL, 2020–2027 (USD MILLION)
      63. TABLE 76    REST OF ASIA-PACIFIC: SOFTWARE QUALITY ASSURANCE MARKET, BY SOLUTION, 2020–2027 (USD MILLION)
      64. TABLE 77    REST OF ASIA-PACIFIC: SOFTWARE QUALITY ASSURANCE MARKET, BY DEPLOYMENT, 2020–2027 (USD MILLION)
      65. TABLE 78    REST OF ASIA-PACIFIC: SOFTWARE QUALITY ASSURANCE MARKET, BY ORGANIZATION SIZE, 2020–2027 (USD MILLION)
      66. TABLE 80    REST OF ASIA-PACIFIC: SOFTWARE QUALITY ASSURANCE MARKET, BY VERTICAL, 2020–2027 (USD MILLION)
      67. TABLE 81    MIDDLE EAST AND AFRICA: SOFTWARE QUALITY ASSURANCE MARKET, BY SOLUTION, 2020–2027 (USD MILLION)
      68. TABLE 82    MIDDLE EAST AND AFRICA: SOFTWARE QUALITY ASSURANCE MARKET, BY DEPLOYMENT, 2020–2027 (USD MILLION)
      69. TABLE 83    MIDDLE EAST AND AFRICA: SOFTWARE QUALITY ASSURANCE MARKET, BY ORGANIZATION SIZE, 2020–2027 (USD MILLION)
      70. TABLE 85    MIDDLE EAST AND AFRICA: SOFTWARE QUALITY ASSURANCE MARKET, BY VERTICAL, 2020–2027 (USD MILLION)
      71. TABLE 86    SOUTH AMERICA: SOFTWARE QUALITY ASSURANCE MARKET, BY SOLUTION, 2020–2027 (USD MILLION)
      72. TABLE 87    SOUTH AMERICA: SOFTWARE QUALITY ASSURANCE MARKET, BY DEPLOYMENT, 2020–2027 (USD MILLION)
      73. TABLE 88    SOUTH AMERICA: SOFTWARE QUALITY ASSURANCE MARKET, BY ORGANIZATION SIZE, 2020–2027 (USD MILLION)
      74. TABLE 90    SOUTH AMERICA: SOFTWARE QUALITY ASSURANCE MARKET, BY VERTICAL, 2020–2027 (USD MILLION)     LIST OF FIGURES
      75. FIGURE 1    MARKET SYNOPSIS
      76. FIGURE 2    RESEARCH PROCESS OF MRFR
      77. FIGURE 3    TOP DOWN & BOTTOM UP APPROACH
      78. FIGURE 4    GLOBAL SOFTWARE QUALITY ASSURANCE MARKET, BY SOLUTION, 2020–2027 (USD MILLION)
      79. FIGURE 5    GLOBAL SOFTWARE QUALITY ASSURANCE MARKET, BY DEPLOYMENT, 2020–2027 (USD MILLION)
      80. FIGURE 6    GLOBAL SOFTWARE QUALITY ASSURANCE MARKET, BY ORGANIZATION SIZE, 2020–2027 (USD MILLION)
      81. FIGURE 8    GLOBAL SOFTWARE QUALITY ASSURANCE MARKET, BY VERTICAL, 2020–2027 (USD MILLION)
      82. FIGURE 9    GLOBAL SOFTWARE QUALITY ASSURANCE MARKET, BY REGION, 2020–2027 (USD MILLION)
      83. FIGURE 10    GLOBAL SOFTWARE QUALITY ASSURANCE MARKET, BY REGION, 2020–2027 (USD MILLION)
      84. FIGURE 11    NORTH AMERICA: SOFTWARE QUALITY ASSURANCE MARKET, BY COUNTRY, 2020–2027 (USD MILLION)
      85. FIGURE 12    NORTH AMERICA: SOFTWARE QUALITY ASSURANCE MARKET, BY SOLUTION, 2020–2027 (USD MILLION)
      86. FIGURE 13    NORTH AMERICA: SOFTWARE QUALITY ASSURANCE MARKET, BY DEPLOYMENT, 2020–2027 (USD MILLION)
      87. FIGURE 14    NORTH AMERICA: SOFTWARE QUALITY ASSURANCE MARKET, BY ORGANIZATION SIZE, 2020–2027 (USD MILLION)
      88. FIGURE 16    NORTH AMERICA: SOFTWARE QUALITY ASSURANCE MARKET, BY VERTICAL, 2020–2027 (USD MILLION)
      89. FIGURE 17    EUROPE: SOFTWARE QUALITY ASSURANCE MARKET, BY COUNTRY, 2020–2027 (USD MILLION)
      90. FIGURE 18    EUROPE: SOFTWARE QUALITY ASSURANCE MARKET, BY SOLUTION, 2020–2027 (USD MILLION)
      91. FIGURE 19    EUROPE: SOFTWARE QUALITY ASSURANCE MARKET, BY DEPLOYMENT, 2020–2027 (USD MILLION)
      92. FIGURE 20    EUROPE: SOFTWARE QUALITY ASSURANCE MARKET, BY ORGANIZATION SIZE, 2020–2027 (USD MILLION)
      93. FIGURE 22    EUROPE: SOFTWARE QUALITY ASSURANCE MARKET, BY VERTICAL, 2020–2027 (USD MILLION)
      94. FIGURE 23    ASIA-PACIFIC: SOFTWARE QUALITY ASSURANCE MARKET, BY COUNTRY, 2020–2027 (USD MILLION)
      95. FIGURE 24    ASIA-PACIFIC: SOFTWARE QUALITY ASSURANCE MARKET, BY SOLUTION, 2020–2027 (USD MILLION)
      96. FIGURE 25    ASIA-PACIFIC: SOFTWARE QUALITY ASSURANCE MARKET, BY DEPLOYMENT, 2020–2027 (USD MILLION)
      97. FIGURE 26    ASIA-PACIFIC: SOFTWARE QUALITY ASSURANCE MARKET, BY ORGANIZATION SIZE, 2020–2027 (USD MILLION)
      98. FIGURE 28    ASIA-PACIFIC: SOFTWARE QUALITY ASSURANCE MARKET, BY VERTICAL, 2020–2027 (USD MILLION)
      99. FIGURE 29    MIDDLE EAST & AFRICA: SOFTWARE QUALITY ASSURANCE MARKET, BY SOLUTION, 2020–2027 (USD MILLION)
      100. FIGURE 30    MIDDLE EAST & AFRICA: SOFTWARE QUALITY ASSURANCE MARKET, BY DEPLOYMENT, 2020–2027 (USD MILLION)
      101. FIGURE 31    MIDDLE EAST & AFRICA: SOFTWARE QUALITY ASSURANCE MARKET, BY ORGANIZATION SIZE, 2020–2027 (USD MILLION)
      102. FIGURE 33    MIDDLE EAST & AFRICA: SOFTWARE QUALITY ASSURANCE MARKET, BY VERTICAL, 2020–2027 (USD MILLION)
      103. FIGURE 34    SOUTH AMERICA: SOFTWARE QUALITY ASSURANCE MARKET, BY SOLUTION, 2020–2027 (USD MILLION)
      104. FIGURE 35    SOUTH AMERICA: SOFTWARE QUALITY ASSURANCE MARKET, BY DEPLOYMENT, 2020–2027 (USD MILLION)
      105. FIGURE 36    SOUTH AMERICA: SOFTWARE QUALITY ASSURANCE MARKET, BY ORGANIZATION SIZE, 2020–2027 (USD MILLION)
      106. FIGURE 38    SOUTH AMERICA: SOFTWARE QUALITY ASSURANCE MARKET, BY VERTICAL, 2020–2027 (USD MILLION)"

    Software Quality Assurance Market Segmentation

    Market Segmentation Overview

    • Detailed segmentation data will be available in the full report
    • Comprehensive analysis by multiple parameters
    • Regional and country-level breakdowns
    • Market size forecasts by segment
    Infographic

    Free Sample Request

    Kindly complete the form below to receive a free sample of this Report

    Get Free Sample

    Customer Strories

    “I am very pleased with how market segments have been defined in a relevant way for my purposes (such as "Portable Freezers & refrigerators" and "last-mile"). In general the report is well structured. Thanks very much for your efforts.”

    Victoria Milne

    Founder
    Case Study
    Chemicals and Materials