Spectral Computed Tomography Market Share
Spectral Computed Tomography Market Research Report Information by Application (Oncology, Cardiology, Musculoskeletal Disorders and Gastrointestinal Diseases), End User (Diagnostic Centers and Hospitals & Clinics) and Region (Americas, Europe, Asia-Pacific and the Middle East & Africa) - Forecast till 2035

Market Summary
As per Market Research Future Analysis, the Global Spectral Computed Tomography (CT) Market was valued at USD 8.0 Billion in 2023 and is projected to grow to USD 17.2 Billion by 2032, with a CAGR of 8.00% from 2024 to 2032. The market growth is driven by the increasing prevalence of diseases such as neurological disorders, cancer, and cardiac diseases, alongside advancements in healthcare IT and diagnostic technologies. Notable developments include Philips' launch of the Spectral Angio CT suite and MARS Bioimaging's partnership with HSS to enhance musculoskeletal imaging. The market is segmented by application, end-users, and regions, with oncology expected to dominate the application segment. The Asia Pacific region is anticipated to hold the largest market share due to rising disease prevalence and an aging population.
Key Market Trends & Highlights
Key trends influencing the Spectral Computed Tomography market include technological advancements and strategic partnerships.
- Market Size in 2023: USD 8.0 Billion
- Projected Market Size by 2032: USD 17.2 Billion
- CAGR from 2024 to 2032: 8.00%
- Largest Regional Market Share: Asia Pacific
Market Size & Forecast
2023 Market Size | USD 8.0 Billion |
2024 Market Size | USD 8.8 Billion |
2032 Market Size | USD 17.2 Billion |
CAGR (2024-2032) | 8.00% |
Major Players
General Electric Company (US), Koninklijke Philips N.V. (Amsterdam, Netherlands), MARS Bioimaging Ltd (Christchurch, New Zealand), Neusoft Corporation (China), Shenzhen Anke High-tech Co., Ltd (China), Siemens (UK), PerkinElmer Inc. (Waltham, Massachusetts)
Market Trends
The increasing adoption of advanced imaging technologies, including spectral computed tomography, is poised to enhance diagnostic accuracy and patient outcomes in the healthcare sector.
U.S. Food and Drug Administration (FDA)
Spectral Computed Tomography Market Market Drivers
Market Growth Projections
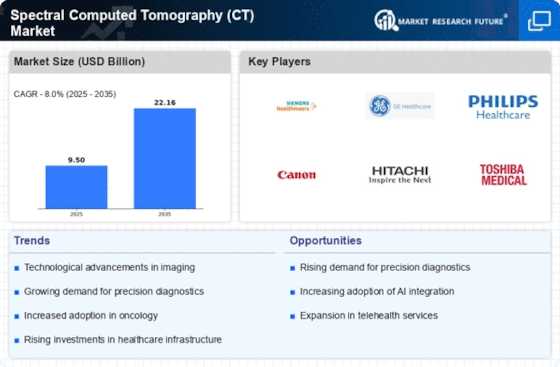
The Global Spectral Computed Tomography (CT) Market Industry is projected to experience substantial growth over the coming years. With a market value expected to reach 8.8 USD Billion in 2024 and further expand to 21.7 USD Billion by 2035, the industry is on a robust upward trajectory. This growth is underpinned by a compound annual growth rate (CAGR) of 8.54% from 2025 to 2035, indicating a strong demand for advanced imaging technologies. The increasing prevalence of chronic diseases, technological advancements, and supportive regulatory environments are key factors contributing to this growth. As the market evolves, it is likely to attract further investment and innovation.
Technological Advancements
The Global Spectral Computed Tomography (CT) Market Industry is experiencing rapid technological advancements, which are enhancing imaging capabilities and diagnostic accuracy. Innovations such as photon-counting detectors and advanced algorithms are enabling better differentiation of materials and improved image quality. These advancements are likely to drive market growth as healthcare providers seek to adopt state-of-the-art imaging technologies. The increasing demand for precise imaging in oncology and cardiology is particularly noteworthy, as these fields benefit significantly from enhanced spectral imaging. As a result, the market is projected to reach 8.8 USD Billion in 2024, reflecting the growing adoption of these technologies.
Rising Prevalence of Chronic Diseases
The Global Spectral Computed Tomography (CT) Market Industry is significantly influenced by the rising prevalence of chronic diseases, such as cancer and cardiovascular disorders. As these conditions become more common, the demand for advanced diagnostic imaging solutions increases. Spectral CT offers superior diagnostic capabilities, allowing for earlier detection and better treatment planning. For instance, spectral imaging can help differentiate between benign and malignant lesions, which is crucial in oncology. This growing need for effective diagnostic tools is expected to contribute to the market's expansion, with projections indicating a growth to 21.7 USD Billion by 2035, driven by the increasing burden of chronic diseases.
Growing Demand for Personalized Medicine
The Global Spectral Computed Tomography (CT) Market Industry is increasingly driven by the growing demand for personalized medicine. As healthcare shifts towards tailored treatment approaches, advanced imaging techniques like spectral CT are becoming essential for precise diagnosis and treatment planning. Spectral CT allows for the characterization of tissue composition, which can inform personalized treatment strategies, particularly in oncology. This trend towards individualized care is likely to propel market growth, as healthcare providers seek to leverage advanced imaging technologies to enhance patient outcomes. The integration of spectral imaging into clinical practice is expected to further solidify its role in personalized medicine.
Regulatory Support and Reimbursement Policies
The Global Spectral Computed Tomography (CT) Market Industry is positively impacted by supportive regulatory frameworks and reimbursement policies. Governments and health authorities are increasingly recognizing the value of advanced imaging technologies, leading to favorable reimbursement rates for spectral CT procedures. This support encourages healthcare providers to invest in and adopt these technologies, thereby driving market growth. Additionally, regulatory bodies are streamlining the approval processes for new imaging devices, facilitating quicker access to innovative spectral CT solutions. As reimbursement policies evolve to cover advanced imaging techniques, the market is likely to see increased adoption and utilization of spectral CT in clinical settings.
Increased Investment in Healthcare Infrastructure
The Global Spectral Computed Tomography (CT) Market Industry is benefiting from increased investment in healthcare infrastructure across various regions. Governments and private entities are allocating substantial funds to enhance medical facilities and upgrade imaging technologies. This investment is particularly evident in emerging economies, where there is a strong push to improve healthcare access and quality. Enhanced healthcare infrastructure facilitates the adoption of advanced imaging modalities, including spectral CT, which is essential for accurate diagnostics. As a result, the market is poised for growth, with a projected compound annual growth rate (CAGR) of 8.54% from 2025 to 2035, reflecting the ongoing commitment to improving healthcare services.
Market Segment Insights
Regional Insights
Key Companies in the Spectral Computed Tomography Market market include


Industry Developments
- In March 2018:Philips entered into a 15-year strategic partnership with ZorgSaam Hospital based in the Netherlands. As per the agreement, Philips will provide ZorgSaam with a wide range of diagnostic imaging and image-guided therapy solutions, among others.
- In March 2019:Koninklijke Philips N.V. announced the expansion of its radiology solutions portfolio with teleradiology services. Teleradiology includes the interpretation of patients’ images from medical imaging exams, such as X-ray exams, MR, and CT. This complements the company’s organic innovation initiatives to expand its radiology solutions portfolio.
Future Outlook
Spectral Computed Tomography Market Future Outlook
The Spectral Computed Tomography (CT) Market is projected to grow at an 8.54% CAGR from 2024 to 2035, driven by technological advancements and increasing diagnostic applications.
New opportunities lie in:
- Develop AI-driven software for enhanced image analysis and interpretation.
- Expand product offerings to include portable spectral CT systems for remote diagnostics.
- Invest in partnerships with healthcare providers to integrate spectral CT into routine screenings.
By 2035, the Spectral Computed Tomography (CT) Market is expected to be robust, reflecting substantial technological integration and widespread adoption.
Market Segmentation
Report Scope
Attribute/Metric | Details |
Market Size 2023 | 8 (USD Billion) |
Market Size 2024 | 8.8 (USD Billion) |
Market Size 2032 | 17.2 (USD Billion) |
Compound Annual Growth Rate (CAGR) | 8 % (2024 - 2032) |
Report Coverage | Revenue Forecast, Competitive Landscape, Growth Factors, and Trends |
Base Year | 2023 |
Market Forecast Period | 2024 - 2032 |
Historical Data | 2019 - 2023 |
Geographies Covered | North America, Europe, Asia-Pacific, and Rest of the World (RoW) |
Key Vendors | General Electric Company (US), Koninklijke Philips N.V. (Amsterdam, Netherlands), MARS Bioimaging Ltd (Christchurch, New Zealand), Neusoft Corporation (China), Shenzhen Anke High-tech Co., Ltd (China), Siemens (UK), and PerkinElmer Inc. (Waltham, Massachusetts) |
Key Market Opportunities | The increasing acceptance and approval of the cloud technology in medical image devices provide easy storage and sharing of huge data |
Key Market Drivers | · Increasing expenditure on the healthcare IT sector, and technological advancements in the diagnostics sector. · The increasing adaption of IT in medical devices to improve the quality of the product is a major step. |
Market Highlights
Author
Latest Comments
This is a great article! Really helped me understand the topic better.
Thanks for sharing this. I’ve bookmarked it for later reference.
FAQs
What is the valuation of the market?
spectral CT market is expected to reach USD 17.2 Billion by 2032.
What is the CAGR of the market?
The global market is expected to exhibit a strong 8.00% CAGR over the forecast period till 2032.
What is the major driver for the market?
The rise in demand for advanced medical imagining modalities is the major driver for the market.
Which is the leading regional market?
Asia pacific holds the largest share in the global Spectral Computed Tomography (CT) market followed by America, Europe, and Middle East & Africa.
What are the key players in the market?
Leading players in the market include MARS Bioimaging, GE, and Koninklijke Philips, among others.
-
Executive Summary
-
Market Introduction
- Scope of the Study 12
- Research Objective 12
- List of Assumptions 12
-
Research Methodology
- Research Process 14
- Primary Research 15
- Secondary Research 16
- Market Size Estimation 17
-
Market Dynamics
- Introduction 18
-
Drivers 19
- Increasing Expenditure on the Healthcare IT Sector 19
- Technological Advancements in the Diagnostics Sector 19
- Growing Prevalence of Diseases such as Cancer, Neurological Disorders, and Cardiac Diseases Across the Globe 20
- Drivers Analysis 20
-
Restraints 21
- High Cost of Spectral Computed Tomography 21
- Availability of Alternative Imaging Methods 21
- Restraints Analysis 21
-
Opportunity 22
- Growth Potential in Emerging Countries 22
-
Market Factor Analysis
-
Overview 23
- Research and Development 23
- Manufacturing 23
- Distribution and Sales 23
- Post-Sales Monitoring 24
-
Porter’s Five Forces Model 24
- Overview 24
- Bargaining Power of Suppliers 25
- Bargaining Power of Buyers 25
- Threat of New Entrants 25
- Threat of Substitutes 25
- Intensity of Rivalry 26
-
Overview 23
-
Global Spectral Computed Tomography (CT) Market by, Application
- Introduction 27
- Oncology 28
- Cardiology 28
- Musculoskeletal Disorders 29
- Gastrointestinal Diseases 29
-
Global Spectral Computed Tomography (CT) Market by, End User
- Introduction 30
- Diagnostic Centers 31
- Hospitals & Clinics 31
-
Global Spectral Computed Tomography (CT) Market by, Region
- Introduction 32
-
Americas 34
- North America 35
- South America 38
-
Europe 39
- Germany 40
- France 41
- UK 42
- Italy 43
- Spain 44
- Rest of Europe 45
-
Asia-Pacific 46
- China 47
- Japan 48
- India 49
- South Korea 50
- Australia 51
- Rest of Asia-Pacific 52
-
Middle East & Africa 53
- Middle East 54
- Africa 55
-
Competitive Landscape
- Introduction 56
-
Company Profiles
-
General Electric Company 57
- Company Overview 57
- Financial Overview 57
- Products/Services Offered 58
- Key Developments 58
- SWOT Analysis 58
- Key Strategies 58
-
Koninklijke Philips N.V. 59
- Company Overview 59
- Financial Overview 59
- Products/Services Offered 60
- Key Developments 60
- SWOT Analysis 60
- Key Strategies 60
-
MARS Bioimaging Ltd 61
- Company Overview 61
- Financial Overview 61
- Products/Services Offered 61
- Key Developments 61
- SWOT Analysis 61
- Key Strategies 62
-
Neusoft Corporation 63
- Company Overview 63
- Financial Overview 63
- Products/Services Offered 63
- Key Developments 64
- SWOT Analysis 64
- Key Strategies 64
-
Shenzhen Anke High-tech Co., Ltd 65
- Company Overview 65
- Financial Overview 65
- Products/Services Offered 65
- Key Developments 65
- SWOT Analysis 65
- Key Strategies 66
-
Siemens 67
- Company Overview 67
- Financial Overview 67
- Products/Services Offered 68
- Key Developments 68
- SWOT Analysis 68
- Key Strategies 68
-
PerkinElmer Inc. 69
- Company Overview 69
- Financial Overview 69
- Products/Services Offered 69
- Key Developments 70
- SWOT Analysis 70
- Key Strategies 70
-
General Electric Company 57
-
Appendix
-
References 71
-
Related Reports 71
-
-
List of Tables and Figures
- 12 List of Tables
- TABLE 1 LIST OF ASSUMPTIONS 12
- TABLE 2 PRIMARY INTERVIEWS 15
- TABLE 3 GLOBAL SPECTRAL COMPUTED TOMOGRAPHY (CT) MARKET BY, APPLICATION 2020–2027 (USD MILLION) 27
- TABLE 4 GLOBAL SPECTRAL COMPUTED TOMOGRAPHY (CT) MARKET FOR ONCOLOGY BY, REGION 2020–2027 (USD MILLION) 28
- TABLE 5 GLOBAL SPECTRAL COMPUTED TOMOGRAPHY (CT) MARKET FOR CARDIOLOGY BY, REGION 2020–2027 (USD MILLION) 28
- TABLE 6 GLOBAL SPECTRAL COMPUTED TOMOGRAPHY (CT) MARKET FOR MUSCULOSKELETAL DISORDERS BY, REGION 2020–2027 (USD MILLION) 29
- TABLE 7 GLOBAL SPECTRAL COMPUTED TOMOGRAPHY (CT) MARKET FOR GASTROINTESTINAL DISEASES BY, REGION 2020–2027 (USD MILLION) 29
- TABLE 8 GLOBAL SPECTRAL COMPUTED TOMOGRAPHY (CT) MARKET BY, END USER 2020–2027 (USD MILLION) 30
- TABLE 9 GLOBAL SPECTRAL COMPUTED TOMOGRAPHY (CT) MARKET FOR DIAGNOSTIC CENTERS BY, REGION 2020–2027 (USD MILLION) 31
- TABLE 10 GLOBAL SPECTRAL COMPUTED TOMOGRAPHY (CT) MARKET FOR HOSPITALS & CLINICS BY, REGION 2020–2027 (USD MILLION) 31
- TABLE 11 GLOBAL SPECTRAL COMPUTED TOMOGRAPHY (CT) MARKET BY, REGION 2020–2027 (USD MILLION) 33
- TABLE 12 AMERICAS: SPECTRAL COMPUTED TOMOGRAPHY (CT) MARKET BY, REGION 2020–2027 (USD MILLION) 34
- TABLE 13 AMERICAS: SPECTRAL COMPUTED TOMOGRAPHY (CT) MARKET BY, APPLICATION 2020–2027 (USD MILLION) 34
- TABLE 14 AMERICAS: SPECTRAL COMPUTED TOMOGRAPHY (CT) MARKET BY, END USER 2020–2027 (USD MILLION) 35
- TABLE 15 NORTH AMERICA: SPECTRAL COMPUTED TOMOGRAPHY (CT) MARKET BY, COUNTRY 2020–2027 (USD MILLION) 35
- TABLE 16 NORTH AMERICA: SPECTRAL COMPUTED TOMOGRAPHY (CT) MARKET BY, APPLICATION 2020–2027 (USD MILLION) 36
- TABLE 17 NORTH AMERICA: SPECTRAL COMPUTED TOMOGRAPHY (CT) MARKET BY, END USER 2020–2027 (USD MILLION) 36
- TABLE 18 US: SPECTRAL COMPUTED TOMOGRAPHY (CT) MARKET BY, APPLICATION 2020–2027 (USD MILLION) 36
- TABLE 19 US: SPECTRAL COMPUTED TOMOGRAPHY (CT) MARKET BY, END USER 2020–2027 (USD MILLION) 37
- TABLE 20 CANADA: SPECTRAL COMPUTED TOMOGRAPHY (CT) MARKET BY, APPLICATION 2020–2027 (USD MILLION) 37
- TABLE 21 CANADA: SPECTRAL COMPUTED TOMOGRAPHY (CT) MARKET BY, END USER 2020–2027 (USD MILLION) 37
- TABLE 22 SOUTH AMERICA: SPECTRAL COMPUTED TOMOGRAPHY (CT) MARKET BY, APPLICATION 2020–2027 (USD MILLION) 38
- TABLE 23 SOUTH AMERICA: SPECTRAL COMPUTED TOMOGRAPHY (CT) MARKET BY, END USER 2020–2027 (USD MILLION) 38
- TABLE 24 EUROPE: SPECTRAL COMPUTED TOMOGRAPHY (CT) MARKET BY, COUNTRY/REGION 2020–2027 (USD MILLION) 39
- TABLE 25 EUROPE: SPECTRAL COMPUTED TOMOGRAPHY (CT) MARKET BY, APPLICATION 2020–2027 (USD MILLION) 39
- TABLE 26 EUROPE: SPECTRAL COMPUTED TOMOGRAPHY (CT) MARKET BY, END USER 2020–2027 (USD MILLION) 40
- TABLE 27 GERMANY: SPECTRAL COMPUTED TOMOGRAPHY (CT) MARKET BY, APPLICATION 2020–2027 (USD MILLION) 40
- TABLE 28 GERMANY: SPECTRAL COMPUTED TOMOGRAPHY (CT) MARKET BY, END USER 2020–2027 (USD MILLION) 40
- TABLE 29 FRANCE: SPECTRAL COMPUTED TOMOGRAPHY (CT) MARKET BY, APPLICATION 2020–2027 (USD MILLION) 41
- TABLE 30 FRANCE: SPECTRAL COMPUTED TOMOGRAPHY (CT) MARKET BY, END USER 2020–2027 (USD MILLION) 41
- TABLE 31 UK: SPECTRAL COMPUTED TOMOGRAPHY (CT) MARKET BY, APPLICATION 2020–2027 (USD MILLION) 42
- TABLE 32 UK: SPECTRAL COMPUTED TOMOGRAPHY (CT) MARKET BY, END USER 2020–2027 (USD MILLION) 42
- TABLE 33 ITALY: SPECTRAL COMPUTED TOMOGRAPHY (CT) MARKET BY, APPLICATION 2020–2027 (USD MILLION) 43
- TABLE 34 ITALY: SPECTRAL COMPUTED TOMOGRAPHY (CT) MARKET BY, END USER 2020–2027 (USD MILLION) 43
- TABLE 35 SPAIN: SPECTRAL COMPUTED TOMOGRAPHY (CT) MARKET BY, APPLICATION 2020–2027 (USD MILLION) 44
- TABLE 36 SPAIN: SPECTRAL COMPUTED TOMOGRAPHY (CT) MARKET BY, END USER 2020–2027 (USD MILLION) 44
- TABLE 37 REST OF EUROPE: SPECTRAL COMPUTED TOMOGRAPHY (CT) MARKET BY, APPLICATION 2020–2027 (USD MILLION) 45
- TABLE 38 REST OF EUROPE: SPECTRAL COMPUTED TOMOGRAPHY (CT) MARKET BY, END USER 2020–2027 (USD MILLION) 45
- TABLE 39 ASIA-PACIFIC: SPECTRAL COMPUTED TOMOGRAPHY (CT) MARKET BY,COUNTRY/REGION 2020–2027 (USD MILLION) 46
- TABLE 40 ASIA-PACIFIC: SPECTRAL COMPUTED TOMOGRAPHY (CT) MARKET BY, APPLICATION 2020–2027 (USD MILLION) 46
- TABLE 41 ASIA-PACIFIC: SPECTRAL COMPUTED TOMOGRAPHY (CT) MARKET BY, END USER 2020–2027 (USD MILLION) 47
- TABLE 42 CHINA: SPECTRAL COMPUTED TOMOGRAPHY (CT) MARKET BY, APPLICATION 2020–2027 (USD MILLION) 47
- TABLE 43 CHINA: SPECTRAL COMPUTED TOMOGRAPHY (CT) MARKET BY, END USER 2020–2027 (USD MILLION) 47
- TABLE 44 JAPAN: SPECTRAL COMPUTED TOMOGRAPHY (CT) MARKET BY, APPLICATION 2020–2027 (USD MILLION) 48
- TABLE 45 JAPAN: SPECTRAL COMPUTED TOMOGRAPHY (CT) MARKET BY, END USER 2020–2027 (USD MILLION) 48
- TABLE 46 INDIA: SPECTRAL COMPUTED TOMOGRAPHY (CT) MARKET BY, APPLICATION 2020–2027 (USD MILLION) 49
- TABLE 47 INDIA: SPECTRAL COMPUTED TOMOGRAPHY (CT) MARKET BY, END USER 2020–2027 (USD MILLION) 49
- TABLE 48 SOUTH KOREA: SPECTRAL COMPUTED TOMOGRAPHY (CT) MARKET BY, APPLICATION 2020–2027 (USD MILLION) 50
- TABLE 49 SOUTH KOREA: SPECTRAL COMPUTED TOMOGRAPHY (CT) MARKET BY, END USER 2020–2027 (USD MILLION) 50
- TABLE 50 AUSTRALIA: SPECTRAL COMPUTED TOMOGRAPHY (CT) MARKET BY, APPLICATION 2020–2027 (USD MILLION) 51
- TABLE 51 AUSTRALIA: SPECTRAL COMPUTED TOMOGRAPHY (CT) MARKET BY, END USER 2020–2027 (USD MILLION) 51
- TABLE 52 REST OF ASIA-PACIFIC: SPECTRAL COMPUTED TOMOGRAPHY (CT) MARKET BY, APPLICATION 2020–2027 (USD MILLION) 52
- TABLE 53 REST OF ASIA-PACIFIC: SPECTRAL COMPUTED TOMOGRAPHY (CT) MARKET BY, END USER 2020–2027 (USD MILLION) 52
- TABLE 54 MIDDLE EAST & AFRICA: SPECTRAL COMPUTED TOMOGRAPHY (CT) MARKET BY, REGION 2020–2027 (USD MILLION) 53
- TABLE 55 MIDDLE EAST & AFRICA: SPECTRAL COMPUTED TOMOGRAPHY (CT) MARKET BY, APPLICATION 2020–2027 (USD MILLION) 53
- TABLE 56 MIDDLE EAST & AFRICA: SPECTRAL COMPUTED TOMOGRAPHY (CT) MARKET BY, END USER 2020–2027 (USD MILLION) 54
- TABLE 57 MIDDLE EAST: SPECTRAL COMPUTED TOMOGRAPHY (CT) MARKET BY, APPLICATION 2020–2027 (USD MILLION) 54
- TABLE 58 MIDDLE EAST: SPECTRAL COMPUTED TOMOGRAPHY (CT) MARKET BY, END USER 2020–2027 (USD MILLION) 54
- TABLE 59 AFRICA: SPECTRAL COMPUTED TOMOGRAPHY (CT) MARKET BY, APPLICATION 2020–2027 (USD MILLION) 55
- TABLE 60 AFRICA: SPECTRAL COMPUTED TOMOGRAPHY (CT) MARKET BY, END USER 2020–2027 (USD MILLION) 55
- TABLE 61 MAJOR MANUFACTURERS IN THE GLOBAL SPECTRAL COMPUTED TOMOGRAPHY (CT) MARKET 56 13 List of Figures
- FIGURE 1 MARKET SYNOPSIS 11
- FIGURE 2 GLOBAL SPECTRAL COMPUTED TOMOGRAPHY (CT) MARKET: STRUCTURE 13
- FIGURE 3 RESEARCH PROCESS 14
- FIGURE 4 TOP-DOWN AND Bottom-up ApproachES 17
- FIGURE 5 MARKET DYNAMICS: ANALYSIS OF THE GLOBAL SPECTRAL COMPUTED TOMOGRAPHY (CT) MARKET 18
- FIGURE 6 VALUE CHAIN: GLOBAL SPECTRAL COMPUTED TOMOGRAPHY (CT) MARKET 23
- FIGURE 7 PORTER’S FIVE FORCES ANALYSIS: GLOBAL SPECTRAL COMPUTED TOMOGRAPHY (CT) MARKET 24
- FIGURE 8 GLOBAL SPECTRAL COMPUTED TOMOGRAPHY (CT) MARKET BY, APPLICATION 2020 & 2027 (USD MILLION) 28
- FIGURE 9 GLOBAL SPECTRAL COMPUTED TOMOGRAPHY (CT) MARKET BY, END USER 2020 & 2027 (USD MILLION) 31
- FIGURE 10 GLOBAL SPECTRAL COMPUTED TOMOGRAPHY (CT) MARKET SHARE BY, REGION 2020 (%) 33
- FIGURE 11 AMERICAS: SPECTRAL COMPUTED TOMOGRAPHY (CT) MARKET SHARE BY, REGION 2020 (%) 34
- FIGURE 12 NORTH AMERICA: SPECTRAL COMPUTED TOMOGRAPHY (CT) MARKET SHARE BY, COUNTRY 2020 (%) 35
- FIGURE 13 EUROPE: SPECTRAL COMPUTED TOMOGRAPHY (CT) MARKET SHARE BY, COUNTRY/REGION 2020 (%) 39
- FIGURE 14 ASIA-PACIFIC: SPECTRAL COMPUTED TOMOGRAPHY (CT) MARKET SHARE BY, COUNTRY/REGION 2020 (%) 46
- FIGURE 15 MIDDLE EAST & AFRICA: SPECTRAL COMPUTED TOMOGRAPHY (CT) MARKET SHARE BY, REGION 2020 (%) 53
Spectral Computed Tomography (CT) Market Segmentation
Market Segmentation Overview
- Detailed segmentation data will be available in the full report
- Comprehensive analysis by multiple parameters
- Regional and country-level breakdowns
- Market size forecasts by segment

Free Sample Request
Kindly complete the form below to receive a free sample of this Report
Customer Strories
“I am very pleased with how market segments have been defined in a relevant way for my purposes (such as "Portable Freezers & refrigerators" and "last-mile"). In general the report is well structured. Thanks very much for your efforts.”
Leave a Comment