×
Hero Background
English
Chinese
French
Japanese
Korean
German
Spanish

Synthetic Diamond Market Trends

ID: MRFR/CnM/10312-HCR
128 Pages
Anshula Mandaokar
October 2025

Synthetic Diamond Market Research Report Information By Product (Bort, Dust, Grit, Powder & Stone), By Type (Polished and Rough), By Manufacturing Process (High Pressure, High Temperature and Chemical Vapor Deposition), By Application (Gem, Heat Sinks/Exchangers, High-end Electronics, Laser and X-ray, Machine and Cutting Tools, Surgical Machinery, Water Treatment, Quantum Computing, Optical, Sensors & Scanning, Medical, and Electricals), and By Region (North America, Europe, Asia-Pacific, and Rest Of The World) – Market Forecast Till... read more

Share:
Download PDF ×

We do not share your information with anyone. However, we may send you emails based on your report interest from time to time. You may contact us at any time to opt-out.

Synthetic Diamond Market Infographic
Purchase Options

Market Trends

Key Emerging Trends in the Synthetic Diamond Market

The market trends of synthetic diamonds have been witnessing significant shifts in recent years. Synthetic diamonds, also known as lab-grown or cultured diamonds, are gaining traction due to their ethical and environmental advantages over natural diamonds. One prominent trend is the growing demand for synthetic diamonds in various industries, including jewelry, electronics, and healthcare. This demand surge is primarily driven by consumers' increasing awareness of the origin of their products and the desire for sustainable alternatives.

The many different forms of synthetic diamonds, including bort, grit, dust, and powder, have numerous uses in a variety of end-user sectors

In the jewelry sector, synthetic diamonds are becoming increasingly popular among millennials and younger consumers who prioritize ethical sourcing and environmental sustainability. These lab-grown gems offer identical physical and chemical properties to natural diamonds but are produced in controlled laboratory environments, eliminating the ethical concerns associated with traditional diamond mining. As a result, jewelry retailers are expanding their offerings to include synthetic diamonds, catering to the evolving preferences of eco-conscious consumers.

Moreover, advancements in technology have significantly improved the quality and affordability of synthetic diamonds, further fueling market growth. Manufacturers are investing in innovative production techniques such as chemical vapor deposition (CVD) and high-pressure high-temperature (HPHT) methods to enhance the clarity, color, and size of synthetic diamonds. This has led to a broader range of options for consumers, with synthetic diamonds now available in various shapes, sizes, and colors to suit different preferences and budgets.

In addition to the jewelry industry, synthetic diamonds are increasingly utilized in the electronics sector, particularly in semiconductor manufacturing. The exceptional thermal conductivity and durability of synthetic diamonds make them ideal materials for heat management solutions in electronic devices. As electronic components become smaller and more powerful, the demand for efficient heat dissipation materials like synthetic diamonds continues to rise. This trend is expected to drive substantial growth in the synthetic diamond market in the coming years, particularly with the proliferation of technologies such as 5G, IoT, and electric vehicles.

Furthermore, the healthcare industry is emerging as a significant consumer of synthetic diamonds, particularly in medical imaging and diagnostics. Synthetic diamond-based sensors and detectors offer unparalleled sensitivity and precision, making them invaluable tools in medical equipment such as MRI machines and particle detectors. As the healthcare sector continues to prioritize innovation and accuracy, the demand for synthetic diamond-based technologies is projected to increase steadily.

However, despite the promising growth prospects, the synthetic diamond market still faces challenges such as market acceptance and competition from natural diamonds. While synthetic diamonds offer clear advantages in terms of sustainability and consistency, traditional perceptions of natural diamonds as symbols of luxury and rarity persist. Overcoming these perceptions and educating consumers about the benefits of synthetic diamonds will be crucial for market expansion.

Moreover, competition from natural diamond producers remains a significant factor influencing market dynamics. The diamond industry, dominated by major players in countries like Russia, Botswana, and Canada, has historically focused on natural diamond extraction and marketing. However, increasing consumer demand for ethically sourced and environmentally friendly products is prompting some industry players to explore opportunities in synthetic diamonds. This shifting landscape could lead to increased competition and collaboration between natural and synthetic diamond sectors in the future.

Author
Anshula Mandaokar
Team Lead - Research

Anshula Mandaokar holds an academic degree in Chemical Engineering and has been contributing to the field for more than 5 years. She has expertise in Market Research and Business Consulting and serves as a Team Lead for a reputed Market Research firm under the Chemicals and Materials domain spectrum. She has worked on multiple projects, generating explicit results in a quick turnaround time. Her understanding of data interpretation justifies her role as a leader.

Leave a Comment

FAQs

What is the current valuation of the Synthetic Diamond Market as of 2024?

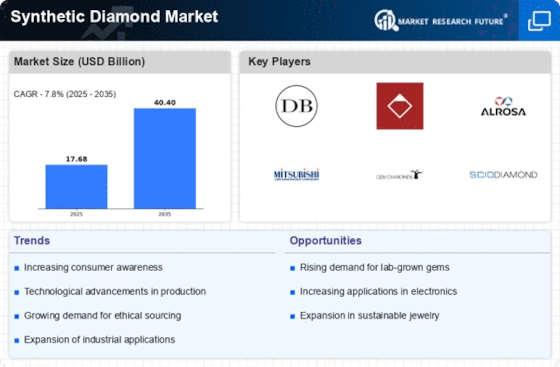
The Synthetic Diamond Market was valued at 17.68 USD Billion in 2024.

What is the projected market valuation for the Synthetic Diamond Market in 2035?

The market is projected to reach a valuation of 40.4 USD Billion by 2035.

What is the expected CAGR for the Synthetic Diamond Market during the forecast period 2025 - 2035?

The expected CAGR for the Synthetic Diamond Market during 2025 - 2035 is 7.8%.

Which companies are considered key players in the Synthetic Diamond Market?

Key players in the market include De Beers Group, Diamond Foundry, Alrosa, and Mitsubishi Materials Corporation.

What are the main product segments in the Synthetic Diamond Market?

Main product segments include bort, dust, grit, powder, and stone, with valuations ranging from 2.5 to 10.9 USD Billion.

How does the valuation of polished and rough diamonds compare in the market?

Polished diamonds are valued between 12.0 and 28.0 USD Billion, while rough diamonds range from 5.68 to 12.4 USD Billion.

Market Summary

As per MRFR analysis, the Synthetic Diamond Market Size was estimated at 17.68 USD Billion in 2024. The Synthetic Diamond industry is projected to grow from 19.06 USD Billion in 2025 to 40.4 USD Billion by 2035, exhibiting a compound annual growth rate (CAGR) of 7.8 during the forecast period 2025 - 2035.

Key Market Trends & Highlights

The synthetic diamond market is poised for robust growth driven by technological advancements and sustainability initiatives.

  • North America remains the largest market for synthetic diamonds, driven by increasing consumer awareness and demand.
  • The Asia-Pacific region is emerging as the fastest-growing market, fueled by rising industrial applications and investments.
  • In the synthetic diamond segments, powder dominates the market, while grit is experiencing the fastest growth due to diverse applications.
  • Key market drivers include the rising demand in the jewelry sector and technological innovations in production, which are shaping market dynamics.

Market Size & Forecast

2024 Market Size 17.68 (USD Billion)
2035 Market Size 40.4 (USD Billion)
CAGR (2025 - 2035) 7.8%
Largest Regional Market Share in 2024 North America

Major Players

<p>De Beers Group (GB), Diamond Foundry (US), Alrosa (RU), Mitsubishi Materials Corporation (JP), Gem Diamonds (GB), Pure Grown Diamonds (US), Scio Diamond Technology Corporation (US), New Diamond Technology (RU), Swarovski (AT)</p>

Market Trends

The Synthetic Diamond Market is currently experiencing a notable transformation, driven by advancements in technology and shifting consumer preferences. As the demand for ethically sourced and environmentally friendly products rises, synthetic diamonds are increasingly viewed as a viable alternative to natural stones. This market evolution is characterized by a growing acceptance of synthetic diamonds in various sectors, including jewelry, industrial applications, and electronics. The perception of synthetic diamonds is gradually changing, with consumers recognizing their value and quality, which may lead to a broader market penetration in the coming years. Moreover, the competitive landscape of the Synthetic Diamond Market is becoming more dynamic, as numerous players enter the field, each striving to innovate and differentiate their offerings. This influx of new entrants could potentially enhance product diversity and drive down prices, making synthetic diamonds more accessible to a wider audience. Additionally, collaborations between manufacturers and retailers are likely to strengthen distribution channels, further promoting the adoption of synthetic diamonds. As the market continues to evolve, it appears poised for sustained growth, reflecting broader trends in sustainability and consumer awareness.

Technological Advancements

Recent innovations in production techniques are enhancing the quality and reducing the costs associated with synthetic diamonds. These advancements may lead to improved clarity and color, making synthetic options more appealing to consumers.

Sustainability Focus

There is a growing emphasis on sustainability among consumers, which is influencing purchasing decisions. Synthetic diamonds, often marketed as eco-friendly alternatives, align with this trend, potentially increasing their market share.

Diverse Applications

The versatility of synthetic diamonds is expanding their use beyond traditional jewelry. Industries such as electronics and manufacturing are increasingly utilizing synthetic diamonds for various applications, indicating a broadening market scope.

Synthetic Diamond Market Market Drivers

Growing Industrial Applications

The Synthetic Diamond Market is witnessing an expansion in its industrial applications, which is contributing to its growth trajectory. Synthetic diamonds are increasingly utilized in various sectors, including electronics, optics, and cutting tools. Their superior hardness and thermal conductivity make them ideal for high-performance applications. For instance, the electronics industry is adopting synthetic diamonds for heat sinks and semiconductors, enhancing device performance and longevity. The market for industrial synthetic diamonds is anticipated to grow at a rate of around 10% annually, driven by the demand for advanced materials in manufacturing processes. This diversification of applications not only broadens the market scope but also reinforces the value proposition of synthetic diamonds across different industries.

Rising Demand in Jewelry Sector

The Synthetic Diamond Market experiences a notable surge in demand, particularly within the jewelry sector. As consumers increasingly seek ethically sourced and conflict-free alternatives, synthetic diamonds present a compelling option. The market for synthetic diamonds in jewelry is projected to grow at a compound annual growth rate of approximately 15% over the next five years. This growth is driven by changing consumer preferences, where millennials and Gen Z prioritize sustainability and ethical considerations in their purchasing decisions. Consequently, jewelry brands are adapting their offerings to include synthetic diamonds, thereby expanding their market reach. The increasing acceptance of synthetic diamonds as a legitimate choice for engagement rings and other fine jewelry pieces further solidifies their position in the market.

Regulatory Support and Standards

Regulatory support and the establishment of standards are emerging as influential factors in the Synthetic Diamond Market. Governments and industry bodies are increasingly recognizing the importance of regulating synthetic diamond production and sales to ensure consumer safety and product authenticity. The development of clear guidelines and certification processes can enhance consumer confidence, thereby driving market growth. Additionally, as regulations evolve, they may encourage more players to enter the market, fostering competition and innovation. The establishment of industry standards is likely to facilitate the acceptance of synthetic diamonds in various applications, further solidifying their position in the market. This regulatory landscape is expected to evolve, shaping the future of the synthetic diamond industry.

Investment in Research and Development

Investment in research and development is a critical driver for the Synthetic Diamond Market. Companies are increasingly allocating resources to explore new applications and improve existing production methods. This focus on R&D is essential for maintaining competitive advantage and fostering innovation within the market. As firms strive to differentiate their products, advancements in synthetic diamond technology are likely to emerge, leading to enhanced quality and new functionalities. Furthermore, collaborations between industry players and research institutions are becoming more common, facilitating knowledge exchange and accelerating technological progress. The emphasis on R&D is expected to yield breakthroughs that could redefine market dynamics and expand the potential uses of synthetic diamonds.

Technological Innovations in Production

Technological advancements play a pivotal role in shaping the Synthetic Diamond Market. Innovations in production techniques, such as Chemical Vapor Deposition (CVD) and High Pressure High Temperature (HPHT), have significantly enhanced the quality and affordability of synthetic diamonds. These methods allow for the creation of diamonds that are virtually indistinguishable from their natural counterparts. As production costs decrease, the accessibility of synthetic diamonds increases, attracting a broader consumer base. The market is witnessing a shift towards more efficient production processes, which not only improve yield but also reduce environmental impact. This technological evolution is expected to propel the market forward, with projections indicating a potential doubling of production capacity within the next few years.

Market Segment Insights

By Product: Powder (Largest) vs. Grit (Fastest-Growing)

<p>In the Synthetic Diamond Market, the product segment showcases a diverse range of values such as bort, dust, grit, powder, and stone. Among these, powder holds the largest market share, demonstrating its crucial role in various industrial applications. Grit, while currently holding a smaller share compared to powder, is recognized as the fastest-growing segment due to its increasing usage in precision grinding and cutting processes. The distribution of market share highlights the ongoing evolution and specialization of synthetic diamond products within various industries.</p>

<p>Powder (Dominant) vs. Grit (Emerging)</p>

<p>Powder stands out as the dominant product in the Synthetic Diamond Market, primarily due to its widespread application in abrasive manufacturing and surface finishing. It is favored for its ability to deliver fine and consistent particle sizes that enhance efficiency in various processes. On the other hand, grit, while considered an emerging segment, is rapidly gaining traction, especially in applications requiring robust and effective cutting tools. The drive towards technological advancements and higher performance materials is propelling grit into the spotlight, appealing to industries focused on quality and precision. Both segment values reflect the evolving needs of end-users striving for superior performance in synthetic diamond applications.</p>

By Type: Polished (Largest) vs. Rough (Fastest-Growing)

<p>In the Synthetic Diamond Market, the distribution among segment values is notable, with polished diamonds holding the largest market share. Polished diamonds cater to a vast array of applications, including fine jewelry, industrial uses, and electronics. On the other hand, rough diamonds, while representing a smaller portion of the market, have been gaining traction swiftly due to their applications in the manufacturing of various tools and their increasing use in the laboratory-grown diamond segment for jewelry. The growth trends within this segment are quite promising. Polished diamonds are favored for their aesthetic appeal and are projected to sustain their dominance owing to steady consumer demand. Conversely, the rough diamond segment is emerging rapidly as industries pursue cost-effective and high-quality raw materials, driven by advancements in synthesis technology and increasing acceptance in various sectors, including construction and manufacturing.</p>

<p>Diamond Type: Polished (Dominant) vs. Rough (Emerging)</p>

<p>Polished diamonds stand as the dominant force in the Synthetic Diamond Market, characterized by their superior finish and brilliance, catering primarily to the luxury jewelry sector and various high-tech industries. Their demand continues to rise as more consumers gravitate towards ethically-sourced gemstones. In contrast, rough diamonds are emerging as a significant segment due to their lower production costs and practicality for industrial applications. The increasing focus on sustainable practices encourages industries to invest in rough synthetic diamonds, further augmenting their market growth. The dual strengths of both segments illustrate a dynamic market landscape where polished diamonds maintain prestige, while rough diamonds are poised for substantial growth due to evolving market demands.</p>

By Manufacturing Process: High Pressure (Largest) vs. Chemical Vapor Deposition (Fastest-Growing)

<p>In the Synthetic Diamond Market, the manufacturing process segment is primarily divided among three methods: high pressure, high temperature (HPHT), and chemical vapor deposition (CVD). HPHT holds a significant share of the market due to its traditional approach and well-established technology, while CVD is gaining traction as an innovative method that offers better control over diamond quality. This distribution indicates a keen interest in Varied manufacturing technologies among market players to cater to distinct application needs. The growth trends in this segment are predominantly driven by advancements in technology and increasing demand across various industries. The HPHT method remains dominant due to its established capabilities, while CVD is rapidly expanding, fueled by its cost efficiency and feasibility in manufacturing large-sized diamonds. The shift towards environmentally sustainable and ethical production methods also contributes to CVD's growth, as it aligns with consumer preferences for responsible sourcing.</p>

<p>High Pressure (Dominant) vs. Chemical Vapor Deposition (Emerging)</p>

<p>High Pressure (HPHT) remains the dominant manufacturing process in the Synthetic Diamond Market, primarily due to its historical significance and ability to produce high-quality gems with high clarity and unique properties. This traditional method mimics the natural formation of diamonds, making it a popular choice for both industrial and gemstone applications. In contrast, the Chemical Vapor Deposition (CVD) method is emerging as a revolutionary alternative, providing flexibility in diamond shapes and sizes while maintaining lower production costs. CVD is particularly appealing to producers focused on sustainability and ethical sourcing, catering to the growing consumer demand for responsibly sourced diamonds. The advancements in CVD technology also enable the production of high-quality diamonds at a faster rate, positioning it as a significant player in the evolving synthetic diamond landscape.</p>

By Application: Gem (Largest) vs. High-End Electronics (Fastest-Growing)

<p>The 'Application' segment of the synthetic diamond market presents diverse opportunities, with notable shares held by gem applications, high-end electronics, and optical sensors. The gem sector stands out as the largest, driven by consumer demand for sustainable and ethically sourced gemstones. In contrast, high-end electronics represented a growing segment, catering to advancements in technology and increasing miniaturization of devices. Other significant applications include surgical machinery and laser technologies, all reflecting a robust market dynamic where synthetic diamonds offer superior qualities compared to natural alternatives.</p>

<p>Gems (Dominant) vs. High-End Electronics (Emerging)</p>

<p>In the synthetic diamond market, the gem application remains a dominant force, captivating consumers with its luxury appeal and ethical sourcing narrative. This segment has seen a significant uptake among millennials and eco-conscious buyers who prefer synthetic over natural stones. On the other hand, high-end electronics are emerging rapidly, propelled by innovations in consumer electronics and demand for efficient thermal management solutions. Synthetic diamonds are increasingly utilized in heat sinks and electronic components, promising enhanced performance and durability. The interplay between these segments showcases a vibrant market landscape where consumer behavior and technological advancements drive growth.</p>

Get more detailed insights about Synthetic Diamond Market Research Report—Global Forecast till 2035

Regional Insights

North America : Innovation and Market Leadership

North America is the largest market for synthetic diamonds, holding approximately 45% of the global share. The region's growth is driven by increasing demand in the jewelry sector, advancements in technology, and favorable regulations promoting synthetic diamond production. The U.S. is the primary contributor, followed by Canada, which is witnessing a surge in local production and consumer acceptance of synthetic alternatives. Key players such as De Beers Group, Diamond Foundry, and Pure Grown Diamonds are leading the market, leveraging innovative technologies to enhance product quality. The competitive landscape is characterized by significant investments in R&D and marketing strategies aimed at educating consumers about the benefits of synthetic diamonds. The presence of established brands and new entrants is fostering a dynamic market environment.

Europe : Emerging Market with Growth Potential

Europe is the second-largest market for synthetic diamonds, accounting for about 30% of the global market share. The region's growth is fueled by increasing consumer awareness, sustainability trends, and regulatory support for synthetic diamond production. Countries like the UK and Germany are at the forefront, with a growing number of retailers offering synthetic options to meet changing consumer preferences. The competitive landscape in Europe features key players such as Alrosa and Swarovski, who are expanding their product lines to include synthetic diamonds. The market is also witnessing collaborations between manufacturers and retailers to enhance distribution channels. As sustainability becomes a priority, the demand for ethically sourced synthetic diamonds is expected to rise, further driving market growth.

Asia-Pacific : Rapid Growth and Market Expansion

Asia-Pacific is witnessing rapid growth in the synthetic diamond market, holding approximately 20% of the global share. The region's expansion is driven by rising disposable incomes, increasing demand for luxury goods, and advancements in manufacturing technologies. Countries like China and India are leading the charge, with a growing acceptance of synthetic diamonds in both industrial and jewelry applications. The competitive landscape is becoming increasingly vibrant, with local manufacturers emerging alongside established global players. Companies such as Mitsubishi Materials Corporation and New Diamond Technology are investing in innovative production techniques to cater to the growing market. The region's focus on technological advancements and consumer education is expected to further boost market penetration and acceptance of synthetic diamonds.

Middle East and Africa : Emerging Market with Unique Challenges

The Middle East and Africa region is an emerging market for synthetic diamonds, holding about 5% of the global share. The growth is primarily driven by increasing industrial applications and a gradual shift in consumer preferences towards synthetic options. Countries like South Africa and the UAE are beginning to explore the potential of synthetic diamonds, although the market is still in its infancy compared to other regions. The competitive landscape is characterized by a limited number of players, with local companies starting to invest in synthetic diamond production. The presence of global brands is minimal, but as awareness grows, more companies are likely to enter the market. Challenges such as regulatory hurdles and market education remain, but the potential for growth is significant as the region seeks to diversify its economy.

Key Players and Competitive Insights

The Synthetic Diamond Market is currently characterized by a dynamic competitive landscape, driven by innovation, sustainability, and technological advancements. Key players such as De Beers Group (GB), Diamond Foundry (US), and Alrosa (RU) are actively shaping the market through strategic initiatives that emphasize product differentiation and market expansion. De Beers Group (GB), for instance, has been focusing on enhancing its synthetic diamond offerings to cater to the growing demand for ethically sourced gemstones, while Diamond Foundry (US) is leveraging its advanced manufacturing techniques to position itself as a leader in the high-quality synthetic diamond segment. Alrosa (RU), on the other hand, is exploring partnerships to enhance its technological capabilities, thereby strengthening its competitive edge in the market.

The business tactics employed by these companies reflect a concerted effort to optimize supply chains and localize manufacturing processes. The Synthetic Diamond Market appears to be moderately fragmented, with a mix of established players and emerging companies vying for market share. This competitive structure allows for a diverse range of products and innovations, as companies seek to differentiate themselves through unique value propositions and operational efficiencies.

In August 2025, De Beers Group (GB) announced a strategic partnership with a leading technology firm to develop a new line of lab-grown diamonds that utilize cutting-edge AI technology for enhanced quality control. This move is significant as it not only reinforces De Beers' commitment to innovation but also positions the company to meet the increasing consumer demand for high-quality synthetic diamonds. The integration of AI into their production processes could potentially streamline operations and reduce costs, thereby enhancing profitability.

In September 2025, Diamond Foundry (US) launched a new marketing campaign aimed at promoting the environmental benefits of synthetic diamonds. This initiative is crucial as it aligns with the growing consumer preference for sustainable products. By highlighting the reduced carbon footprint associated with lab-grown diamonds, Diamond Foundry (US) is likely to attract environmentally conscious consumers, thereby expanding its market reach and reinforcing its brand identity as a sustainable choice.

In July 2025, Alrosa (RU) entered into a joint venture with a local mining company to explore new synthetic diamond production techniques. This collaboration is indicative of Alrosa's strategy to enhance its technological capabilities and diversify its product offerings. By investing in innovative production methods, Alrosa (RU) aims to maintain its competitive position in the market and respond effectively to evolving consumer preferences.

As of October 2025, the Synthetic Diamond Market is witnessing trends that emphasize digitalization, sustainability, and the integration of advanced technologies. Strategic alliances among key players are increasingly shaping the competitive landscape, fostering innovation and collaboration. The shift from price-based competition to a focus on technological advancements and supply chain reliability is becoming more pronounced. Companies that prioritize innovation and sustainability are likely to emerge as leaders in this evolving market, as consumer preferences continue to shift towards ethically sourced and technologically superior products.

Key Companies in the Synthetic Diamond Market market include

Industry Developments

February 2022: II-VI Inc. and Element Six UK Ltd. worked together. Through this partnership, II-VI will be able to increase its core competency in diamond technology by licensing Element Six's intellectual property and acquiring the tools required to make high-quality single-crystal diamonds.

Future Outlook

Synthetic Diamond Market Future Outlook

<p>The Synthetic Diamond Market is projected to grow at a 7.8% CAGR from 2024 to 2035, driven by technological advancements, increasing applications, and rising consumer acceptance.</p>

New opportunities lie in:

  • <p>Expansion into industrial applications for cutting and drilling tools.</p>
  • <p>Development of eco-friendly diamond production methods.</p>
  • <p>Strategic partnerships with luxury brands for exclusive jewelry lines.</p>

<p>By 2035, the market is expected to solidify its position as a leader in the global diamond industry.</p>

Market Segmentation

Synthetic Diamond Market Type Outlook

  • polished
  • rough

Synthetic Diamond Market Product Outlook

  • bort
  • dust
  • grit
  • powder
  • stone

Synthetic Diamond Market Application Outlook

  • gem
  • heat sinks/exchangers
  • high-end electronics
  • laser and X-ray
  • machine and cutting tools
  • surgical machinery
  • water treatment
  • quantum computing
  • optical sensors and scanning
  • medical
  • electricals

Synthetic Diamond Market Manufacturing Process Outlook

  • high pressure
  • high temperature
  • chemical vapor deposition

Report Scope

MARKET SIZE 202417.68(USD Billion)
MARKET SIZE 202519.06(USD Billion)
MARKET SIZE 203540.4(USD Billion)
COMPOUND ANNUAL GROWTH RATE (CAGR)7.8% (2024 - 2035)
REPORT COVERAGERevenue Forecast, Competitive Landscape, Growth Factors, and Trends
BASE YEAR2024
Market Forecast Period2025 - 2035
Historical Data2019 - 2024
Market Forecast UnitsUSD Billion
Key Companies ProfiledMarket analysis in progress
Segments CoveredMarket segmentation analysis in progress
Key Market OpportunitiesGrowing demand for sustainable and ethically sourced gemstones in the Synthetic Diamond Market.
Key Market DynamicsRising consumer preference for ethically sourced products drives demand for synthetic diamonds over natural alternatives.
Countries CoveredNorth America, Europe, APAC, South America, MEA

FAQs

What is the current valuation of the Synthetic Diamond Market as of 2024?

The Synthetic Diamond Market was valued at 17.68 USD Billion in 2024.

What is the projected market valuation for the Synthetic Diamond Market in 2035?

The market is projected to reach a valuation of 40.4 USD Billion by 2035.

What is the expected CAGR for the Synthetic Diamond Market during the forecast period 2025 - 2035?

The expected CAGR for the Synthetic Diamond Market during 2025 - 2035 is 7.8%.

Which companies are considered key players in the Synthetic Diamond Market?

Key players in the market include De Beers Group, Diamond Foundry, Alrosa, and Mitsubishi Materials Corporation.

What are the main product segments in the Synthetic Diamond Market?

Main product segments include bort, dust, grit, powder, and stone, with valuations ranging from 2.5 to 10.9 USD Billion.

How does the valuation of polished and rough diamonds compare in the market?

Polished diamonds are valued between 12.0 and 28.0 USD Billion, while rough diamonds range from 5.68 to 12.4 USD Billion.

  1. SECTION I: EXECUTIVE SUMMARY AND KEY HIGHLIGHTS
    1. EXECUTIVE SUMMARY
      1. Market Overview
      2. Key Findings
      3. Market Segmentation
      4. Competitive Landscape
      5. Challenges and Opportunities
      6. Future Outlook
  2. SECTION II: SCOPING, METHODOLOGY AND MARKET STRUCTURE
    1. MARKET INTRODUCTION
      1. Definition
      2. Scope of the study
    2. RESEARCH METHODOLOGY
      1. Overview
      2. Data Mining
      3. Secondary Research
      4. Primary Research
      5. Forecasting Model
      6. Market Size Estimation
      7. Data Triangulation
      8. Validation
  3. SECTION III: QUALITATIVE ANALYSIS
    1. MARKET DYNAMICS
      1. Overview
      2. Drivers
      3. Restraints
      4. Opportunities
    2. MARKET FACTOR ANALYSIS
      1. Value chain Analysis
      2. Porter's Five Forces Analysis
      3. COVID-19 Impact Analysis
  4. SECTION IV: QUANTITATIVE ANALYSIS
    1. Chemicals and Materials, BY Product (USD Billion)
      1. bort
      2. dust
      3. grit
      4. powder
      5. stone
    2. Chemicals and Materials, BY Type (USD Billion)
      1. polished
      2. rough
    3. Chemicals and Materials, BY Manufacturing Process (USD Billion)
      1. high pressure
      2. high temperature
      3. chemical vapor deposition
    4. Chemicals and Materials, BY Application (USD Billion)
      1. gem
      2. heat sinks/exchangers
      3. high-end electronics
      4. laser and X-ray
      5. machine and cutting tools
      6. surgical machinery
      7. water treatment
      8. quantum computing
      9. optical sensors and scanning
      10. medical
      11. electricals
    5. Chemicals and Materials, BY Region (USD Billion)
      1. North America
      2. Europe
      3. APAC
      4. South America
      5. MEA
  5. SECTION V: COMPETITIVE ANALYSIS
    1. Competitive Landscape
      1. Overview
      2. Competitive Analysis
      3. Market share Analysis
      4. Major Growth Strategy in the Chemicals and Materials
      5. Competitive Benchmarking
      6. Leading Players in Terms of Number of Developments in the Chemicals and Materials
      7. Key developments and growth strategies
      8. Major Players Financial Matrix
    2. Company Profiles
      1. De Beers Group (GB)
      2. Diamond Foundry (US)
      3. Alrosa (RU)
      4. Mitsubishi Materials Corporation (JP)
      5. Gem Diamonds (GB)
      6. Pure Grown Diamonds (US)
      7. Scio Diamond Technology Corporation (US)
      8. New Diamond Technology (RU)
      9. Swarovski (AT)
    3. Appendix
      1. References
      2. Related Reports
  6. LIST OF FIGURES
    1. MARKET SYNOPSIS
    2. NORTH AMERICA MARKET ANALYSIS
    3. US MARKET ANALYSIS BY PRODUCT
    4. US MARKET ANALYSIS BY TYPE
    5. US MARKET ANALYSIS BY MANUFACTURING PROCESS
    6. US MARKET ANALYSIS BY APPLICATION
    7. CANADA MARKET ANALYSIS BY PRODUCT
    8. CANADA MARKET ANALYSIS BY TYPE
    9. CANADA MARKET ANALYSIS BY MANUFACTURING PROCESS
    10. CANADA MARKET ANALYSIS BY APPLICATION
    11. EUROPE MARKET ANALYSIS
    12. GERMANY MARKET ANALYSIS BY PRODUCT
    13. GERMANY MARKET ANALYSIS BY TYPE
    14. GERMANY MARKET ANALYSIS BY MANUFACTURING PROCESS
    15. GERMANY MARKET ANALYSIS BY APPLICATION
    16. UK MARKET ANALYSIS BY PRODUCT
    17. UK MARKET ANALYSIS BY TYPE
    18. UK MARKET ANALYSIS BY MANUFACTURING PROCESS
    19. UK MARKET ANALYSIS BY APPLICATION
    20. FRANCE MARKET ANALYSIS BY PRODUCT
    21. FRANCE MARKET ANALYSIS BY TYPE
    22. FRANCE MARKET ANALYSIS BY MANUFACTURING PROCESS
    23. FRANCE MARKET ANALYSIS BY APPLICATION
    24. RUSSIA MARKET ANALYSIS BY PRODUCT
    25. RUSSIA MARKET ANALYSIS BY TYPE
    26. RUSSIA MARKET ANALYSIS BY MANUFACTURING PROCESS
    27. RUSSIA MARKET ANALYSIS BY APPLICATION
    28. ITALY MARKET ANALYSIS BY PRODUCT
    29. ITALY MARKET ANALYSIS BY TYPE
    30. ITALY MARKET ANALYSIS BY MANUFACTURING PROCESS
    31. ITALY MARKET ANALYSIS BY APPLICATION
    32. SPAIN MARKET ANALYSIS BY PRODUCT
    33. SPAIN MARKET ANALYSIS BY TYPE
    34. SPAIN MARKET ANALYSIS BY MANUFACTURING PROCESS
    35. SPAIN MARKET ANALYSIS BY APPLICATION
    36. REST OF EUROPE MARKET ANALYSIS BY PRODUCT
    37. REST OF EUROPE MARKET ANALYSIS BY TYPE
    38. REST OF EUROPE MARKET ANALYSIS BY MANUFACTURING PROCESS
    39. REST OF EUROPE MARKET ANALYSIS BY APPLICATION
    40. APAC MARKET ANALYSIS
    41. CHINA MARKET ANALYSIS BY PRODUCT
    42. CHINA MARKET ANALYSIS BY TYPE
    43. CHINA MARKET ANALYSIS BY MANUFACTURING PROCESS
    44. CHINA MARKET ANALYSIS BY APPLICATION
    45. INDIA MARKET ANALYSIS BY PRODUCT
    46. INDIA MARKET ANALYSIS BY TYPE
    47. INDIA MARKET ANALYSIS BY MANUFACTURING PROCESS
    48. INDIA MARKET ANALYSIS BY APPLICATION
    49. JAPAN MARKET ANALYSIS BY PRODUCT
    50. JAPAN MARKET ANALYSIS BY TYPE
    51. JAPAN MARKET ANALYSIS BY MANUFACTURING PROCESS
    52. JAPAN MARKET ANALYSIS BY APPLICATION
    53. SOUTH KOREA MARKET ANALYSIS BY PRODUCT
    54. SOUTH KOREA MARKET ANALYSIS BY TYPE
    55. SOUTH KOREA MARKET ANALYSIS BY MANUFACTURING PROCESS
    56. SOUTH KOREA MARKET ANALYSIS BY APPLICATION
    57. MALAYSIA MARKET ANALYSIS BY PRODUCT
    58. MALAYSIA MARKET ANALYSIS BY TYPE
    59. MALAYSIA MARKET ANALYSIS BY MANUFACTURING PROCESS
    60. MALAYSIA MARKET ANALYSIS BY APPLICATION
    61. THAILAND MARKET ANALYSIS BY PRODUCT
    62. THAILAND MARKET ANALYSIS BY TYPE
    63. THAILAND MARKET ANALYSIS BY MANUFACTURING PROCESS
    64. THAILAND MARKET ANALYSIS BY APPLICATION
    65. INDONESIA MARKET ANALYSIS BY PRODUCT
    66. INDONESIA MARKET ANALYSIS BY TYPE
    67. INDONESIA MARKET ANALYSIS BY MANUFACTURING PROCESS
    68. INDONESIA MARKET ANALYSIS BY APPLICATION
    69. REST OF APAC MARKET ANALYSIS BY PRODUCT
    70. REST OF APAC MARKET ANALYSIS BY TYPE
    71. REST OF APAC MARKET ANALYSIS BY MANUFACTURING PROCESS
    72. REST OF APAC MARKET ANALYSIS BY APPLICATION
    73. SOUTH AMERICA MARKET ANALYSIS
    74. BRAZIL MARKET ANALYSIS BY PRODUCT
    75. BRAZIL MARKET ANALYSIS BY TYPE
    76. BRAZIL MARKET ANALYSIS BY MANUFACTURING PROCESS
    77. BRAZIL MARKET ANALYSIS BY APPLICATION
    78. MEXICO MARKET ANALYSIS BY PRODUCT
    79. MEXICO MARKET ANALYSIS BY TYPE
    80. MEXICO MARKET ANALYSIS BY MANUFACTURING PROCESS
    81. MEXICO MARKET ANALYSIS BY APPLICATION
    82. ARGENTINA MARKET ANALYSIS BY PRODUCT
    83. ARGENTINA MARKET ANALYSIS BY TYPE
    84. ARGENTINA MARKET ANALYSIS BY MANUFACTURING PROCESS
    85. ARGENTINA MARKET ANALYSIS BY APPLICATION
    86. REST OF SOUTH AMERICA MARKET ANALYSIS BY PRODUCT
    87. REST OF SOUTH AMERICA MARKET ANALYSIS BY TYPE
    88. REST OF SOUTH AMERICA MARKET ANALYSIS BY MANUFACTURING PROCESS
    89. REST OF SOUTH AMERICA MARKET ANALYSIS BY APPLICATION
    90. MEA MARKET ANALYSIS
    91. GCC COUNTRIES MARKET ANALYSIS BY PRODUCT
    92. GCC COUNTRIES MARKET ANALYSIS BY TYPE
    93. GCC COUNTRIES MARKET ANALYSIS BY MANUFACTURING PROCESS
    94. GCC COUNTRIES MARKET ANALYSIS BY APPLICATION
    95. SOUTH AFRICA MARKET ANALYSIS BY PRODUCT
    96. SOUTH AFRICA MARKET ANALYSIS BY TYPE
    97. SOUTH AFRICA MARKET ANALYSIS BY MANUFACTURING PROCESS
    98. SOUTH AFRICA MARKET ANALYSIS BY APPLICATION
    99. REST OF MEA MARKET ANALYSIS BY PRODUCT
    100. REST OF MEA MARKET ANALYSIS BY TYPE
    101. REST OF MEA MARKET ANALYSIS BY MANUFACTURING PROCESS
    102. REST OF MEA MARKET ANALYSIS BY APPLICATION
    103. KEY BUYING CRITERIA OF CHEMICALS AND MATERIALS
    104. RESEARCH PROCESS OF MRFR
    105. DRO ANALYSIS OF CHEMICALS AND MATERIALS
    106. DRIVERS IMPACT ANALYSIS: CHEMICALS AND MATERIALS
    107. RESTRAINTS IMPACT ANALYSIS: CHEMICALS AND MATERIALS
    108. SUPPLY / VALUE CHAIN: CHEMICALS AND MATERIALS
    109. CHEMICALS AND MATERIALS, BY PRODUCT, 2024 (% SHARE)
    110. CHEMICALS AND MATERIALS, BY PRODUCT, 2024 TO 2035 (USD Billion)
    111. CHEMICALS AND MATERIALS, BY TYPE, 2024 (% SHARE)
    112. CHEMICALS AND MATERIALS, BY TYPE, 2024 TO 2035 (USD Billion)
    113. CHEMICALS AND MATERIALS, BY MANUFACTURING PROCESS, 2024 (% SHARE)
    114. CHEMICALS AND MATERIALS, BY MANUFACTURING PROCESS, 2024 TO 2035 (USD Billion)
    115. CHEMICALS AND MATERIALS, BY APPLICATION, 2024 (% SHARE)
    116. CHEMICALS AND MATERIALS, BY APPLICATION, 2024 TO 2035 (USD Billion)
    117. BENCHMARKING OF MAJOR COMPETITORS
  7. LIST OF TABLES
    1. LIST OF ASSUMPTIONS
    2. North America MARKET SIZE ESTIMATES; FORECAST
      1. BY PRODUCT, 2025-2035 (USD Billion)
      2. BY TYPE, 2025-2035 (USD Billion)
      3. BY MANUFACTURING PROCESS, 2025-2035 (USD Billion)
      4. BY APPLICATION, 2025-2035 (USD Billion)
    3. US MARKET SIZE ESTIMATES; FORECAST
      1. BY PRODUCT, 2025-2035 (USD Billion)
      2. BY TYPE, 2025-2035 (USD Billion)
      3. BY MANUFACTURING PROCESS, 2025-2035 (USD Billion)
      4. BY APPLICATION, 2025-2035 (USD Billion)
    4. Canada MARKET SIZE ESTIMATES; FORECAST
      1. BY PRODUCT, 2025-2035 (USD Billion)
      2. BY TYPE, 2025-2035 (USD Billion)
      3. BY MANUFACTURING PROCESS, 2025-2035 (USD Billion)
      4. BY APPLICATION, 2025-2035 (USD Billion)
    5. Europe MARKET SIZE ESTIMATES; FORECAST
      1. BY PRODUCT, 2025-2035 (USD Billion)
      2. BY TYPE, 2025-2035 (USD Billion)
      3. BY MANUFACTURING PROCESS, 2025-2035 (USD Billion)
      4. BY APPLICATION, 2025-2035 (USD Billion)
    6. Germany MARKET SIZE ESTIMATES; FORECAST
      1. BY PRODUCT, 2025-2035 (USD Billion)
      2. BY TYPE, 2025-2035 (USD Billion)
      3. BY MANUFACTURING PROCESS, 2025-2035 (USD Billion)
      4. BY APPLICATION, 2025-2035 (USD Billion)
    7. UK MARKET SIZE ESTIMATES; FORECAST
      1. BY PRODUCT, 2025-2035 (USD Billion)
      2. BY TYPE, 2025-2035 (USD Billion)
      3. BY MANUFACTURING PROCESS, 2025-2035 (USD Billion)
      4. BY APPLICATION, 2025-2035 (USD Billion)
    8. France MARKET SIZE ESTIMATES; FORECAST
      1. BY PRODUCT, 2025-2035 (USD Billion)
      2. BY TYPE, 2025-2035 (USD Billion)
      3. BY MANUFACTURING PROCESS, 2025-2035 (USD Billion)
      4. BY APPLICATION, 2025-2035 (USD Billion)
    9. Russia MARKET SIZE ESTIMATES; FORECAST
      1. BY PRODUCT, 2025-2035 (USD Billion)
      2. BY TYPE, 2025-2035 (USD Billion)
      3. BY MANUFACTURING PROCESS, 2025-2035 (USD Billion)
      4. BY APPLICATION, 2025-2035 (USD Billion)
    10. Italy MARKET SIZE ESTIMATES; FORECAST
      1. BY PRODUCT, 2025-2035 (USD Billion)
      2. BY TYPE, 2025-2035 (USD Billion)
      3. BY MANUFACTURING PROCESS, 2025-2035 (USD Billion)
      4. BY APPLICATION, 2025-2035 (USD Billion)
    11. Spain MARKET SIZE ESTIMATES; FORECAST
      1. BY PRODUCT, 2025-2035 (USD Billion)
      2. BY TYPE, 2025-2035 (USD Billion)
      3. BY MANUFACTURING PROCESS, 2025-2035 (USD Billion)
      4. BY APPLICATION, 2025-2035 (USD Billion)
    12. Rest of Europe MARKET SIZE ESTIMATES; FORECAST
      1. BY PRODUCT, 2025-2035 (USD Billion)
      2. BY TYPE, 2025-2035 (USD Billion)
      3. BY MANUFACTURING PROCESS, 2025-2035 (USD Billion)
      4. BY APPLICATION, 2025-2035 (USD Billion)
    13. APAC MARKET SIZE ESTIMATES; FORECAST
      1. BY PRODUCT, 2025-2035 (USD Billion)
      2. BY TYPE, 2025-2035 (USD Billion)
      3. BY MANUFACTURING PROCESS, 2025-2035 (USD Billion)
      4. BY APPLICATION, 2025-2035 (USD Billion)
    14. China MARKET SIZE ESTIMATES; FORECAST
      1. BY PRODUCT, 2025-2035 (USD Billion)
      2. BY TYPE, 2025-2035 (USD Billion)
      3. BY MANUFACTURING PROCESS, 2025-2035 (USD Billion)
      4. BY APPLICATION, 2025-2035 (USD Billion)
    15. India MARKET SIZE ESTIMATES; FORECAST
      1. BY PRODUCT, 2025-2035 (USD Billion)
      2. BY TYPE, 2025-2035 (USD Billion)
      3. BY MANUFACTURING PROCESS, 2025-2035 (USD Billion)
      4. BY APPLICATION, 2025-2035 (USD Billion)
    16. Japan MARKET SIZE ESTIMATES; FORECAST
      1. BY PRODUCT, 2025-2035 (USD Billion)
      2. BY TYPE, 2025-2035 (USD Billion)
      3. BY MANUFACTURING PROCESS, 2025-2035 (USD Billion)
      4. BY APPLICATION, 2025-2035 (USD Billion)
    17. South Korea MARKET SIZE ESTIMATES; FORECAST
      1. BY PRODUCT, 2025-2035 (USD Billion)
      2. BY TYPE, 2025-2035 (USD Billion)
      3. BY MANUFACTURING PROCESS, 2025-2035 (USD Billion)
      4. BY APPLICATION, 2025-2035 (USD Billion)
    18. Malaysia MARKET SIZE ESTIMATES; FORECAST
      1. BY PRODUCT, 2025-2035 (USD Billion)
      2. BY TYPE, 2025-2035 (USD Billion)
      3. BY MANUFACTURING PROCESS, 2025-2035 (USD Billion)
      4. BY APPLICATION, 2025-2035 (USD Billion)
    19. Thailand MARKET SIZE ESTIMATES; FORECAST
      1. BY PRODUCT, 2025-2035 (USD Billion)
      2. BY TYPE, 2025-2035 (USD Billion)
      3. BY MANUFACTURING PROCESS, 2025-2035 (USD Billion)
      4. BY APPLICATION, 2025-2035 (USD Billion)
    20. Indonesia MARKET SIZE ESTIMATES; FORECAST
      1. BY PRODUCT, 2025-2035 (USD Billion)
      2. BY TYPE, 2025-2035 (USD Billion)
      3. BY MANUFACTURING PROCESS, 2025-2035 (USD Billion)
      4. BY APPLICATION, 2025-2035 (USD Billion)
    21. Rest of APAC MARKET SIZE ESTIMATES; FORECAST
      1. BY PRODUCT, 2025-2035 (USD Billion)
      2. BY TYPE, 2025-2035 (USD Billion)
      3. BY MANUFACTURING PROCESS, 2025-2035 (USD Billion)
      4. BY APPLICATION, 2025-2035 (USD Billion)
    22. South America MARKET SIZE ESTIMATES; FORECAST
      1. BY PRODUCT, 2025-2035 (USD Billion)
      2. BY TYPE, 2025-2035 (USD Billion)
      3. BY MANUFACTURING PROCESS, 2025-2035 (USD Billion)
      4. BY APPLICATION, 2025-2035 (USD Billion)
    23. Brazil MARKET SIZE ESTIMATES; FORECAST
      1. BY PRODUCT, 2025-2035 (USD Billion)
      2. BY TYPE, 2025-2035 (USD Billion)
      3. BY MANUFACTURING PROCESS, 2025-2035 (USD Billion)
      4. BY APPLICATION, 2025-2035 (USD Billion)
    24. Mexico MARKET SIZE ESTIMATES; FORECAST
      1. BY PRODUCT, 2025-2035 (USD Billion)
      2. BY TYPE, 2025-2035 (USD Billion)
      3. BY MANUFACTURING PROCESS, 2025-2035 (USD Billion)
      4. BY APPLICATION, 2025-2035 (USD Billion)
    25. Argentina MARKET SIZE ESTIMATES; FORECAST
      1. BY PRODUCT, 2025-2035 (USD Billion)
      2. BY TYPE, 2025-2035 (USD Billion)
      3. BY MANUFACTURING PROCESS, 2025-2035 (USD Billion)
      4. BY APPLICATION, 2025-2035 (USD Billion)
    26. Rest of South America MARKET SIZE ESTIMATES; FORECAST
      1. BY PRODUCT, 2025-2035 (USD Billion)
      2. BY TYPE, 2025-2035 (USD Billion)
      3. BY MANUFACTURING PROCESS, 2025-2035 (USD Billion)
      4. BY APPLICATION, 2025-2035 (USD Billion)
    27. MEA MARKET SIZE ESTIMATES; FORECAST
      1. BY PRODUCT, 2025-2035 (USD Billion)
      2. BY TYPE, 2025-2035 (USD Billion)
      3. BY MANUFACTURING PROCESS, 2025-2035 (USD Billion)
      4. BY APPLICATION, 2025-2035 (USD Billion)
    28. GCC Countries MARKET SIZE ESTIMATES; FORECAST
      1. BY PRODUCT, 2025-2035 (USD Billion)
      2. BY TYPE, 2025-2035 (USD Billion)
      3. BY MANUFACTURING PROCESS, 2025-2035 (USD Billion)
      4. BY APPLICATION, 2025-2035 (USD Billion)
    29. South Africa MARKET SIZE ESTIMATES; FORECAST
      1. BY PRODUCT, 2025-2035 (USD Billion)
      2. BY TYPE, 2025-2035 (USD Billion)
      3. BY MANUFACTURING PROCESS, 2025-2035 (USD Billion)
      4. BY APPLICATION, 2025-2035 (USD Billion)
    30. Rest of MEA MARKET SIZE ESTIMATES; FORECAST
      1. BY PRODUCT, 2025-2035 (USD Billion)
      2. BY TYPE, 2025-2035 (USD Billion)
      3. BY MANUFACTURING PROCESS, 2025-2035 (USD Billion)
      4. BY APPLICATION, 2025-2035 (USD Billion)
    31. PRODUCT LAUNCH/PRODUCT DEVELOPMENT/APPROVAL
    32. ACQUISITION/PARTNERSHIP

Synthetic Diamond Market Segmentation

Synthetic Diamond Product Outlook (USD Billion, 2018-2032)

  • Bort
  • Dust
  • Grit
  • Powder
  • Stone

Synthetic Diamond By Type (USD Billion, 2018-2032)

  • Polished
  • Rough

Synthetic Diamond By Manufacturing Process (USD Billion, 2018-2032)

  • High Pressure
  • High Temperature
  • Chemical Vapor Deposition

Synthetic Diamond Application Outlook (USD Billion, 2018-2032)

  • Gem
  • Heat Sinks/Exchangers
  • High-end Electronics
  • Laser and X-ray
  • Machine and Cutting Tools
  • Surgical Machinery
  • Water Treatment
  • Quantum Computing
  • Optical Sensors and Scanning
  • Medical
  • Electricals

Synthetic Diamond Regional Outlook (USD Billion, 2018-2032)

  • North America Outlook (USD Billion, 2018-2032)

    • Synthetic Diamond by Product
      • Bort
      • Dust
      • Grit
      • Powder
      • Stone
    • Synthetic Diamond By Type (USD Billion, 2018-2032)

      • Polished
      • Rough
    • Synthetic Diamond By Manufacturing Process (USD Billion, 2018-2032)

      • High Pressure
      • High Temperature
      • Chemical Vapor Deposition
    • Synthetic Diamond by Application
      • Gem
      • Heat Sinks/Exchangers
      • High-end Electronics
      • Laser and X-ray
      • Machine and Cutting Tools
      • Surgical Machinery
      • Water Treatment
      • Quantum Computing
      • Optical Sensors and Scanning
      • Medical
      • Electricals
    • US Outlook (USD Billion, 2018-2032)

    • Synthetic Diamond by Product
      • Bort
      • Dust
      • Grit
      • Powder
      • Stone
    • Synthetic Diamond By Type (USD Billion, 2018-2032)

      • Polished
      • Rough
    • Synthetic Diamond By Manufacturing Process (USD Billion, 2018-2032)

      • High Pressure
      • High Temperature
      • Chemical Vapor Deposition
    • Synthetic Diamond by Application
      • Gem
      • Heat Sinks/Exchangers
      • High-end Electronics
      • Laser and X-ray
      • Machine and Cutting Tools
      • Surgical Machinery
      • Water Treatment
      • Quantum Computing
      • Optical Sensors and Scanning
      • Medical
      • Electricals
    • Canada Outlook (USD Billion, 2018-2032)

    • Synthetic Diamond by Product
      • Bort
      • Dust
      • Grit
      • Powder
      • Stone
    • Synthetic Diamond By Type (USD Billion, 2018-2032)

      • Polished
      • Rough
    • Synthetic Diamond By Manufacturing Process (USD Billion, 2018-2032)

      • High Pressure
      • High Temperature
      • Chemical Vapor Deposition
    • Synthetic Diamond by Application
      • Gem
      • Heat Sinks/Exchangers
      • High-end Electronics
      • Laser and X-ray
      • Machine and Cutting Tools
      • Surgical Machinery
      • Water Treatment
      • Quantum Computing
      • Optical Sensors and Scanning
      • Medical
      • Electricals
  • Europe Outlook (USD Billion, 2018-2032)

    • Synthetic Diamond by Product
      • Bort
      • Dust
      • Grit
      • Powder
      • Stone
    • Synthetic Diamond By Type (USD Billion, 2018-2032)

      • Polished
      • Rough
    • Synthetic Diamond By Manufacturing Process (USD Billion, 2018-2032)

      • High Pressure
      • High Temperature
      • Chemical Vapor Deposition
    • Synthetic Diamond by Application
      • Gem
      • Heat Sinks/Exchangers
      • High-end Electronics
      • Laser and X-ray
      • Machine and Cutting Tools
      • Surgical Machinery
      • Water Treatment
      • Quantum Computing
      • Optical Sensors and Scanning
      • Medical
      • Electricals
    • Germany Outlook (USD Billion, 2018-2032)

    • Synthetic Diamond by Product
      • Bort
      • Dust
      • Grit
      • Powder
      • Stone
    • Synthetic Diamond By Type (USD Billion, 2018-2032)

      • Polished
      • Rough
    • Synthetic Diamond By Manufacturing Process (USD Billion, 2018-2032)

      • High Pressure
      • High Temperature
      • Chemical Vapor Deposition
    • Synthetic Diamond by Application
      • Gem
      • Heat Sinks/Exchangers
      • High-end Electronics
      • Laser and X-ray
      • Machine and Cutting Tools
      • Surgical Machinery
      • Water Treatment
      • Quantum Computing
      • Optical Sensors and Scanning
      • Medical
      • Electricals
    • France Outlook (USD Billion, 2018-2032)

    • Synthetic Diamond by Product
      • Bort
      • Dust
      • Grit
      • Powder
      • Stone
    • Synthetic Diamond By Type (USD Billion, 2018-2032)

      • Polished
      • Rough
    • Synthetic Diamond By Manufacturing Process (USD Billion, 2018-2032)

      • High Pressure
      • High Temperature
      • Chemical Vapor Deposition
    • Synthetic Diamond by Application
      • Gem
      • Heat Sinks/Exchangers
      • High-end Electronics
      • Laser and X-ray
      • Machine and Cutting Tools
      • Surgical Machinery
      • Water Treatment
      • Quantum Computing
      • Optical Sensors and Scanning
      • Medical
      • Electricals
    • UK Outlook (USD Billion, 2018-2032)

    • Synthetic Diamond by Product
      • Bort
      • Dust
      • Grit
      • Powder
      • Stone
    • Synthetic Diamond By Type (USD Billion, 2018-2032)

      • Polished
      • Rough
    • Synthetic Diamond By Manufacturing Process (USD Billion, 2018-2032)

      • High Pressure
      • High Temperature
      • Chemical Vapor Deposition
    • Synthetic Diamond by Application
      • Gem
      • Heat Sinks/Exchangers
      • High-end Electronics
      • Laser and X-ray
      • Machine and Cutting Tools
      • Surgical Machinery
      • Water Treatment
      • Quantum Computing
      • Optical Sensors and Scanning
      • Medical
      • Electricals
    • Italy Outlook (USD Billion, 2018-2032)

    • Synthetic Diamond by Product
      • Bort
      • Dust
      • Grit
      • Powder
      • Stone
    • Synthetic Diamond By Type (USD Billion, 2018-2032)

      • Polished
      • Rough
    • Synthetic Diamond By Manufacturing Process (USD Billion, 2018-2032)

      • High Pressure
      • High Temperature
      • Chemical Vapor Deposition
    • Synthetic Diamond by Application
      • Gem
      • Heat Sinks/Exchangers
      • High-end Electronics
      • Laser and X-ray
      • Machine and Cutting Tools
      • Surgical Machinery
      • Water Treatment
      • Quantum Computing
      • Optical Sensors and Scanning
      • Medical
      • Electricals
    • Spain Outlook (USD Billion, 2018-2032)

    • Synthetic Diamond by Product
      • Bort
      • Dust
      • Grit
      • Powder
      • Stone
    • Synthetic Diamond By Type (USD Billion, 2018-2032)

      • Polished
      • Rough
    • Synthetic Diamond By Manufacturing Process (USD Billion, 2018-2032)

      • High Pressure
      • High Temperature
      • Chemical Vapor Deposition
    • Synthetic Diamond by Application
      • Gem
      • Heat Sinks/Exchangers
      • High-end Electronics
      • Laser and X-ray
      • Machine and Cutting Tools
      • Surgical Machinery
      • Water Treatment
      • Quantum Computing
      • Optical Sensors and Scanning
      • Medical
      • Electricals
    • Rest Of Europe Outlook (USD Billion, 2018-2032)

    • Synthetic Diamond by Product
      • Bort
      • Dust
      • Grit
      • Powder
      • Stone
    • Synthetic Diamond By Type (USD Billion, 2018-2032)

      • Polished
      • Rough
    • Synthetic Diamond By Manufacturing Process (USD Billion, 2018-2032)

      • High Pressure
      • High Temperature
      • Chemical Vapor Deposition
    • Synthetic Diamond by Application
      • Gem
      • Heat Sinks/Exchangers
      • High-end Electronics
      • Laser and X-ray
      • Machine and Cutting Tools
      • Surgical Machinery
      • Water Treatment
      • Quantum Computing
      • Optical Sensors and Scanning
      • Medical
      • Electricals
  • Asia-Pacific Outlook (USD Billion, 2018-2032)

    • Synthetic Diamond by Product
      • Bort
      • Dust
      • Grit
      • Powder
      • Stone
    • Synthetic Diamond By Type (USD Billion, 2018-2032)

      • Polished
      • Rough
    • Synthetic Diamond By Manufacturing Process (USD Billion, 2018-2032)

      • High Pressure
      • High Temperature
      • Chemical Vapor Deposition
    • Synthetic Diamond by Application
      • Gem
      • Heat Sinks/Exchangers
      • High-end Electronics
      • Laser and X-ray
      • Machine and Cutting Tools
      • Surgical Machinery
      • Water Treatment
      • Quantum Computing
      • Optical Sensors and Scanning
      • Medical
      • Electricals
    • China Outlook (USD Billion, 2018-2032)

    • Synthetic Diamond by Product
      • Bort
      • Dust
      • Grit
      • Powder
      • Stone
    • Synthetic Diamond By Type (USD Billion, 2018-2032)

      • Polished
      • Rough
    • Synthetic Diamond By Manufacturing Process (USD Billion, 2018-2032)

      • High Pressure
      • High Temperature
      • Chemical Vapor Deposition
    • Synthetic Diamond by Application
      • Gem
      • Heat Sinks/Exchangers
      • High-end Electronics
      • Laser and X-ray
      • Machine and Cutting Tools
      • Surgical Machinery
      • Water Treatment
      • Quantum Computing
      • Optical Sensors and Scanning
      • Medical
      • Electricals
    • Japan Outlook (USD Billion, 2018-2032)

    • Synthetic Diamond by Product
      • Bort
      • Dust
      • Grit
      • Powder
      • Stone
    • Synthetic Diamond By Type (USD Billion, 2018-2032)

      • Polished
      • Rough
    • Synthetic Diamond By Manufacturing Process (USD Billion, 2018-2032)

      • High Pressure
      • High Temperature
      • Chemical Vapor Deposition
    • Synthetic Diamond by Application
      • Gem
      • Heat Sinks/Exchangers
      • High-end Electronics
      • Laser and X-ray
      • Machine and Cutting Tools
      • Surgical Machinery
      • Water Treatment
      • Quantum Computing
      • Optical Sensors and Scanning
      • Medical
      • Electricals
    • India Outlook (USD Billion, 2018-2032)

    • Synthetic Diamond by Product
      • Bort
      • Dust
      • Grit
      • Powder
      • Stone
    • Synthetic Diamond By Type (USD Billion, 2018-2032)

      • Polished
      • Rough
    • Synthetic Diamond By Manufacturing Process (USD Billion, 2018-2032)

      • High Pressure
      • High Temperature
      • Chemical Vapor Deposition
    • Synthetic Diamond by Application
      • Gem
      • Heat Sinks/Exchangers
      • High-end Electronics
      • Laser and X-ray
      • Machine and Cutting Tools
      • Surgical Machinery
      • Water Treatment
      • Quantum Computing
      • Optical Sensors and Scanning
      • Medical
      • Electricals
    • Australia Outlook (USD Billion, 2018-2032)

    • Synthetic Diamond by Product
      • Bort
      • Dust
      • Grit
      • Powder
      • Stone
    • Synthetic Diamond By Type (USD Billion, 2018-2032)

      • Polished
      • Rough
    • Synthetic Diamond By Manufacturing Process (USD Billion, 2018-2032)

      • High Pressure
      • High Temperature
      • Chemical Vapor Deposition
    • Synthetic Diamond by Application
      • Gem
      • Heat Sinks/Exchangers
      • High-end Electronics
      • Laser and X-ray
      • Machine and Cutting Tools
      • Surgical Machinery
      • Water Treatment
      • Quantum Computing
      • Optical Sensors and Scanning
      • Medical
      • Electricals
    • Rest of Asia-Pacific Outlook (USD Billion, 2018-2032)

    • Synthetic Diamond by Product
      • Bort
      • Dust
      • Grit
      • Powder
      • Stone
    • Synthetic Diamond By Type (USD Billion, 2018-2032)

      • Polished
      • Rough
    • Synthetic Diamond By Manufacturing Process (USD Billion, 2018-2032)

      • High Pressure
      • High Temperature
      • Chemical Vapor Deposition
    • Synthetic Diamond by Application
      • Gem
      • Heat Sinks/Exchangers
      • High-end Electronics
      • Laser and X-ray
      • Machine and Cutting Tools
      • Surgical Machinery
      • Water Treatment
      • Quantum Computing
      • Optical Sensors and Scanning
      • Medical
      • Electricals
  • Rest of the World Outlook (USD Billion, 2018-2032)

    • Synthetic Diamond by Product
      • Bort
      • Dust
      • Grit
      • Powder
      • Stone
    • Synthetic Diamond By Type (USD Billion, 2018-2032)

      • Polished
      • Rough
    • Synthetic Diamond By Manufacturing Process (USD Billion, 2018-2032)

      • High Pressure
      • High Temperature
      • Chemical Vapor Deposition
    • Synthetic Diamond by Application
      • Gem
      • Heat Sinks/Exchangers
      • High-end Electronics
      • Laser and X-ray
      • Machine and Cutting Tools
      • Surgical Machinery
      • Water Treatment
      • Quantum Computing
      • Optical Sensors and Scanning
      • Medical
      • Electricals
    • Middle East Outlook (USD Billion, 2018-2032)

    • Synthetic Diamond by Product
      • Bort
      • Dust
      • Grit
      • Powder
      • Stone
    • Synthetic Diamond By Type (USD Billion, 2018-2032)

      • Polished
      • Rough
    • Synthetic Diamond By Manufacturing Process (USD Billion, 2018-2032)

      • High Pressure
      • High Temperature
      • Chemical Vapor Deposition
    • Synthetic Diamond by Application
      • Gem
      • Heat Sinks/Exchangers
      • High-end Electronics
      • Laser and X-ray
      • Machine and Cutting Tools
      • Surgical Machinery
      • Water Treatment
      • Quantum Computing
      • Optical Sensors and Scanning
      • Medical
      • Electricals
    • Africa Outlook (USD Billion, 2018-2032)

    • Synthetic Diamond by Product
      • Bort
      • Dust
      • Grit
      • Powder
      • Stone
    • Synthetic Diamond By Type (USD Billion, 2018-2032)

      • Polished
      • Rough
    • Synthetic Diamond By Manufacturing Process (USD Billion, 2018-2032)

      • High Pressure
      • High Temperature
      • Chemical Vapor Deposition
    • Synthetic Diamond by Application
      • Gem
      • Heat Sinks/Exchangers
      • High-end Electronics
      • Laser and X-ray
      • Machine and Cutting Tools
      • Surgical Machinery
      • Water Treatment
      • Quantum Computing
      • Optical Sensors and Scanning
      • Medical
      • Electricals
    • Latin America Outlook (USD Billion, 2018-2032)

    • Synthetic Diamond by Product
      • Bort
      • Dust
      • Grit
      • Powder
      • Stone
    • Synthetic Diamond By Type (USD Billion, 2018-2032)

      • Polished
      • Rough
    • Synthetic Diamond By Manufacturing Process (USD Billion, 2018-2032)

      • High Pressure
      • High Temperature
      • Chemical Vapor Deposition
    • Synthetic Diamond by Application
      • Gem
      • Heat Sinks/Exchangers
      • High-end Electronics
      • Laser and X-ray
      • Machine and Cutting Tools
      • Surgical Machinery
      • Water Treatment
      • Quantum Computing
      • Optical Sensors and Scanning
      • Medical
      • Electricals
Infographic

Free Sample Request

Kindly complete the form below to receive a free sample of this Report

Get Free Sample

Customer Strories

“I am very pleased with how market segments have been defined in a relevant way for my purposes (such as "Portable Freezers & refrigerators" and "last-mile"). In general the report is well structured. Thanks very much for your efforts.”

Victoria Milne

Founder

Compare Licence

×
Features License Type
Single User Multiuser License Enterprise User
Price $4,950 $5,950 $7,250
Maximum User Access Limit 1 User Upto 10 Users Unrestricted Access Throughout the Organization
Free Customization
Direct Access to Analyst
Deliverable Format
Platform Access
Discount on Next Purchase 10% 15% 15%
Printable Versions