Transaction Monitoring Market

Key Players: NICE Actimize, Oracle Financial Services, SAS Institute, BAE Systems (NetReveal), FIS, Fiserv, ACI Worldwide, Temenos

Transaction Monitoring Market

Transaction Monitoring Market Size, Share and Research Report By Component (Solution, Services), By Deployment Mode (Cloud, On-Premises), By Application (Anti-Money Laundering, Fraud Detection & Prevention, Compliance Management), By Organization Size (Large Enterprises, Small and Medium Enterprises), By Industry Vertical (BFSI, Government & Defense, Retail & E-Commerce, Healthcare, IT & Telecom) and By Regional (North America, Europe, South America, Asia Pacific, Middle East and Africa) - Industry Forecast to 2035.
ID: MRFR/ICT/6250-HCR
100 Pages
Ankit Gupta
Last Updated: June 22, 2026

Transaction Monitoring Market Summary

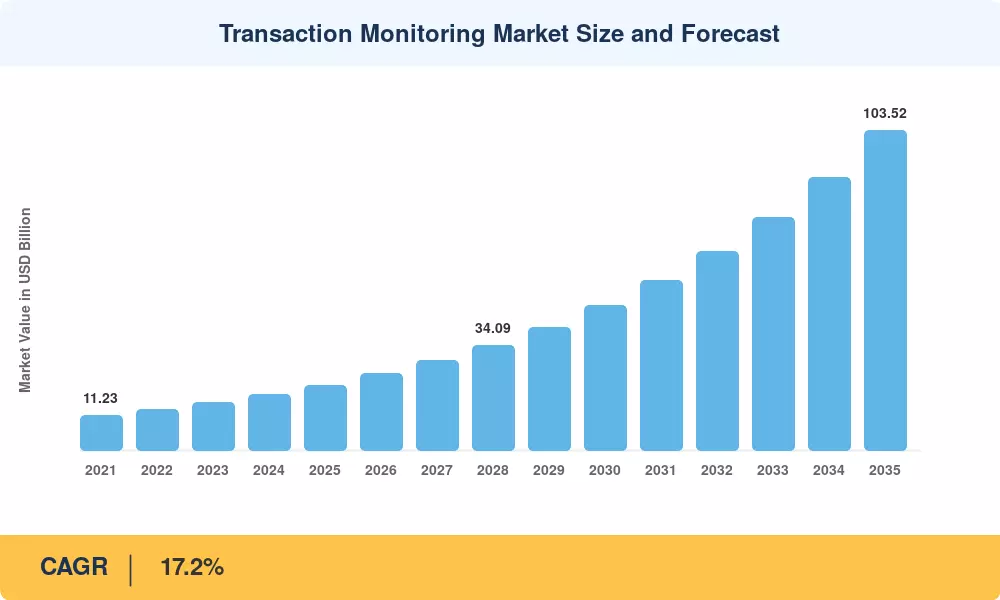
The Transaction Monitoring Market was valued at USD 21.18 Billion in 2025 and is projected to reach USD 24.82 Billion by 2026, climbing to USD 103.52 Billion by 2035 at a CAGR of 17.2% during the forecast period (2026–2035). This acceleration is rooted in tightening global anti-money-laundering mandates — the EU's Anti-Money Laundering Authority (AMLA), formally seated in 2025, now compels direct supervisory oversight of high-risk financial institutions across 27 member states [1]. Simultaneously, the Financial Crimes Enforcement Network (FinCEN) in the United States expanded beneficial-ownership reporting requirements under the Corporate Transparency Act, broadening the compliance surface area for banks, fintechs, and payment processors [2].

A decisive shift is underway from static, rule-based alert engines toward AI-native platforms that fuse entity resolution, network analytics, and real-time payment monitoring into unified compliance stacks. Legacy systems built on batch-processing architectures are giving way to cloud-deployed microservices capable of scoring millions of transactions per second. Global spending on compliance technology surpassed USD 35 Billion in 2024, with financial institutions channeling roughly 18% of that figure into transaction surveillance modernization [3]. Integrated "FRAML" architectures — combining fraud, AML, and sanctions screening in a single data pipeline — are rapidly becoming the procurement default for Tier-1 and Tier-2 banks.

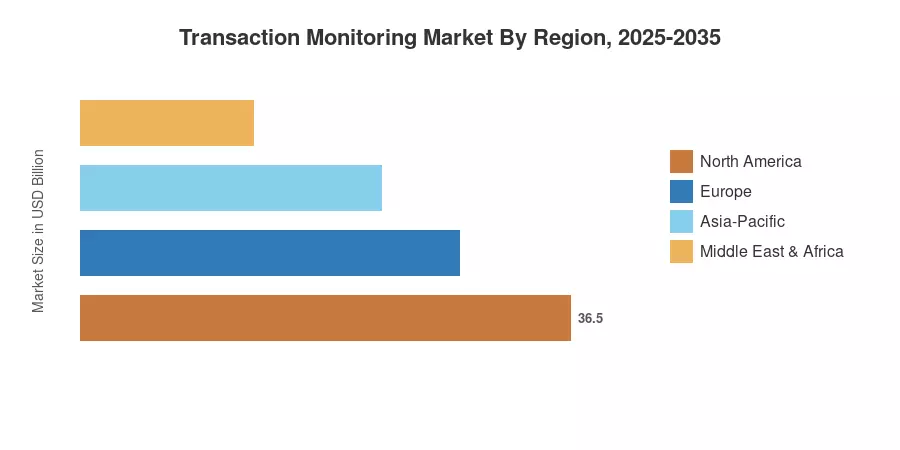
North America commanded approximately 30.4% of the Transaction Monitoring Market in 2025, anchored by stringent U.S. Bank Secrecy Act enforcement and Canada's FINTRAC regime. Asia-Pacific is the fastest-growing region at an 18.5% CAGR through 2035, driven by India's Digital Personal Data Protection Act and China's cross-border payment oversight expansion. Europe holds the second-largest share, propelled by MiCA implementation and AMLA's cross-border supervisory mandates. As digital payment volumes accelerate past USD 15 Trillion annually worldwide, the Transaction Monitoring Market is positioned for sustained double-digit expansion through the end of the decade and beyond [4].


Transaction Monitoring Market — Key Report Takeaways

By Component

  • Solutions accounted for 65.9% of the Transaction Monitoring Market in 2025, reflecting enterprise demand for end-to-end platforms that bundle case management, alert triage, and regulatory reporting.
  • Services are expanding at a 19.6% CAGR through 2035 as institutions increasingly outsource model validation, tuning, and managed-detection operations to specialist providers.

By Deployment Mode

  • Cloud deployment is growing at a 20.8% CAGR between 2026 and 2035, outpacing on-premises alternatives as banks pursue elastic scalability and lower infrastructure overhead.


By Application


  • Anti-money laundering held a 38.5% revenue share in 2025, remaining the largest application category.
  • Fraud detection and prevention is advancing at the fastest pace with a 22.3% CAGR to 2035, spurred by card-not-present fraud losses exceeding USD 10 Billion annually in the U.S. alone.

By Region

  • North America led the Transaction Monitoring Market with a 30.4% share in 2025, underpinned by FinCEN enforcement actions and high banking technology adoption.
  • Asia-Pacific records an 18.5% CAGR through 2035, supported by rapid UPI and e-wallet penetration across India, Indonesia, and the Philippines.


Transaction Monitoring Market — Size and Forecast (2021–2035)

Market Research Future's estimates draw on primary interviews with compliance officers, vendor briefings, regulatory filings, and proprietary demand models calibrated against published benchmarks. Historical figures reflect actual vendor revenues and institutional spending disclosures; forecast values apply a compound growth trajectory informed by regulatory pipeline analysis and digital-payment volume projections.

Transaction Monitoring Market Size and Forecast
Our Impact
Enabled $4.3B Revenue Impact for Fortune 500 and Leading Multinationals
Partnering with 2000+ Global Organizations Each Year
30K+ Citations by Top-Tier Firms in the Industry

Driver Impact Analysis

Driver ~% Impact on CAGR Geographic Relevance Impact Timeline
Tightening AML/CFT regulatory mandates 25–30% Global Short-term (≤2 yr)
AI and machine-learning integration 20–25% North America, Europe Medium-term (2–4 yr)
Digital payment volume explosion 15–20% Asia-Pacific, MEA Long-term (≥4 yr)
Cloud migration and SaaS adoption 12–15% Global Medium-term (2–4 yr)
Open-banking and API-driven ecosystems 8–10% Europe, Asia-Pacific Medium-term (2–4 yr)
CBDC and stablecoin oversight requirements 5–8% Global Long-term (≥4 yr)
Cyber-fraud escalation and ransomware-linked laundering 5–7% North America, Europe Short-term (≤2 yr)


Tightening AML/CFT Regulatory Mandates

Globally, regulators are increasing the scope of required entities and stepping up enforcement. Starting in 2026, AMLA will directly oversee up to 40 high-risk financial institutions with an initial yearly budget of EUR 45 million, encouraging investment in monitoring infrastructure that complies with EU-wide technical requirements [1]. FinCEN's 2024 beneficial-ownership regulation expanded reporting requirements to almost 32 million small firms in the US, resulting in a new compliance burden that necessitates automated entity-screening and suspicious activity detection capabilities [2]. Global AML fines totalled more than $5 billion in 2024, supporting the cost-of-non-compliance calculation that influences procurement spending [10].


AI and Machine-Learning Integration

Machine-learning models trained on entity-behavior baselines are cutting false-positive rates by 40–60% at early-adopter institutions, directly lowering the cost per investigated alert from approximately USD 30 to under USD 12 [5]. NICE Actimize reported that its supervised-learning models reduced Level-1 analyst workloads by 52% across a portfolio of 14 global banks in 2024 [11]. The shift from deterministic rules to probabilistic scoring also improves detection of layering schemes and trade-based laundering patterns that static thresholds routinely miss.

Digital-Payment Volume Explosion

By the end of 2024, the value of digital payments worldwide exceeded USD 15 trillion, with India's Unified Payments Interface (UPI) reaching a record 16.73 billion transactions in a single month [4]. The Transaction Monitoring Market's addressable data surface grows with each additional payment flow that generates a monitoring obligation. In 2024, over 55% of adults in Southeast Asia used mobile wallets, creating a new need for lightweight, API-first monitoring modules that connect to non-bank payment service providers [12].


Cloud Migration and SaaS Adoption

On-premises monitoring appliances are losing ground to cloud-native SaaS platforms that offer elastic compute, faster rule deployment, and lower upfront capital expenditure. A 2024 survey found that 61% of compliance technology buyers ranked "cloud-first" as a mandatory procurement criterion, up from 38% in 2021 [6]. Cloud architecture also enables vendors to deliver continuous model updates and shared typology libraries, accelerating time-to-detection for emerging threat patterns.


Restraints Impact Analysis

Restraint ~% Impact on CAGR Geographic Relevance Impact Timeline
High false-positive rates and alert fatigue –3 to –5% Global Short-term (≤2 yr)
Data privacy and cross-border data-residency conflicts –2 to –4% Europe, Asia-Pacific Medium-term (2–4 yr)
Legacy-system integration complexity –2 to –3% Global Medium-term (2–4 yr)
Talent shortage in compliance analytics –1 to –2% Global Long-term (≥4 yr)
Vendor lock-in and switching costs –1 to –2% North America, Europe Long-term (≥4 yr)


High False-Positive Rates and Alert Fatigue

Compliance analysts spend the great majority of their time closing innocuous alarms rather than looking into real concerns because many institutions still have false-positive rates exceeding 90% despite advancements in AI [13]. The ensuing alert fatigue undermines the efficacy of investigators and causes sharp attrition in compliance teams, often depleting operational experience. Because institutions are reluctant to migrate mid-contract when backlogs are still unresolved, this dynamic slows down technology refresh cycles.


Data-Privacy and Cross-Border Conflicts

GDPR's data-minimization principles and emerging Asian data-localization statutes (India's DPDP Act, Indonesia's PDP Law) create friction for vendors that need to aggregate transaction data across jurisdictions for pattern detection [14]. Financial institutions operating in 10 or more countries often maintain separate regional instances of their monitoring platform, inflating infrastructure costs by 20–35% compared to a single global deployment. The tension between privacy regulators demanding data containment and AML regulators demanding holistic visibility remains structurally unresolved.

Legacy-System Integration Complexity

Many core banking platforms deployed in the 2000s lack real-time event-streaming interfaces, forcing transaction monitoring vendors to rely on overnight batch feeds that introduce 12- to 24-hour detection latency [15]. Middleware-based integration projects at large banks routinely exceed 12 months and USD 5 Million in implementation costs, discouraging smaller institutions from undertaking modernization without external system-integrator support.


Transaction Monitoring Market Opportunities

FRAML Convergence and Platform Consolidation

Banks that historically maintained separate fraud and AML engines are consolidating onto unified FRAML platforms to eliminate data silos and reduce total vendor spend by 25–30%. Vendors offering single-stack solutions with shared entity graphs, combined alert queues, and cross-domain case management hold a decisive positioning advantage through 2030.

Emerging-Market Financial Inclusion Mandates

Rural access has been substantially modernized by the CBN's growth of Payment Service Bank (PSB) and mobile money frameworks. Central banks in South Asia and sub-Saharan Africa are licensing new digital-banking providers at previously unheard-of rates, and each new license entails a monitoring duty. Vendors can outperform Western incumbents in high-growth emerging-market revenue by providing lightweight, modular, and reasonably priced platforms designed for low-transaction-volume institutions.


Crypto-Asset and CBDC Monitoring

As the EU's Markets in Crypto-Assets (MiCA) regulation enters full enforcement and multiple central banks pilot retail CBDCs, a parallel monitoring infrastructure is emerging for digital-asset rails [8]. The Transaction Monitoring Market stands to benefit from a second compliance layer that overlaps with — but is architecturally distinct from — traditional fiat surveillance, opening a greenfield TAM estimated at USD 4–6 Billion by 2030.

Data Monetization Through Consortium Analytics

Anonymized, aggregated transaction-pattern data holds commercial value for insurers, credit-scoring bureaus, and government risk assessors. Vendors that position their platforms as consortium data-hubs — where participating institutions contribute de-identified typologies and receive enriched threat intelligence in return — can create recurring data-licensing revenue streams that diversify income beyond software subscriptions.

RegTech-as-a-Service for SMEs

Small and medium enterprises face the same regulatory obligations as large banks but lack dedicated compliance teams. The rise of API-delivered, pay-per-alert monitoring modules enables fintechs and community banks to access enterprise-grade detection without enterprise-grade budgets. This segment is expanding at a 21.4% CAGR through 2035, representing one of the Transaction Monitoring Market's highest-growth pockets.


Transaction Monitoring Market Future Outlook

AI-Autonomous Compliance Operations

By 2030, leading institutions will operate monitoring environments where machine-learning models autonomously triage, investigate, and close up to 70% of alerts without human intervention. The remaining investigator workload will shift toward complex, multi-jurisdictional cases that require judgment and regulatory dialogue. projects that autonomous compliance workflows will reduce per-alert operating costs by 65% relative to 2025 baselines, reshaping the economics of the Transaction Monitoring Market [5].

Platform Economics and Consortium Models

Vendor business models are migrating from perpetual licenses toward consumption-based pricing tied to transaction volumes and alert counts. This shift enables smaller institutions to adopt enterprise-grade monitoring at accessible price points while giving vendors more predictable recurring revenue. Consortium data-sharing models — where anonymized typologies circulate among participating banks — will further enhance detection accuracy and create network effects that favor large-platform vendors [17].

Digital-Currency Rail Integration

Retail CBDC pilots are active in over 30 countries, and the BIS estimates that 15 central banks will operate live CBDC systems by 2028 [8]. Each deployment introduces a parallel transaction rail requiring dedicated monitoring logic, wallet-cluster tracing, and programmable compliance rules. The Transaction Monitoring Market will absorb this incremental workload, with crypto and CBDC monitoring expected to account for 8–12% of total platform revenue by 2032.

ESG-Linked Financial Crime Surveillance

Environmental, social, and governance (ESG) mandates are intersecting with financial crime compliance as regulators scrutinize greenwashing-linked capital flows and sanctions evasion through ESG-labeled instruments. The EU's Corporate Sustainability Due Diligence Directive requires companies to map supply-chain financial flows, creating a new monitoring use case that extends transaction surveillance beyond traditional banking channels [7]. Vendors that embed ESG-risk scoring into their platforms will differentiate in a market increasingly shaped by non-financial regulatory drivers.


Transaction Monitoring Market Segmentation

By Component

Segment Key Metric Primary Demand Driver
Solution 65.9% share (2025) End-to-end platform consolidation
Services 19.6% CAGR (2026–2035) Managed detection, model validation, and outsourcing


Solutions encompass software platforms for alert generation, case management, regulatory reporting, and entity-risk scoring. The Transaction Monitoring Market's solutions segment dominates because financial institutions prefer integrated suites that reduce point-solution sprawl and simplify audit trails. Services are accelerating as compliance teams face persistent analyst shortages — managed-service providers now handle Level-1 triage for over 200 banks globally, enabling in-house teams to focus on complex investigations and regulatory liaison.

By Deployment Mode

Segment Key Metric Primary Demand Driver
Cloud 20.8% CAGR (2026–2035) Elastic scalability; faster rule deployment
On-Premises USD 8.73 Billion (2025) Data-sovereignty mandates; legacy integration


Cloud-deployed monitoring platforms are gaining share rapidly because they offer continuous model updates, shared typology libraries, and significantly lower upfront capital expenditure. On-premises installations persist among institutions in jurisdictions with strict data-residency requirements — notably Germany, China, and parts of the Middle East — where regulators mandate that transaction data remain within national borders.

By Application

Segment Key Metric Primary Demand Driver
Anti-Money Laundering 38.5% share (2025) Regulatory enforcement intensity
Fraud Detection & Prevention 22.3% CAGR (2026–2035) Card-not-present and APP fraud escalation
Compliance Management USD 3.18 Billion (2025) Cross-border reporting harmonization


Anti-money laundering remains the largest application because statutory obligations in every major jurisdiction require institutions to screen, report, and retain transaction data. Fraud detection is the fastest-growing application as authorized push payment (APP) scams and account-takeover attacks outpace traditional check-fraud and card-skimming methods. The Transaction Monitoring Market is also seeing strong demand for compliance management modules that automate sanction-list screening and beneficial-ownership verification.

By Organization Size

Segment Key Metric Primary Demand Driver
Large Enterprises 63.1% share (2025) Multi-jurisdictional compliance obligations
Small and Medium Enterprises 21.4% CAGR (2026–2035) RegTech-as-a-Service accessibility


Large enterprises account for the bulk of spending because they operate across multiple regulatory jurisdictions and process the highest transaction volumes. SMEs are growing faster as API-first, pay-per-alert platforms lower the entry barrier — community banks, credit unions, and fintech startups that previously relied on manual processes are now adopting automated monitoring solutions at scale.

By Industry Vertical

Segment Key Metric Primary Demand Driver
BFSI 52.4% share (2025) Mandatory AML/CFT obligations
Government & Defense USD 2.03 Billion (2025) Sanctions enforcement; procurement fraud detection
Retail & E-Commerce 23.4% CAGR (2026–2035) Payment-fraud escalation; chargeback management
Healthcare CAGR 18.2% Claims-fraud detection; HIPAA-linked payment screening
IT & Telecom USD 1.27 Billion (2025) Subscription fraud and SIM-swap prevention


BFSI remains the anchor vertical because banking regulators impose the most prescriptive monitoring obligations. Retail and e-commerce is the fastest-growing vertical as online merchants face rising chargeback rates and increasingly sophisticated bot-driven fraud attacks. The Transaction Monitoring Market's expansion into non-financial verticals — healthcare billing fraud, government procurement screening, telecom subscription fraud — signals a broadening compliance perimeter that will sustain above-market growth through 2035.


Regional Market Share Analysis

Region Key Metric Primary Investment Themes
North America 30.4% share (2025) BSA/AML enforcement; AI-model governance
Europe 26.2% share (2025) AMLA supervision; MiCA crypto oversight
Asia-Pacific 18.5% CAGR (2026–2035) UPI/e-wallet expansion; digital-ID integration
South America USD 1.74 Billion (2025) Pix real-time payments; fintech licensing
Middle East & Africa 19.2% CAGR (2026–2035) Mobile-money regulation; FATF grey-list remediation
Total USD 21.18 Billion (2025)

The Transaction Monitoring Market displays pronounced regional variation in maturity, growth velocity, and regulatory catalysts. North America and Europe represent the most mature compliance ecosystems, while Asia-Pacific and the Middle East & Africa are scaling rapidly on the back of digital-payment proliferation and new supervisory frameworks.


North America

Country Key Metric Key Driver
United States 78.5% of regional share FinCEN enforcement; Corporate Transparency Act
Canada CAGR 16.8% FINTRAC updates; open-banking framework
Mexico USD 0.42 Billion (2025) Fintech Law compliance; remittance monitoring


The United States dominates North American spend, propelled by FinCEN's expanding enforcement agenda and a wave of consent orders that compelled banks to overhaul surveillance technology. Canada's FINTRAC modernization roadmap, including mandatory virtual-asset service provider registration, is driving incremental demand. Mexico's 2024 Fintech Law amendments extended monitoring obligations to over 600 licensed fintech entities, creating a new addressable pocket within the Transaction Monitoring Market [2].

Europe

Country Key Metric Key Driver
Germany 22.8% of regional share BaFin enforcement intensity
United Kingdom CAGR 16.4% FCA transaction reporting reforms
France USD 0.78 Billion (2025) Tracfin analytical expansion
Italy CAGR 15.9% UIF digital-reporting mandates
Spain 7.1% of regional share Sepblac supervisory modernization
Nordic Countries CAGR 16.1% Nordics AML cooperation pact
Russia USD 0.29 Billion (2025) Domestic payment-system oversight
Rest of Europe 14.3% of regional share Multi-jurisdictional AMLA harmonization


AMLA's Frankfurt headquarters will coordinate supervision across all 27 EU member states, compelling a baseline technology standard that lifts compliance spending even in smaller markets. The UK's FCA has proposed expanding suspicious-activity report (SAR) automation requirements, catalyzing replacement cycles for aging monitoring engines deployed during the early 2010s [1].

Asia-Pacific

Country Key Metric Key Driver
China 28.4% of regional share PBOC cross-border payment oversight
India CAGR 20.3% UPI scale; DPDP Act compliance
Japan USD 0.71 Billion (2025) JAFIC modernization; cashless push
South Korea CAGR 18.7% KoFIU reporting upgrades
ASEAN 19.5% CAGR Mobile-wallet regulation; FATF mutual evaluations
Rest of Asia-Pacific 11.2% of regional share Digital-banking license mandates


India's transaction-monitoring spend is rising sharply as UPI volumes exceed 15 Billion monthly transactions and the Reserve Bank of India tightens oversight of payment aggregators. China's People's Bank expanded reporting requirements for cross-border digital-yuan transactions in 2024, creating demand for specialized monitoring modules [12].

South America

Country Key Metric Key Driver
Brazil 62.3% of regional share Pix instant payments; Banco Central do Brasil mandates
Argentina CAGR 18.9% UIF digital-asset reporting rules
Rest of South America USD 0.31 Billion (2025) Fintech licensing and e-money regulation


Brazil's Pix system processed over 42 Billion transactions in 2024, making it one of the world's highest-volume instant-payment networks. Each transaction triggers real-time screening obligations, positioning Brazil as the clear anchor for the Transaction Monitoring Market in South America [4].

Middle East & Africa

Country Key Metric Key Driver
Saudi Arabia 24.6% of regional share Vision 2030 fintech agenda
UAE CAGR 20.1% CBUAE enforcement; free-zone compliance
South Africa USD 0.18 Billion (2025) FIC Act amendments
Egypt CAGR 19.4% CBE digital-banking licenses
Rest of MEA 31.5% of regional share Mobile-money operator licensing


FATF mutual evaluations in 2023–2024 placed several Gulf and African states under enhanced monitoring, triggering accelerated investment in transaction surveillance infrastructure. The UAE's Central Bank issued USD 12 Million in AML penalties in 2024 alone, signaling a low-tolerance enforcement posture that drives vendor demand [10].


Transaction Monitoring Market By Region, 2025-2035

Competitive Benchmarking

The Transaction Monitoring Market exhibits medium concentration, with the top five vendors capturing an estimated 35–42% of global revenue. The competitive field spans large enterprise-software conglomerates, specialized compliance-technology pure-plays, and a growing cohort of AI-first startups. Differentiation increasingly hinges on detection accuracy (measured by false-positive-to-SAR ratios), cloud-native architecture maturity, and the ability to deliver unified FRAML capabilities within a single platform.

Company Est. Revenue Share Range Key Offerings Strategic Positioning
NICE Actimize ~8–11% X-Sight platform; AI-driven entity resolution; SAR automation Largest pure-play, deep Tier-1 bank relationships
Oracle Financial Services ~6–9% Financial Crime and Compliance Management; cloud-native analytics Enterprise-suite cross-sell into the existing banking ERP base
SAS Institute ~5–8% SAS Visual Investigator; hybrid AI/rules engine Advanced analytics heritage; strong in the government sector
BAE Systems (NetReveal) ~4–7% NetReveal AML; network analytics; sanctions screening Defense-grade analytics; UK/European regulatory expertise
FIS ~4–6% HORIZON AML; real-time fraud detection Embedded within the FIS core-banking distribution channel
Fiserv ~3–6% Financial Crime Risk Management platform Deep community-bank and credit-union footprint
ACI Worldwide ~3–5% ACI Proactive Risk Manager; real-time payments monitoring Payments-infrastructure adjacency; processor integration
Temenos ~2–4% Temenos Financial Crime Mitigation; SaaS delivery Cloud-first challenger; strong APAC/MEA presence
Napier AI ~1–3% Napier Continuum; intelligent compliance platform AI-native startup; rapid entity-risk scoring
ComplyAdvantage ~1–3% Real-time risk database; adverse-media screening Data-as-a-service model; fintech-centric onboarding


Recent News & Developments

  • NICE Actimize (March 2025): Launched an AI-powered entity-resolution module that reduced false-positive rates by 48% in pilot programs across six global banks, reinforcing its Transaction Monitoring Market leadership [11].
  • EU Anti-Money Laundering Authority (January 2025): AMLA commenced operations from its Frankfurt headquarters with a mandate to directly supervise up to 40 high-risk institutions, reshaping compliance procurement across Europe [1].
  • FIS (June 2024): Expanded its cloud-native HORIZON AML platform to support instant-payment screening for Pix, UPI, and SEPA Instant transactions [Ref 19].
  • FinCEN (March 2024): Finalized updates to beneficial-ownership reporting rules under the Corporate Transparency Act, extending monitoring obligations to approximately 32 million U.S. entities [2].
  • SAS Institute (August 2023): Released a real-time streaming analytics module for its Visual Investigator platform, enabling sub-second alert scoring at volumes exceeding 50,000 transactions per second [Ref 21].
  • ACI Worldwide (February 2025): Announced a strategic partnership with a major global card network to embed transaction-monitoring capabilities directly into issuer-processing workflows [Ref 22].


Transaction Monitoring Market Report Scope

Parameter Detail
Market Scope Global Transaction Monitoring Market — software, services, and managed solutions for AML, fraud detection, compliance management, and sanctions screening
Study Period 2021–2035
CAGR (2026–2035) 17.2%
Market Size — 2025 (Base Year) USD 21.18 Billion
Market Size — 2035 (Forecast End) USD 103.52 Billion
Fastest Growing Segment Fraud Detection & Prevention (22.3% CAGR)
Companies Profiled NICE Actimize, Oracle, SAS Institute, BAE Systems, FIS, Fiserv, ACI Worldwide, Temenos, Napier AI, ComplyAdvantage
Valuation Currency USD Billion


FAQs

How should compliance teams evaluate build-vs-buy decisions for transaction monitoring platforms?

Cloud-native vendor platforms deliver faster rule updates and lower total cost of ownership than custom builds. Most institutions under USD 50 billion in assets achieve positive ROI within 18 months of deployment [Ref 24].

What role do graph databases play in next-generation transaction monitoring?

Graph analytics reveal hidden entity relationships that rule-based engines miss, cutting false negatives by up to 30%. Adoption remains early-stage, concentrated among Tier-1 banks [Ref 23].

How are privacy regulations like GDPR affecting cross-border transaction monitoring deployments?

Data-residency mandates force vendors to deploy regional processing nodes, increasing infrastructure costs. Institutions in multiple jurisdictions often maintain separate rule sets per region [Ref 14].

What distinguishes behavioral analytics engines from traditional rule-based monitoring in the Transaction Monitoring Market?

Behavioral engines baseline each customer's normal activity and flag statistical deviations, reducing false positives by 40–60%. Rule-based systems remain essential for regulatory-mandated scenarios [Ref 23].

How do per-transaction licensing costs scale for mid-sized banks in the Transaction Monitoring Market?

Per-transaction pricing typically ranges from USD 0.003 to USD 0.01, depending on alert complexity. Tiered pricing models help mid-sized banks manage costs as volumes grow [Ref 24].

What integration challenges arise when connecting monitoring platforms to core banking systems?

Legacy core platforms often lack real-time APIs, requiring batch-file workarounds that introduce latency. Event-streaming architectures reduce integration timelines from 12 months to under six [Ref 15].

How are cryptocurrency exchanges adapting their Transaction Monitoring Market frameworks?

Exchanges deploy blockchain-native analytics that trace wallet clusters across decentralized networks. The EU's MiCA regulation is accelerating compliance-tool adoption timelines across digital-asset platforms [Ref 25].    
Author
Author
Author Profile
Ankit Gupta LinkedIn
Team Lead - Research
Ankit Gupta is a seasoned market intelligence and strategic research professional with over six plus years of experience in the ICT and Semiconductor industries. With academic roots in Telecom, Marketing, and Electronics, he blends technical insight with business strategy. Ankit has led 200+ projects, including work for Fortune 500 clients like Microsoft and Rio Tinto, covering market sizing, tech forecasting, and go-to-market strategies. Known for bridging engineering and enterprise decision-making, his insights support growth, innovation, and investment planning across diverse technology markets.
Download Free Sample

Kindly complete the form below to receive a free sample of this Report

Download PDF ×

We do not share your information with anyone. However, we may send you emails based on your report interest from time to time. You may contact us at any time to opt-out.