×
Hero Background
English
Chinese
French
Japanese
Korean
German
Spanish

Upstream Services Market Size

ID: MRFR/EnP/0500-HCR
120 Pages
Priya Nagrale
October 2025

Upstream Services Market Research Report Information by type (Pressure Pumping, Tubular Goods, Waste Management, Coiled Tubing, Completion, Intervention, Well Fluids, Wireline), well type (Onshore, and Offshore), and Region – Forecast till 2035

Share:
Download PDF ×

We do not share your information with anyone. However, we may send you emails based on your report interest from time to time. You may contact us at any time to opt-out.

Upstream Services Market Infographic
Purchase Options

Upstream Services Size

Upstream Services Market Growth Projections and Opportunities

Influenced by global energy landscape, advancements in technology and changing strategies of exploration and production companies, the Upstream Services market is undergoing dynamic changes. Continuous search for new oil and gas reserves to meet the world's energy demands is among the leading forces shaping market dynamics. In order to discover and extract hydrocarbons efficiently, exploration and production (E&P) companies are constantly investing in upstream services. Consequently, as it can be observed from seismic surveys, drilling and reservoir evaluation among other types of upstream services where demand remains very strong due to a rising global population coupled with growing energy needs; this affects market dynamics positively.

The evolving dynamics of the Upstream Services market are deeply influenced by technological advancements. Innovations in exploration and drilling technologies such as 3D seismic imaging, advanced drilling techniques as well as real-time reservoir monitoring have increased efficiency and accuracy of upstream operations. These technological breakthroughs also help reduce exploration risks while improving overall recovery rates from oil and gas reservoirs thus driving adoption of advanced upstream services that shapes the market dynamic.

The fluctuation in oil and gas prices globally significantly influences the market dynamics of Upstream Services. Oil and gas prices directly impact profitability for E&P activities thereby affecting investment decisions by these companies. Similarly, during periods when oil prices soar, significant investments are made towards upstream services owing to their economic viability for extraction purposes whereas during times when oil prices slump there may be reduced levels of activity in exploration or production hence influencing market dynamics within upstream sector.

Moreover, designers focus on environmental sustainability has become an important factor influencing the market dynamics of Upstream Services towards cleaner sources of energy. While conventional oil & gas exploration still plays critical roles; the industry has increasingly become interested with unconventional resources like shale oils & gasses besides renewable energy explorations too. By offering both conventional and emerging energy aligned services in response to these changing needs that shape markets around a wider scope of ecological alternatives while accommodating the market dynamics of a broader energy mix.

The geopolitical landscape and regulatory changes are additional factors shaping the market dynamics of Upstream Services. Political decisions, trade tensions and regulatory frameworks may affect the investment climate for upstream activities. Changes in environmental standards, safety requirements and land access regulations may influence E&P companies’ operational strategies hence impacting on growth within this sector. In addition, geopolitical events such as realignment of global alliances or conflicts in oil-producing regions directly impact on upstream activities and growth of this industry.
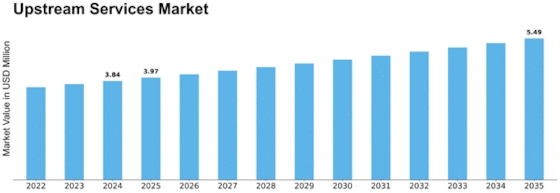
Upstream Services Market Size Graph
Author
Priya Nagrale
Senior Research Analyst

With an experience of over five years in market research industry (Chemicals & Materials domain), I gather and analyze market data from diverse sources to produce results, which are then presented back to a client. Also, provide recommendations based on the findings. As a Senior Research Analyst, I perform quality checks (QC) for market estimations, QC for reports, and handle queries and work extensively on client customizations. Also, handle the responsibilities of client proposals, report planning, report finalization, and execution

Leave a Comment

FAQs

What is the projected market valuation of the Upstream Services Market by 2035?

The Upstream Services Market is projected to reach a valuation of 5.49 USD Million by 2035.

What was the overall market valuation of the Upstream Services Market in 2024?

In 2024, the overall market valuation of the Upstream Services Market was 3.842 USD Million.

What is the expected CAGR for the Upstream Services Market during the forecast period 2025 - 2035?

The expected CAGR for the Upstream Services Market during the forecast period 2025 - 2035 is 3.3%.

Which companies are considered key players in the Upstream Services Market?

Key players in the Upstream Services Market include ExxonMobil, Chevron, Royal Dutch Shell, BP, TotalEnergies, ConocoPhillips, Eni, Equinor, CNOOC, and Petrobras.

What are the projected values for the Rental Equipment segment in 2025?

The projected value for the Rental Equipment segment in 2025 is estimated to be 2.1 USD Million.

How does the Drilling service segment perform in terms of projected valuation?

The Drilling service segment is projected to reach a valuation of 1.6 USD Million by 2035.

What is the expected valuation for the Offshore application segment in 2025?

The expected valuation for the Offshore application segment in 2025 is projected to be 1.99 USD Million.

What are the projected values for Field Operations in the Upstream Services Market?

Field Operations is projected to reach a value of 2.5 USD Million by 2035.

Market Summary

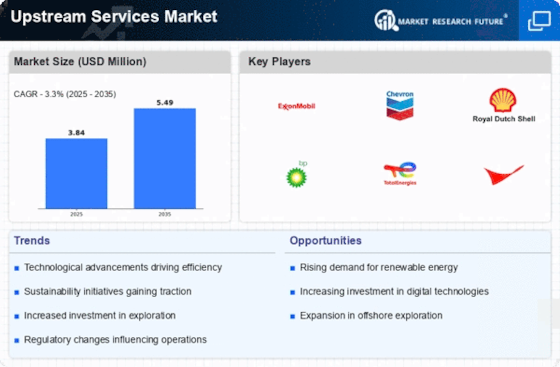
As per MRFR analysis, the Upstream Services Market was estimated at 3.842 USD Million in 2024. The Upstream Services industry is projected to grow from 3.968 USD Million in 2025 to 5.49 USD Million by 2035, exhibiting a compound annual growth rate (CAGR) of 3.3 during the forecast period 2025 - 2035.

Key Market Trends & Highlights

The Upstream Services Market is currently experiencing a transformative shift driven by digitalization and sustainability efforts.

  • Digital transformation is reshaping operational efficiencies across the upstream services sector. Sustainability initiatives are increasingly influencing investment decisions in North America and Asia-Pacific. Collaborative partnerships are emerging as a strategic approach to enhance service delivery in field operations and drilling segments. Technological advancements and rising energy demand are key drivers propelling growth in the market.

Market Size & Forecast

2024 Market Size 3.842 (USD Million)
2035 Market Size 5.49 (USD Million)
CAGR (2025 - 2035) 3.3%
Largest Regional Market Share in 2024 North America

Major Players

<p>ExxonMobil (US), Chevron (US), Royal Dutch Shell (GB), BP (GB), TotalEnergies (FR), ConocoPhillips (US), Eni (IT), Equinor (NO), CNOOC (CN), Petrobras (BR)</p>

Market Trends

The Upstream Services Market is currently experiencing a dynamic transformation driven by various factors, including technological advancements and evolving regulatory frameworks. Companies within this sector are increasingly adopting innovative solutions to enhance operational efficiency and reduce costs. The integration of digital technologies, such as artificial intelligence and data analytics, appears to be reshaping traditional practices, enabling firms to optimize exploration and production processes. Furthermore, the growing emphasis on sustainability and environmental responsibility is influencing investment decisions, as stakeholders seek to align with global climate goals. In addition, the Upstream Services Market is witnessing a shift towards collaborative partnerships and strategic alliances. This trend suggests that organizations are recognizing the value of shared expertise and resources to navigate complex challenges. As the market evolves, it is likely that adaptability and resilience will become essential attributes for success. Overall, the Upstream Services Market is poised for continued growth, driven by innovation, collaboration, and a commitment to sustainable practices.

Digital Transformation

The Upstream Services Market is increasingly embracing digital transformation, which encompasses the adoption of advanced technologies to streamline operations. This trend indicates a shift towards automation and data-driven decision-making, allowing companies to enhance productivity and reduce operational risks.

Sustainability Initiatives

There is a growing focus on sustainability initiatives within the Upstream Services Market. Companies are prioritizing environmentally friendly practices and seeking to minimize their carbon footprint. This trend reflects a broader commitment to corporate social responsibility and compliance with regulatory standards.

Collaborative Partnerships

The formation of collaborative partnerships is becoming more prevalent in the Upstream Services Market. Organizations are recognizing the benefits of working together to share knowledge and resources, which can lead to improved efficiency and innovation in service delivery.

Upstream Services Market Market Drivers

Geopolitical Factors

The Upstream Services Market is heavily influenced by geopolitical factors that can impact supply chains and resource availability. Political instability in oil-rich regions often leads to fluctuations in oil prices, which can affect investment decisions and operational strategies. For instance, tensions in the Middle East have historically resulted in price volatility, prompting companies to reassess their risk exposure. Additionally, trade policies and international relations can also play a crucial role in shaping the dynamics of the Upstream Services Market. Companies that effectively navigate these geopolitical challenges may find opportunities for growth and expansion, particularly in emerging markets.

Rising Energy Demand

The Upstream Services Market is significantly influenced by the rising demand for energy across various sectors. As economies expand and populations grow, the need for oil and gas continues to escalate. Recent projections indicate that global energy consumption could increase by 30% by 2040, necessitating enhanced exploration and production activities. This growing demand compels companies in the Upstream Services Market to invest in new technologies and methodologies to extract resources more efficiently. Furthermore, the shift towards cleaner energy sources may also drive investments in unconventional oil and gas resources, thereby reshaping the landscape of the Upstream Services Market.

Regulatory Frameworks

The Upstream Services Market is shaped by evolving regulatory frameworks that govern exploration and production activities. Governments worldwide are implementing stricter environmental regulations aimed at minimizing the ecological impact of oil and gas operations. Compliance with these regulations often requires companies to adopt more sustainable practices and invest in cleaner technologies. For example, regulations mandating reduced emissions can lead to increased operational costs, but they also present opportunities for innovation in the Upstream Services Market. Companies that proactively adapt to these regulatory changes may gain a competitive advantage, positioning themselves favorably in a market that increasingly values sustainability.

Technological Advancements

The Upstream Services Market is currently experiencing a surge in technological advancements that enhance operational efficiency and reduce costs. Innovations such as artificial intelligence, machine learning, and advanced data analytics are being integrated into exploration and production processes. These technologies enable companies to optimize resource allocation and improve decision-making. For instance, the adoption of predictive maintenance tools can lead to a reduction in downtime, thereby increasing productivity. According to recent data, companies that have embraced these technologies report up to a 20% increase in operational efficiency. This trend is likely to continue as firms seek to leverage technology to gain a competitive edge in the Upstream Services Market.

Investment in Renewable Energy

The Upstream Services Market is witnessing a notable shift as companies diversify their portfolios to include renewable energy investments. This trend is driven by the growing recognition of climate change and the need for sustainable energy solutions. Many traditional oil and gas companies are allocating a portion of their capital expenditures towards renewable projects, such as wind and solar energy. This strategic pivot not only helps mitigate risks associated with fossil fuel dependency but also aligns with the global transition towards cleaner energy sources. As a result, the Upstream Services Market is likely to see increased collaboration between traditional energy firms and renewable energy companies, fostering innovation and growth.

Market Segment Insights

By Type: Field Operations (Largest) vs. Rental Equipment (Fastest-Growing)

<p>In the Upstream Services Market, the segment of Field Operations has emerged as the largest contributor, capturing a significant portion of the market share due to its critical role in various oil and gas extraction processes. It encompasses a wide range of activities, from drilling to well maintenance, and this diversity aids in its dominance. On the other hand, Rental Equipment, while currently smaller in market share, is rapidly gaining traction as the fastest-growing segment. The increasing demand for cost-effective solutions by operators is driving this trend, making it a notable area of interest. The growth trends within these segments highlight various industry dynamics. Field Operations benefits from the continuous need for maintenance of existing oil fields and the rise of new exploration projects, which create consistent demand. In contrast, Rental Equipment sees a surge in demand driven by flexibility requirements among operators who prefer renting over purchasing to optimize costs and reduce overheads. The innovation in equipment technology itself, fostering efficiency and safety, further accelerates growth in the rental sector and indicates a shift in operators' preferences as they look for sustainable methods to maintain competitiveness.</p>

<p>Field Operations (Dominant) vs. Analytical Services (Emerging)</p>

<p>Field Operations remains the dominant segment within the Upstream Services Market, characterized by its established role in the industry. It encompasses a spectrum of operational activities, including drilling, completion, and production, effectively positioning it as a backbone for upstream processes. Its long-standing presence and integration in oil and gas operations afford it a robust market position. In contrast, Analytical Services are emerging as a crucial segment by providing invaluable data insights and analytics that enhance decision-making processes. This segment is characterized by its adaptability and technological integration, responding to the increasing need for data-driven strategies in resource management. As industry operation complexities grow, the demand for Analytical Services is projected to rise, presenting opportunities for innovation and collaboration within the sector.</p>

By Service: Drilling (Largest) vs. Geophysical (Fastest-Growing)

<p>The upstream services market is characterized by several key segments: Geophysical, Drilling, Production, Processing, and Separation. Among these, the Drilling segment stands out as the largest, attributed to the substantial demand for drilling services to explore and extract oil and gas resources. Meanwhile, Geophysical services are gaining momentum, becoming the fastest-growing segment as technological advancements enhance the capabilities of subsurface exploration.</p>

<p>Drilling (Dominant) vs. Geophysical (Emerging)</p>

<p>Drilling services play a dominant role in the upstream services market, supported by a robust framework of rigs, personnel, and technology focused on extracting hydrocarbons efficiently. This segment benefits from ongoing investments in drilling technologies that improve precision and reduce costs. In contrast, Geophysical services, classified as emerging, are rapidly evolving due to advancements in seismic and subsurface imaging technologies, enabling companies to better understand geological formations. As exploration challenges grow, the demand for accurate geophysical data is surging, positioning this segment as critical for future upstream services.</p>

By Application: Onshore (Largest) vs. Offshore (Fastest-Growing)

<p>In the Upstream Services Market, the application segments can be primarily divided into onshore and offshore services. Onshore services hold a significant share, primarily driven by the extensive exploration and production activities taking place on land. This segment caters to a wide range of geological settings and often benefits from lower operational costs compared to offshore alternatives. While onshore services dominate the market distribution, there is a remarkably growing interest in offshore services, propelled by technological advancements and increasing investment in deep-water exploration. The offshore services segment is characterized by its rapid growth, which stems from the rising demand for energy sources that are located in more challenging environments. Recent trends suggest that new technologies are continuously improving extraction methods and reducing risks associated with offshore drilling. This has led to a surge in projects aimed at tapping into previously unreachable oil and gas reserves, marking offshore services as an increasingly vital part of the Upstream Services landscape.</p>

<p>Application: Onshore (Dominant) vs. Offshore (Emerging)</p>

<p>Onshore services are regarded as the dominant segment in the Upstream Services Market, primarily due to their ability to provide efficient and cost-effective solutions for oil and gas extraction on land. This segment excels in its adaptability to various geological environments and often enjoys shorter mobilization times compared to offshore operations. In contrast, offshore services are emerging as a critical segment, driven by innovations in technology that allow for safer and more economical extraction of resources from the sea. Offshore projects often encounter higher risks but offer potentially higher rewards due to access to untapped reserves. The evolving regulatory environment and partnerships between service providers and exploration companies further enhance the attractiveness of offshore services, ensuring they play a key role in the future of upstream operations.</p>

Get more detailed insights about Upstream Services Market Research Report - Forecast to 2035

Regional Insights

North America : Energy Innovation Leader

North America is the largest market for upstream services, holding approximately 45% of the global share. The region benefits from advanced technology, significant investments in exploration, and a favorable regulatory environment. The demand for oil and gas continues to rise, driven by economic recovery and energy transition initiatives. Regulatory support for sustainable practices further catalyzes growth, making it a key player in the global market. The United States leads the North American market, with major companies like ExxonMobil and Chevron driving innovation and competition. Canada also plays a significant role, focusing on sustainable extraction methods. The competitive landscape is characterized by a mix of established players and emerging companies, all striving to enhance operational efficiency and reduce environmental impact. This dynamic environment fosters continuous improvement and technological advancements.

Europe : Sustainable Energy Transition

Europe is the second-largest market for upstream services, accounting for approximately 30% of the global share. The region is experiencing a shift towards sustainable energy practices, driven by stringent regulations and a commitment to reducing carbon emissions. The European Green Deal and other initiatives are pivotal in shaping the market landscape, encouraging investments in cleaner technologies and renewable energy sources. Leading countries in Europe include the United Kingdom, Norway, and France, where companies like BP and TotalEnergies are at the forefront of innovation. The competitive landscape is marked by collaboration between traditional oil and gas firms and renewable energy companies, creating a diverse ecosystem. This synergy is essential for meeting the region's ambitious energy targets and ensuring a sustainable future for upstream services.

Asia-Pacific : Emerging Market Potential

Asia-Pacific is witnessing rapid growth in the upstream services market, holding approximately 20% of the global share. The region's demand is driven by increasing energy consumption, urbanization, and economic development. Countries like China and India are investing heavily in exploration and production, supported by government initiatives aimed at enhancing energy security and reducing dependence on imports. Regulatory frameworks are evolving to attract foreign investments and technology transfer. China is the leading player in the region, with CNOOC and other state-owned enterprises dominating the market. India is also emerging as a significant player, focusing on expanding its oil and gas exploration activities. The competitive landscape is characterized by a mix of national oil companies and international players, fostering collaboration and innovation to meet the growing energy demands of the region.

Middle East and Africa : Resource-Rich Frontier

The Middle East and Africa region is a critical player in the upstream services market, accounting for approximately 5% of the global share. The region is rich in natural resources, particularly oil and gas, which drives demand for upstream services. Political stability and investment in infrastructure are key factors influencing market growth. Additionally, the region is focusing on diversifying its energy portfolio to include renewable sources, aligning with global sustainability trends. Leading countries include Saudi Arabia, the UAE, and Nigeria, where major players like Petrobras and Eni are actively involved in exploration and production. The competitive landscape is shaped by both national oil companies and international firms, creating a dynamic environment for investment and innovation. The region's strategic importance in global energy markets continues to grow, making it a focal point for upstream services.

Key Companies in the Upstream Services Market market include

Industry Developments

In the year 2020, DOF subsea announced contractual agreements with Petrobras that are worth 110 million. Solstad Offshore ASA has obtained many contracts for upstream services in Brazil. Also, Subsea 07 agreed to a contract to manage, engineer, and install offshore activities in Trinidad and Tobago.

Future Outlook

Upstream Services Market Future Outlook

<p>The Upstream Services Market is projected to grow at a 3.3% CAGR from 2024 to 2035, driven by technological advancements, increasing energy demand, and regulatory support.</p>

New opportunities lie in:

  • <p>Investment in digital twin technology for enhanced operational efficiency.</p>
  • <p>Development of sustainable drilling practices to meet environmental regulations.</p>
  • <p>Expansion of remote monitoring services to optimize resource management.</p>

<p>By 2035, the market is expected to achieve robust growth, positioning itself as a leader in upstream service innovations.</p>

Market Segmentation

Upstream Services Market Type Outlook

  • Rental Equipment
  • Field Operations
  • Analytical Services

Upstream Services Market Service Outlook

  • Geophysical
  • Drilling
  • Production
  • Processing
  • Separation

Upstream Services Market Application Outlook

  • Onshore
  • Offshore

Report Scope

MARKET SIZE 2024 3.842(USD Million)
MARKET SIZE 2025 3.968(USD Million)
MARKET SIZE 2035 5.49(USD Million)
COMPOUND ANNUAL GROWTH RATE (CAGR) 3.3% (2024 - 2035)
REPORT COVERAGE Revenue Forecast, Competitive Landscape, Growth Factors, and Trends
BASE YEAR 2024
Market Forecast Period 2025 - 2035
Historical Data 2019 - 2024
Market Forecast Units USD Million
Key Companies Profiled Market analysis in progress
Segments Covered Market segmentation analysis in progress
Key Market Opportunities Integration of advanced digital technologies enhances efficiency in the Upstream Services Market.
Key Market Dynamics Technological advancements and regulatory changes drive innovation and competition in the Upstream Services Market.
Countries Covered North America, Europe, APAC, South America, MEA

FAQs

What is the projected market valuation of the Upstream Services Market by 2035?

The Upstream Services Market is projected to reach a valuation of 5.49 USD Million by 2035.

What was the overall market valuation of the Upstream Services Market in 2024?

In 2024, the overall market valuation of the Upstream Services Market was 3.842 USD Million.

What is the expected CAGR for the Upstream Services Market during the forecast period 2025 - 2035?

The expected CAGR for the Upstream Services Market during the forecast period 2025 - 2035 is 3.3%.

Which companies are considered key players in the Upstream Services Market?

Key players in the Upstream Services Market include ExxonMobil, Chevron, Royal Dutch Shell, BP, TotalEnergies, ConocoPhillips, Eni, Equinor, CNOOC, and Petrobras.

What are the projected values for the Rental Equipment segment in 2025?

The projected value for the Rental Equipment segment in 2025 is estimated to be 2.1 USD Million.

How does the Drilling service segment perform in terms of projected valuation?

The Drilling service segment is projected to reach a valuation of 1.6 USD Million by 2035.

What is the expected valuation for the Offshore application segment in 2025?

The expected valuation for the Offshore application segment in 2025 is projected to be 1.99 USD Million.

What are the projected values for Field Operations in the Upstream Services Market?

Field Operations is projected to reach a value of 2.5 USD Million by 2035.

  1. SECTION I: EXECUTIVE SUMMARY AND KEY HIGHLIGHTS
    1. EXECUTIVE SUMMARY
      1. Market Overview
      2. Key Findings
      3. Market Segmentation
      4. Competitive Landscape
      5. Challenges and Opportunities
      6. Future Outlook 2
  2. SECTION II: SCOPING, METHODOLOGY AND MARKET STRUCTURE
    1. MARKET INTRODUCTION
      1. Definition
      2. Scope of the study
    2. RESEARCH METHODOLOGY
      1. Overview
      2. Data Mining
      3. Secondary Research
      4. Primary Research
      5. Forecasting Model
      6. Market Size Estimation
      7. Data Triangulation
      8. Validation 3
  3. SECTION III: QUALITATIVE ANALYSIS
    1. MARKET DYNAMICS
      1. Overview
      2. Drivers
      3. Restraints
      4. Opportunities
    2. MARKET FACTOR ANALYSIS
      1. Value chain Analysis
      2. Porter's Five Forces Analysis
      3. COVID-19 Impact Analysis
  4. SECTION IV: QUANTITATIVE ANALYSIS
    1. Energy & Power, BY Type (USD Million)
      1. Rental Equipment
      2. Field Operations
      3. Analytical Services
    2. Energy & Power, BY Service (USD Million)
      1. Geophysical
      2. Drilling
      3. Production
      4. Processing
      5. Separation
    3. Energy & Power, BY Application (USD Million)
      1. Onshore
      2. Offshore
    4. Energy & Power, BY Region (USD Million)
      1. North America
      2. Europe
      3. APAC
      4. South America
      5. MEA
  5. SECTION V: COMPETITIVE ANALYSIS
    1. Competitive Landscape
      1. Overview
      2. Competitive Analysis
      3. Market share Analysis
      4. Major Growth Strategy in the Energy & Power
      5. Competitive Benchmarking
      6. Leading Players in Terms of Number of Developments in the Energy & Power
      7. Key developments and growth strategies
      8. Major Players Financial Matrix
    2. Company Profiles
      1. ExxonMobil (US)
      2. Chevron (US)
      3. Royal Dutch Shell (GB)
      4. BP (GB)
      5. TotalEnergies (FR)
      6. ConocoPhillips (US)
      7. Eni (IT)
      8. Equinor (NO)
      9. CNOOC (CN)
      10. Petrobras (BR)
    3. Appendix
      1. References
      2. Related Reports 6 LIST OF FIGURES
    4. MARKET SYNOPSIS
    5. NORTH AMERICA MARKET ANALYSIS
    6. US MARKET ANALYSIS BY TYPE
    7. US MARKET ANALYSIS BY SERVICE
    8. US MARKET ANALYSIS BY APPLICATION
    9. CANADA MARKET ANALYSIS BY TYPE
    10. CANADA MARKET ANALYSIS BY SERVICE
    11. CANADA MARKET ANALYSIS BY APPLICATION
    12. EUROPE MARKET ANALYSIS
    13. GERMANY MARKET ANALYSIS BY TYPE
    14. GERMANY MARKET ANALYSIS BY SERVICE
    15. GERMANY MARKET ANALYSIS BY APPLICATION
    16. UK MARKET ANALYSIS BY TYPE
    17. UK MARKET ANALYSIS BY SERVICE
    18. UK MARKET ANALYSIS BY APPLICATION
    19. FRANCE MARKET ANALYSIS BY TYPE
    20. FRANCE MARKET ANALYSIS BY SERVICE
    21. FRANCE MARKET ANALYSIS BY APPLICATION
    22. RUSSIA MARKET ANALYSIS BY TYPE
    23. RUSSIA MARKET ANALYSIS BY SERVICE
    24. RUSSIA MARKET ANALYSIS BY APPLICATION
    25. ITALY MARKET ANALYSIS BY TYPE
    26. ITALY MARKET ANALYSIS BY SERVICE
    27. ITALY MARKET ANALYSIS BY APPLICATION
    28. SPAIN MARKET ANALYSIS BY TYPE
    29. SPAIN MARKET ANALYSIS BY SERVICE
    30. SPAIN MARKET ANALYSIS BY APPLICATION
    31. REST OF EUROPE MARKET ANALYSIS BY TYPE
    32. REST OF EUROPE MARKET ANALYSIS BY SERVICE
    33. REST OF EUROPE MARKET ANALYSIS BY APPLICATION
    34. APAC MARKET ANALYSIS
    35. CHINA MARKET ANALYSIS BY TYPE
    36. CHINA MARKET ANALYSIS BY SERVICE
    37. CHINA MARKET ANALYSIS BY APPLICATION
    38. INDIA MARKET ANALYSIS BY TYPE
    39. INDIA MARKET ANALYSIS BY SERVICE
    40. INDIA MARKET ANALYSIS BY APPLICATION
    41. JAPAN MARKET ANALYSIS BY TYPE
    42. JAPAN MARKET ANALYSIS BY SERVICE
    43. JAPAN MARKET ANALYSIS BY APPLICATION
    44. SOUTH KOREA MARKET ANALYSIS BY TYPE
    45. SOUTH KOREA MARKET ANALYSIS BY SERVICE
    46. SOUTH KOREA MARKET ANALYSIS BY APPLICATION
    47. MALAYSIA MARKET ANALYSIS BY TYPE
    48. MALAYSIA MARKET ANALYSIS BY SERVICE
    49. MALAYSIA MARKET ANALYSIS BY APPLICATION
    50. THAILAND MARKET ANALYSIS BY TYPE
    51. THAILAND MARKET ANALYSIS BY SERVICE
    52. THAILAND MARKET ANALYSIS BY APPLICATION
    53. INDONESIA MARKET ANALYSIS BY TYPE
    54. INDONESIA MARKET ANALYSIS BY SERVICE
    55. INDONESIA MARKET ANALYSIS BY APPLICATION
    56. REST OF APAC MARKET ANALYSIS BY TYPE
    57. REST OF APAC MARKET ANALYSIS BY SERVICE
    58. REST OF APAC MARKET ANALYSIS BY APPLICATION
    59. SOUTH AMERICA MARKET ANALYSIS
    60. BRAZIL MARKET ANALYSIS BY TYPE
    61. BRAZIL MARKET ANALYSIS BY SERVICE
    62. BRAZIL MARKET ANALYSIS BY APPLICATION
    63. MEXICO MARKET ANALYSIS BY TYPE
    64. MEXICO MARKET ANALYSIS BY SERVICE
    65. MEXICO MARKET ANALYSIS BY APPLICATION
    66. ARGENTINA MARKET ANALYSIS BY TYPE
    67. ARGENTINA MARKET ANALYSIS BY SERVICE
    68. ARGENTINA MARKET ANALYSIS BY APPLICATION
    69. REST OF SOUTH AMERICA MARKET ANALYSIS BY TYPE
    70. REST OF SOUTH AMERICA MARKET ANALYSIS BY SERVICE
    71. REST OF SOUTH AMERICA MARKET ANALYSIS BY APPLICATION
    72. MEA MARKET ANALYSIS
    73. GCC COUNTRIES MARKET ANALYSIS BY TYPE
    74. GCC COUNTRIES MARKET ANALYSIS BY SERVICE
    75. GCC COUNTRIES MARKET ANALYSIS BY APPLICATION
    76. SOUTH AFRICA MARKET ANALYSIS BY TYPE
    77. SOUTH AFRICA MARKET ANALYSIS BY SERVICE
    78. SOUTH AFRICA MARKET ANALYSIS BY APPLICATION
    79. REST OF MEA MARKET ANALYSIS BY TYPE
    80. REST OF MEA MARKET ANALYSIS BY SERVICE
    81. REST OF MEA MARKET ANALYSIS BY APPLICATION
    82. KEY BUYING CRITERIA OF ENERGY & POWER
    83. RESEARCH PROCESS OF MRFR
    84. DRO ANALYSIS OF ENERGY & POWER
    85. DRIVERS IMPACT ANALYSIS: ENERGY & POWER
    86. RESTRAINTS IMPACT ANALYSIS: ENERGY & POWER
    87. SUPPLY / VALUE CHAIN: ENERGY & POWER
    88. ENERGY & POWER, BY TYPE, 2024 (% SHARE)
    89. ENERGY & POWER, BY TYPE, 2024 TO 2035 (USD Million)
    90. ENERGY & POWER, BY SERVICE, 2024 (% SHARE)
    91. ENERGY & POWER, BY SERVICE, 2024 TO 2035 (USD Million)
    92. ENERGY & POWER, BY APPLICATION, 2024 (% SHARE)
    93. ENERGY & POWER, BY APPLICATION, 2024 TO 2035 (USD Million)
    94. BENCHMARKING OF MAJOR COMPETITORS 7 LIST OF TABLES
    95. LIST OF ASSUMPTIONS
    96. North America MARKET SIZE ESTIMATES; FORECAST
      1. BY TYPE, 2025-2035 (USD Million)
      2. BY SERVICE, 2025-2035 (USD Million)
      3. BY APPLICATION, 2025-2035 (USD Million)
    97. US MARKET SIZE ESTIMATES; FORECAST
      1. BY TYPE, 2025-2035 (USD Million)
      2. BY SERVICE, 2025-2035 (USD Million)
      3. BY APPLICATION, 2025-2035 (USD Million)
    98. Canada MARKET SIZE ESTIMATES; FORECAST
      1. BY TYPE, 2025-2035 (USD Million)
      2. BY SERVICE, 2025-2035 (USD Million)
      3. BY APPLICATION, 2025-2035 (USD Million)
    99. Europe MARKET SIZE ESTIMATES; FORECAST
      1. BY TYPE, 2025-2035 (USD Million)
      2. BY SERVICE, 2025-2035 (USD Million)
      3. BY APPLICATION, 2025-2035 (USD Million)
    100. Germany MARKET SIZE ESTIMATES; FORECAST
      1. BY TYPE, 2025-2035 (USD Million)
      2. BY SERVICE, 2025-2035 (USD Million)
      3. BY APPLICATION, 2025-2035 (USD Million)
    101. UK MARKET SIZE ESTIMATES; FORECAST
      1. BY TYPE, 2025-2035 (USD Million)
      2. BY SERVICE, 2025-2035 (USD Million)
      3. BY APPLICATION, 2025-2035 (USD Million)
    102. France MARKET SIZE ESTIMATES; FORECAST
      1. BY TYPE, 2025-2035 (USD Million)
      2. BY SERVICE, 2025-2035 (USD Million)
      3. BY APPLICATION, 2025-2035 (USD Million)
    103. Russia MARKET SIZE ESTIMATES; FORECAST
      1. BY TYPE, 2025-2035 (USD Million)
      2. BY SERVICE, 2025-2035 (USD Million)
      3. BY APPLICATION, 2025-2035 (USD Million)
    104. Italy MARKET SIZE ESTIMATES; FORECAST
      1. BY TYPE, 2025-2035 (USD Million)
      2. BY SERVICE, 2025-2035 (USD Million)
      3. BY APPLICATION, 2025-2035 (USD Million)
    105. Spain MARKET SIZE ESTIMATES; FORECAST
      1. BY TYPE, 2025-2035 (USD Million)
      2. BY SERVICE, 2025-2035 (USD Million)
      3. BY APPLICATION, 2025-2035 (USD Million)
    106. Rest of Europe MARKET SIZE ESTIMATES; FORECAST
      1. BY TYPE, 2025-2035 (USD Million)
      2. BY SERVICE, 2025-2035 (USD Million)
      3. BY APPLICATION, 2025-2035 (USD Million)
    107. APAC MARKET SIZE ESTIMATES; FORECAST
      1. BY TYPE, 2025-2035 (USD Million)
      2. BY SERVICE, 2025-2035 (USD Million)
      3. BY APPLICATION, 2025-2035 (USD Million)
    108. China MARKET SIZE ESTIMATES; FORECAST
      1. BY TYPE, 2025-2035 (USD Million)
      2. BY SERVICE, 2025-2035 (USD Million)
      3. BY APPLICATION, 2025-2035 (USD Million)
    109. India MARKET SIZE ESTIMATES; FORECAST
      1. BY TYPE, 2025-2035 (USD Million)
      2. BY SERVICE, 2025-2035 (USD Million)
      3. BY APPLICATION, 2025-2035 (USD Million)
    110. Japan MARKET SIZE ESTIMATES; FORECAST
      1. BY TYPE, 2025-2035 (USD Million)
      2. BY SERVICE, 2025-2035 (USD Million)
      3. BY APPLICATION, 2025-2035 (USD Million)
    111. South Korea MARKET SIZE ESTIMATES; FORECAST
      1. BY TYPE, 2025-2035 (USD Million)
      2. BY SERVICE, 2025-2035 (USD Million)
      3. BY APPLICATION, 2025-2035 (USD Million)
    112. Malaysia MARKET SIZE ESTIMATES; FORECAST
      1. BY TYPE, 2025-2035 (USD Million)
      2. BY SERVICE, 2025-2035 (USD Million)
      3. BY APPLICATION, 2025-2035 (USD Million)
    113. Thailand MARKET SIZE ESTIMATES; FORECAST
      1. BY TYPE, 2025-2035 (USD Million)
      2. BY SERVICE, 2025-2035 (USD Million)
      3. BY APPLICATION, 2025-2035 (USD Million)
    114. Indonesia MARKET SIZE ESTIMATES; FORECAST
      1. BY TYPE, 2025-2035 (USD Million)
      2. BY SERVICE, 2025-2035 (USD Million)
      3. BY APPLICATION, 2025-2035 (USD Million)
    115. Rest of APAC MARKET SIZE ESTIMATES; FORECAST
      1. BY TYPE, 2025-2035 (USD Million)
      2. BY SERVICE, 2025-2035 (USD Million)
      3. BY APPLICATION, 2025-2035 (USD Million)
    116. South America MARKET SIZE ESTIMATES; FORECAST
      1. BY TYPE, 2025-2035 (USD Million)
      2. BY SERVICE, 2025-2035 (USD Million)
      3. BY APPLICATION, 2025-2035 (USD Million)
    117. Brazil MARKET SIZE ESTIMATES; FORECAST
      1. BY TYPE, 2025-2035 (USD Million)
      2. BY SERVICE, 2025-2035 (USD Million)
      3. BY APPLICATION, 2025-2035 (USD Million)
    118. Mexico MARKET SIZE ESTIMATES; FORECAST
      1. BY TYPE, 2025-2035 (USD Million)
      2. BY SERVICE, 2025-2035 (USD Million)
      3. BY APPLICATION, 2025-2035 (USD Million)
    119. Argentina MARKET SIZE ESTIMATES; FORECAST
      1. BY TYPE, 2025-2035 (USD Million)
      2. BY SERVICE, 2025-2035 (USD Million)
      3. BY APPLICATION, 2025-2035 (USD Million)
    120. Rest of South America MARKET SIZE ESTIMATES; FORECAST
      1. BY TYPE, 2025-2035 (USD Million)
      2. BY SERVICE, 2025-2035 (USD Million)
      3. BY APPLICATION, 2025-2035 (USD Million)
    121. MEA MARKET SIZE ESTIMATES; FORECAST
      1. BY TYPE, 2025-2035 (USD Million)
      2. BY SERVICE, 2025-2035 (USD Million)
      3. BY APPLICATION, 2025-2035 (USD Million)
    122. GCC Countries MARKET SIZE ESTIMATES; FORECAST
      1. BY TYPE, 2025-2035 (USD Million)
      2. BY SERVICE, 2025-2035 (USD Million)
      3. BY APPLICATION, 2025-2035 (USD Million)
    123. South Africa MARKET SIZE ESTIMATES; FORECAST
      1. BY TYPE, 2025-2035 (USD Million)
      2. BY SERVICE, 2025-2035 (USD Million)
      3. BY APPLICATION, 2025-2035 (USD Million)
    124. Rest of MEA MARKET SIZE ESTIMATES; FORECAST
      1. BY TYPE, 2025-2035 (USD Million)
      2. BY SERVICE, 2025-2035 (USD Million)
      3. BY APPLICATION, 2025-2035 (USD Million)
    125. PRODUCT LAUNCH/PRODUCT DEVELOPMENT/APPROVAL
    126. ACQUISITION/PARTNERSHIP

Upstream Services Market Segmentation

Market Segmentation Overview

  • Detailed segmentation data will be available in the full report
  • Comprehensive analysis by multiple parameters
  • Regional and country-level breakdowns
  • Market size forecasts by segment
Infographic

Free Sample Request

Kindly complete the form below to receive a free sample of this Report

Get Free Sample

Customer Strories

“I am very pleased with how market segments have been defined in a relevant way for my purposes (such as "Portable Freezers & refrigerators" and "last-mile"). In general the report is well structured. Thanks very much for your efforts.”

Victoria Milne

Founder

Compare Licence

×
Features License Type
Single User Multiuser License Enterprise User
Price $4,950 $5,950 $7,250
Maximum User Access Limit 1 User Upto 10 Users Unrestricted Access Throughout the Organization
Free Customization
Direct Access to Analyst
Deliverable Format
Platform Access
Discount on Next Purchase 10% 15% 15%
Printable Versions