×
Hero Background
English
Chinese
French
Japanese
Korean
German
Spanish

Utility System Construction Market Size

ID: MRFR/PCM/11008-HCR
128 Pages
Snehal Singh
October 2025

Utility System Construction Market Research Report Information By Product Type (Water and Sewer Line, Related Structures Construction, Oil and Gas Pipeline and Related Structures Construction, Power and Communication Line, and Related Structures Construction), By End User Industry (Private and Public) And By Region (North America, Europe, Asia-Pacific, And Rest Of The World) –Market Forecast Till 2035.

Share:
Download PDF ×

We do not share your information with anyone. However, we may send you emails based on your report interest from time to time. You may contact us at any time to opt-out.

Utility System Construction Market Infographic
Purchase Options

Utility System Construction Size

Utility System Construction Market Growth Projections and Opportunities

The rising global demand for reliable and efficient utility services drives this sector. Water, electricity, and telecommunications systems must be strong as populations rise and urbanize. Demand for utility system construction is rising, offering opportunities for organizations who design and build these vital infrastructure projects. The utility system construction industry is expected to increase from USD 0.75 Billion in 2023 to USD 1.15 Billion in 2032, a CAGR of 5.50%.

Utility system construction is also shaped by government laws and regulations. Government regulations affect project feasibility and profitability, affecting industry investment decisions. Environmental regulations and the push for sustainable practices advance utility system construction methods and technologies. An environmentally sensitive market favors companies that can adapt and comply with these rules.

Technology is another important market component. Innovations in materials, equipment, and construction methods have transformed utility system construction. Companies who adopt and apply these technologies first have a market advantage.

Economic factors like investment trends and finance affect utility system construction. Infrastructure projects require significant investment, which can affect building speed and magnitude. The financial landscape that shapes the sector includes economic stability, interest rates, and government infrastructure expenditure plans.

The utility system building business is worldwide, therefore geopolitics can present difficulties and possibilities. Trade relations, geopolitical tensions, and international cooperation affect industrial resource, material, and expertise migration. Multi-regional companies must handle geopolitical hurdles to be stable and seize possibilities.

Additional influences include market competitiveness and industry consolidation. Companies compete for utility system construction contracts and projects. Firms wanting to strengthen their market position, develop their capabilities, or enter new geographic areas sometimes merge or acquire. In the competitive industry, strategic partnerships and alliances can be crucial.

Finally, climatic change is changing utility system construction. This has changed design and building techniques to emphasize climate resilience and adaptation. Climate-sensitive projects address a global issue and position companies as leaders in sustainable infrastructure development.
Utility System Construction Market Size Graph
Author
Snehal Singh
Assistant Manager - Research

High acumen in analyzing complex macro & micro markets with more than 6 years of work experience in the field of market research. By implementing her analytical skills in forecasting and estimation into market research reports, she has expertise in Packaging, Construction, and Equipment domains. She handles a team size of 20-25 resources and ensures smooth running of the projects, associated marketing activities, and client servicing.

Leave a Comment

FAQs

What is the current valuation of the Utility System Construction Market as of 2024?

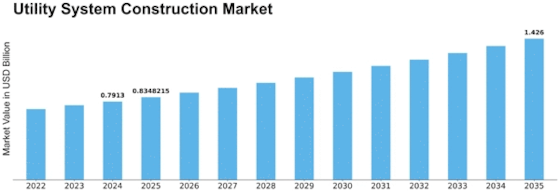
The Utility System Construction Market was valued at 0.7913 USD Billion in 2024.

What is the projected market valuation for the Utility System Construction Market in 2035?

The market is projected to reach a valuation of 1.426 USD Billion by 2035.

What is the expected CAGR for the Utility System Construction Market during the forecast period 2025 - 2035?

The expected CAGR for the Utility System Construction Market during 2025 - 2035 is 5.5%.

Which segments are included in the Utility System Construction Market?

Key segments include Water and Sewer Lines, Related Structures Construction, Oil and Gas Pipelines, and Power and Communication Lines.

What was the valuation of the Water and Sewer Lines segment in 2024?

The Water and Sewer Lines segment was valued at 0.2005 USD Billion in 2024.

How does the valuation of the Oil and Gas Pipelines segment compare between 2024 and projected values for 2035?

The Oil and Gas Pipelines segment was valued at 0.18 USD Billion in 2024 and is projected to grow to 0.33 USD Billion by 2035.

Market Summary

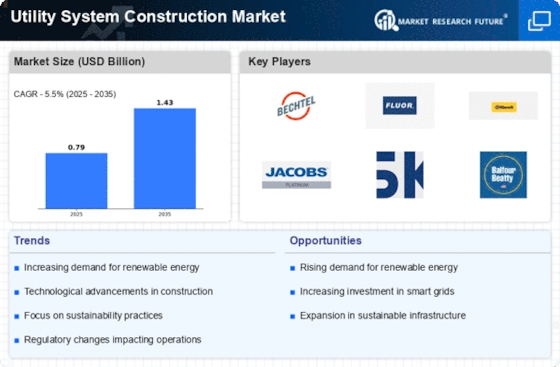
As per MRFR analysis, the Utility System Construction Market Size was estimated at 0.7913 USD Billion in 2024. The Utility System Construction industry is projected to grow from 0.8348 in 2025 to 1.426 by 2035, exhibiting a compound annual growth rate (CAGR) of 5.5 during the forecast period 2025 - 2035.

Key Market Trends & Highlights

The Utility System Construction Market is experiencing a dynamic shift towards sustainability and technological integration.

  • North America remains the largest market for utility system construction, driven by substantial infrastructure investments.
  • The Asia-Pacific region is emerging as the fastest-growing market, fueled by rapid urbanization and population growth.
  • Water and sewer lines dominate the market as the largest segment, while oil and gas pipelines are witnessing the fastest growth.
  • Key market drivers include regulatory compliance and the integration of renewable energy sources, which are shaping future developments.

Market Size & Forecast

2024 Market Size 0.7913 (USD Billion)
2035 Market Size 1.426 (USD Billion)
CAGR (2025 - 2035) 5.5%
Largest Regional Market Share in 2024 North America

Major Players

<p>Bechtel (US), Fluor Corporation (US), Kiewit Corporation (US), Jacobs Engineering Group (US), Skanska (SE), Balfour Beatty (GB), McCarthy Building Companies (US), Tetra Tech (US), Black & Veatch (US)</p>

Market Trends

The Utility System Construction Market is currently experiencing a transformative phase, driven by a confluence of technological advancements and evolving regulatory frameworks. Stakeholders within this sector are increasingly focusing on sustainable practices, which appear to be reshaping project execution and design methodologies. The integration of smart technologies, such as IoT and AI, is enhancing operational efficiency and enabling real-time monitoring of utility systems. This shift not only optimizes resource allocation but also contributes to improved service delivery and customer satisfaction. Furthermore, the emphasis on resilience against climate change impacts is prompting investments in infrastructure that can withstand extreme weather events, thereby ensuring continuity of services. In addition, the Utility System Construction Market is witnessing a growing trend towards public-private partnerships. These collaborations seem to facilitate the pooling of resources and expertise, which may lead to more innovative solutions and faster project completion. As urbanization continues to escalate, the demand for reliable utility services is likely to surge, necessitating a proactive approach to infrastructure development. Overall, the market appears poised for growth, with stakeholders adapting to emerging challenges and opportunities in a rapidly changing environment.

Sustainability Initiatives

The focus on sustainability within the Utility System Construction Market is becoming increasingly pronounced. Companies are adopting eco-friendly practices and materials, which not only reduce environmental impact but also align with regulatory requirements. This trend suggests a shift towards greener infrastructure, potentially enhancing the market's appeal to environmentally conscious consumers.

Technological Integration

The incorporation of advanced technologies is reshaping the Utility System Construction Market. Innovations such as smart grids and automated monitoring systems are streamlining operations and improving efficiency. This trend indicates a move towards more intelligent infrastructure, which may lead to enhanced service reliability and reduced operational costs.

Public-Private Partnerships

The rise of public-private partnerships is significantly influencing the Utility System Construction Market. These collaborations appear to foster innovation and expedite project delivery by combining public oversight with private sector efficiency. This trend suggests a strategic approach to infrastructure development, potentially addressing the growing demand for utility services in urban areas.

Utility System Construction Market Market Drivers

Regulatory Compliance

Regulatory compliance remains a pivotal driver within the Utility System Construction Market. Governments are implementing stringent regulations aimed at ensuring safety, environmental protection, and service quality. Compliance with these regulations often necessitates significant investment in new construction projects and upgrades to existing systems. For example, the introduction of new environmental standards may require utilities to invest in advanced technologies and infrastructure improvements. This regulatory landscape not only compels utility companies to enhance their systems but also creates opportunities for construction firms specializing in utility projects. Consequently, the Utility System Construction Market is likely to expand as companies strive to meet these evolving regulatory requirements.

Infrastructure Investment

The Utility System Construction Market is currently experiencing a surge in infrastructure investment, driven by the need to modernize aging utility systems. Governments and private entities are allocating substantial budgets to enhance water, electricity, and gas distribution networks. For instance, recent reports indicate that utility infrastructure spending is projected to reach approximately 100 billion dollars annually over the next five years. This investment is crucial for improving service reliability and efficiency, thereby fostering economic growth. As urbanization continues to escalate, the demand for robust utility systems becomes increasingly pressing, suggesting that the Utility System Construction Market will likely see sustained growth in response to these infrastructural demands.

Technological Advancements

Technological advancements are reshaping the Utility System Construction Market, enabling more efficient and effective construction practices. Innovations such as Building Information Modeling (BIM), drones, and advanced materials are streamlining project management and execution. These technologies facilitate better planning, reduce costs, and enhance safety on construction sites. Moreover, the adoption of smart technologies in utility systems allows for real-time monitoring and management, improving operational efficiency. As these technologies continue to evolve, they are likely to drive further investment in utility construction projects, thereby propelling growth within the Utility System Construction Market. The potential for increased productivity and reduced project timelines is particularly appealing to stakeholders.

Renewable Energy Integration

The integration of renewable energy sources is transforming the Utility System Construction Market. As nations commit to reducing carbon emissions, there is a growing emphasis on constructing utility systems that can accommodate renewable energy technologies such as solar and wind. This shift necessitates the development of new infrastructure, including smart grids and energy storage systems, to manage the variability of renewable energy sources. Reports suggest that investments in renewable energy infrastructure could exceed 200 billion dollars by 2030, indicating a robust growth trajectory for the Utility System Construction Market. This transition not only supports sustainability goals but also enhances energy security and resilience.

Urbanization and Population Growth

Urbanization and population growth are significant factors influencing the Utility System Construction Market. As more individuals migrate to urban areas, the demand for reliable utility services escalates. This trend necessitates the expansion and modernization of utility infrastructure to accommodate the increasing population density. Recent estimates indicate that urban areas are expected to house nearly 70% of the global population by 2050, which will likely intensify the pressure on utility systems. Consequently, utility construction projects are becoming more critical to ensure that cities can provide essential services such as water, electricity, and gas. This demographic shift presents substantial opportunities for growth within the Utility System Construction Market.

Market Segment Insights

Utility System Construction Market Product Type Insights

Based on product type, the utility system construction market segmentation includes water and sewer lines, related structures construction, oil and gas pipelines, power and communication lines, and related structures construction. The water and sewer line segment dominated the market, accounting for 35% of market revenue (78.48 Billion). The installation of water pipes ensures a continuous and safe supply of clean water for homes, businesses, and public facilities. This is essential for drinking water and sanitation and reducing the risk of waterborne diseases. The construction of sewers allows for the safe disposal of sewage and sewage.

This is essential to protect public health and prevent contamination of water sources and the environment. The construction of sewers allows for the safe disposal of sewage and sewage. This is essential to protect public health and prevent contamination of water sources and the environment.

Utility System Construction Market End User Industry Insights

Based on end-user industry, the utility system construction market segmentation includes Private And Public. The public category generated the most income (70.4%). Utilities provide essential services to homes, businesses, and public facilities, such as clean water, electricity, natural gas, sewage, and waste disposal. These services are essential for daily life, health care, and economic activities. Reliable public services ensure access to safe drinking water and sanitation, reduce the risk of waterborne diseases, and improve the general public's health.

Figure 1: Utility System Construction Market, by End User Industry, 2022 & 2032 (USD Billion)Source: Secondary Research, Primary Research, Market Research Future Database and Analyst Review

Get more detailed insights about Utility System Construction Market Research Report - Global Forecast Till 2035

Regional Insights

North America : Leading Market for Construction

North America is the largest market for utility system construction, holding approximately 45% of the global market share. Key growth drivers include increased investment in renewable energy infrastructure, aging utility systems requiring upgrades, and supportive regulatory frameworks. The demand for sustainable energy solutions is also propelling market growth, with significant federal and state funding initiatives aimed at modernizing utility systems. The United States dominates this region, with major players like Bechtel, Fluor Corporation, and Jacobs Engineering Group leading the competitive landscape. Canada is also emerging as a significant player, focusing on green energy projects. The presence of these key companies ensures a robust competitive environment, fostering innovation and efficiency in utility construction projects.

Europe : Sustainable Development Focus

Europe is witnessing a surge in utility system construction, driven by stringent environmental regulations and a strong commitment to sustainability. The region holds approximately 30% of the global market share, with Germany and the UK being the largest contributors. The European Green Deal and various national initiatives are catalyzing investments in renewable energy and smart grid technologies, enhancing the demand for utility construction services. Germany leads the market, supported by significant investments in energy transition projects. The UK follows closely, with a focus on modernizing aging infrastructure. Key players like Skanska and Balfour Beatty are pivotal in this landscape, driving innovation and efficiency. The competitive environment is characterized by collaborations and partnerships aimed at achieving sustainability goals, positioning Europe as a leader in utility system construction.

Asia-Pacific : Emerging Market Potential

Asia-Pacific is rapidly emerging as a significant market for utility system construction, holding approximately 20% of the global market share. The region's growth is fueled by urbanization, population growth, and increasing energy demands. Countries like China and India are investing heavily in infrastructure development, supported by government initiatives aimed at enhancing energy security and sustainability. Regulatory frameworks are evolving to encourage private sector participation in utility projects. China is the largest market in this region, with substantial investments in renewable energy and smart grid technologies. India is also making strides, focusing on expanding its utility infrastructure. The competitive landscape features key players like Tetra Tech and Black & Veatch, who are actively involved in various projects, ensuring the region's infrastructure meets future demands and sustainability goals.

Middle East and Africa : Resource-Rich Opportunities

The Middle East and Africa region is witnessing a growing demand for utility system construction, driven by urbanization and the need for improved infrastructure. This region holds approximately 5% of the global market share, with countries like Saudi Arabia and South Africa leading the charge. Government initiatives aimed at diversifying economies and enhancing energy security are catalyzing investments in utility projects, particularly in renewable energy and water management systems. Saudi Arabia is investing heavily in utility infrastructure as part of its Vision 2030 initiative, while South Africa focuses on addressing energy shortages. The competitive landscape includes local and international players, with a focus on innovative solutions to meet the region's unique challenges. Companies are increasingly collaborating to leverage resources and expertise, ensuring sustainable development in utility construction.

Key Players and Competitive Insights

Leading market players are investing heavily in research and development in order to expand their product lines, which will help the utility system construction market grow even more. Market participants are also undertaking various strategic activities to expand their footprint, with important market developments including new product launches, contractual agreements, mergers and acquisitions, higher investments, and collaboration with other organizations. To expand and survive in a more competitive and rising market climate, the utility system construction industry must offer cost-effective items.

Manufacturing locally to minimize operational costs is one of the key business tactics manufacturers use in the utility system construction industry to benefit clients and increase the market sector. In recent years, the utility system construction industry has offered some of the most significant advantages to medicine.

Major players in the utility system construction market, including China Energy Engineering Group, Qwest Communications International, Inc, Paraflex, American Tower Corporation, UTILITY CONSTRUCTION COMPANY INC., Charter Oak Utility Constructors, Inc., Mastec, Inc., Keene Systems, Inc., Powerteam Services, Michels Corporation, and others, are attempting to increase market demand by investing in research and development operations.

China Energy Engineering Group Co Ltd (CEEG) is a diversified company that provides complete solutions in energy and infrastructure. It is involved in construction, equipment manufacturing, and utility engineering in China. CECC also provides infrastructure projects, engineering, operational services, investment activities, ands equipment manufacturing. It includes providing services through various businesses. The company also engages in planning and consulting, assessment and evaluation, research and design, construction and contracting, and management integration. We build ports and canals, roads and bridges, railways, airports and housing. The company provides services in all provinces, municipalities, and autonomous regions in China.

CEEG is headquartered in Beijing, China.

Keene Systems, Keene Systems Inc. was founded in 1987. They create custom software development solutions to improve your business operations. With over 30 highly experienced .NET developers, you can use various web technologies. Their specialty is making businesses more efficient by writing custom web applications using ASP.NET. They work with you every step of the custom software development process to improve your business operations. Keene Systems will provide exemplary service and work with you at any level necessary. ASP.NET, .NET Core, and SQL Server developers make your vision a reality.

Key Companies in the Utility System Construction Market market include

Industry Developments

March 2022: Powerteam International partnered with Mentors Studio to host the Ultimate Wealth Camp event, bringing together business owners worldwide. The event will be held at the Powerteam Barrington Retreat Center in Hoffman Estates.

January 2022: According to Smile, a mobile phone operator in Uganda, American Tower Corporation has apologized to its customers for the service disruptions. The company illegally shut down the network and suspended the service for 15 months.

Future Outlook

Utility System Construction Market Future Outlook

<p>The Utility System Construction Market is projected to grow at a 5.5% CAGR from 2024 to 2035, driven by infrastructure investments, technological advancements, and sustainability initiatives.</p>

New opportunities lie in:

  • <p>Integration of smart grid technologies for enhanced efficiency.</p>
  • <p>Development of renewable energy infrastructure projects.</p>
  • <p>Expansion of utility-scale battery storage solutions.</p>

<p>By 2035, the market is expected to be robust, driven by innovation and strategic investments.</p>

Market Segmentation

Utility System Construction Market Product Type Outlook

  • Water and Sewer Lines
  • Related Structures Construction
  • Oil and Gas Pipelines
  • Power and Communication Lines
  • Related Structures Construction

Utility System Construction Market End User Industry Outlook

  • Private
  • Public

Report Scope

MARKET SIZE 20240.7913(USD Billion)
MARKET SIZE 20250.8348(USD Billion)
MARKET SIZE 20351.426(USD Billion)
COMPOUND ANNUAL GROWTH RATE (CAGR)5.5% (2024 - 2035)
REPORT COVERAGERevenue Forecast, Competitive Landscape, Growth Factors, and Trends
BASE YEAR2024
Market Forecast Period2025 - 2035
Historical Data2019 - 2024
Market Forecast UnitsUSD Billion
Key Companies ProfiledMarket analysis in progress
Segments CoveredMarket segmentation analysis in progress
Key Market OpportunitiesIntegration of smart grid technologies enhances efficiency in the Utility System Construction Market.
Key Market DynamicsRising demand for sustainable infrastructure drives innovation and competition in the Utility System Construction Market.
Countries CoveredNorth America, Europe, APAC, South America, MEA

FAQs

What is the current valuation of the Utility System Construction Market as of 2024?

The Utility System Construction Market was valued at 0.7913 USD Billion in 2024.

What is the projected market valuation for the Utility System Construction Market in 2035?

The market is projected to reach a valuation of 1.426 USD Billion by 2035.

What is the expected CAGR for the Utility System Construction Market during the forecast period 2025 - 2035?

The expected CAGR for the Utility System Construction Market during 2025 - 2035 is 5.5%.

Which segments are included in the Utility System Construction Market?

Key segments include Water and Sewer Lines, Related Structures Construction, Oil and Gas Pipelines, and Power and Communication Lines.

What was the valuation of the Water and Sewer Lines segment in 2024?

The Water and Sewer Lines segment was valued at 0.2005 USD Billion in 2024.

How does the valuation of the Oil and Gas Pipelines segment compare between 2024 and projected values for 2035?

The Oil and Gas Pipelines segment was valued at 0.18 USD Billion in 2024 and is projected to grow to 0.33 USD Billion by 2035.

  1. SECTION I: EXECUTIVE SUMMARY AND KEY HIGHLIGHTS
    1. EXECUTIVE SUMMARY
      1. Market Overview
      2. Key Findings
      3. Market Segmentation
      4. Competitive Landscape
      5. Challenges and Opportunities
      6. Future Outlook
  2. SECTION II: SCOPING, METHODOLOGY AND MARKET STRUCTURE
    1. MARKET INTRODUCTION
      1. Definition
      2. Scope of the study
    2. RESEARCH METHODOLOGY
      1. Overview
      2. Data Mining
      3. Secondary Research
      4. Primary Research
      5. Forecasting Model
      6. Market Size Estimation
      7. Data Triangulation
      8. Validation
  3. SECTION III: QUALITATIVE ANALYSIS
    1. MARKET DYNAMICS
      1. Overview
      2. Drivers
      3. Restraints
      4. Opportunities
    2. MARKET FACTOR ANALYSIS
      1. Value chain Analysis
      2. Porter's Five Forces Analysis
      3. COVID-19 Impact Analysis
  4. SECTION IV: QUANTITATIVE ANALYSIS
    1. Packaging & Transport, BY Product Type (USD Billion)
      1. Water and Sewer Lines
      2. Related Structures Construction
      3. Oil and Gas Pipelines
      4. Power and Communication Lines
      5. Related Structures Construction
    2. Packaging & Transport, BY End User Industry (USD Billion)
      1. Private
      2. Public
    3. Packaging & Transport, BY Region (USD Billion)
      1. North America
      2. Europe
      3. APAC
      4. South America
      5. MEA
  5. SECTION V: COMPETITIVE ANALYSIS
    1. Competitive Landscape
      1. Overview
      2. Competitive Analysis
      3. Market share Analysis
      4. Major Growth Strategy in the Packaging & Transport
      5. Competitive Benchmarking
      6. Leading Players in Terms of Number of Developments in the Packaging & Transport
      7. Key developments and growth strategies
      8. Major Players Financial Matrix
    2. Company Profiles
      1. Bechtel (US)
      2. Fluor Corporation (US)
      3. Kiewit Corporation (US)
      4. Jacobs Engineering Group (US)
      5. Skanska (SE)
      6. Balfour Beatty (GB)
      7. McCarthy Building Companies (US)
      8. Tetra Tech (US)
      9. Black & Veatch (US)
    3. Appendix
      1. References
      2. Related Reports
  6. LIST OF FIGURES
    1. MARKET SYNOPSIS
    2. NORTH AMERICA MARKET ANALYSIS
    3. US MARKET ANALYSIS BY PRODUCT TYPE
    4. US MARKET ANALYSIS BY END USER INDUSTRY
    5. CANADA MARKET ANALYSIS BY PRODUCT TYPE
    6. CANADA MARKET ANALYSIS BY END USER INDUSTRY
    7. EUROPE MARKET ANALYSIS
    8. GERMANY MARKET ANALYSIS BY PRODUCT TYPE
    9. GERMANY MARKET ANALYSIS BY END USER INDUSTRY
    10. UK MARKET ANALYSIS BY PRODUCT TYPE
    11. UK MARKET ANALYSIS BY END USER INDUSTRY
    12. FRANCE MARKET ANALYSIS BY PRODUCT TYPE
    13. FRANCE MARKET ANALYSIS BY END USER INDUSTRY
    14. RUSSIA MARKET ANALYSIS BY PRODUCT TYPE
    15. RUSSIA MARKET ANALYSIS BY END USER INDUSTRY
    16. ITALY MARKET ANALYSIS BY PRODUCT TYPE
    17. ITALY MARKET ANALYSIS BY END USER INDUSTRY
    18. SPAIN MARKET ANALYSIS BY PRODUCT TYPE
    19. SPAIN MARKET ANALYSIS BY END USER INDUSTRY
    20. REST OF EUROPE MARKET ANALYSIS BY PRODUCT TYPE
    21. REST OF EUROPE MARKET ANALYSIS BY END USER INDUSTRY
    22. APAC MARKET ANALYSIS
    23. CHINA MARKET ANALYSIS BY PRODUCT TYPE
    24. CHINA MARKET ANALYSIS BY END USER INDUSTRY
    25. INDIA MARKET ANALYSIS BY PRODUCT TYPE
    26. INDIA MARKET ANALYSIS BY END USER INDUSTRY
    27. JAPAN MARKET ANALYSIS BY PRODUCT TYPE
    28. JAPAN MARKET ANALYSIS BY END USER INDUSTRY
    29. SOUTH KOREA MARKET ANALYSIS BY PRODUCT TYPE
    30. SOUTH KOREA MARKET ANALYSIS BY END USER INDUSTRY
    31. MALAYSIA MARKET ANALYSIS BY PRODUCT TYPE
    32. MALAYSIA MARKET ANALYSIS BY END USER INDUSTRY
    33. THAILAND MARKET ANALYSIS BY PRODUCT TYPE
    34. THAILAND MARKET ANALYSIS BY END USER INDUSTRY
    35. INDONESIA MARKET ANALYSIS BY PRODUCT TYPE
    36. INDONESIA MARKET ANALYSIS BY END USER INDUSTRY
    37. REST OF APAC MARKET ANALYSIS BY PRODUCT TYPE
    38. REST OF APAC MARKET ANALYSIS BY END USER INDUSTRY
    39. SOUTH AMERICA MARKET ANALYSIS
    40. BRAZIL MARKET ANALYSIS BY PRODUCT TYPE
    41. BRAZIL MARKET ANALYSIS BY END USER INDUSTRY
    42. MEXICO MARKET ANALYSIS BY PRODUCT TYPE
    43. MEXICO MARKET ANALYSIS BY END USER INDUSTRY
    44. ARGENTINA MARKET ANALYSIS BY PRODUCT TYPE
    45. ARGENTINA MARKET ANALYSIS BY END USER INDUSTRY
    46. REST OF SOUTH AMERICA MARKET ANALYSIS BY PRODUCT TYPE
    47. REST OF SOUTH AMERICA MARKET ANALYSIS BY END USER INDUSTRY
    48. MEA MARKET ANALYSIS
    49. GCC COUNTRIES MARKET ANALYSIS BY PRODUCT TYPE
    50. GCC COUNTRIES MARKET ANALYSIS BY END USER INDUSTRY
    51. SOUTH AFRICA MARKET ANALYSIS BY PRODUCT TYPE
    52. SOUTH AFRICA MARKET ANALYSIS BY END USER INDUSTRY
    53. REST OF MEA MARKET ANALYSIS BY PRODUCT TYPE
    54. REST OF MEA MARKET ANALYSIS BY END USER INDUSTRY
    55. KEY BUYING CRITERIA OF PACKAGING & TRANSPORT
    56. RESEARCH PROCESS OF MRFR
    57. DRO ANALYSIS OF PACKAGING & TRANSPORT
    58. DRIVERS IMPACT ANALYSIS: PACKAGING & TRANSPORT
    59. RESTRAINTS IMPACT ANALYSIS: PACKAGING & TRANSPORT
    60. SUPPLY / VALUE CHAIN: PACKAGING & TRANSPORT
    61. PACKAGING & TRANSPORT, BY PRODUCT TYPE, 2024 (% SHARE)
    62. PACKAGING & TRANSPORT, BY PRODUCT TYPE, 2024 TO 2035 (USD Billion)
    63. PACKAGING & TRANSPORT, BY END USER INDUSTRY, 2024 (% SHARE)
    64. PACKAGING & TRANSPORT, BY END USER INDUSTRY, 2024 TO 2035 (USD Billion)
    65. BENCHMARKING OF MAJOR COMPETITORS
  7. LIST OF TABLES
    1. LIST OF ASSUMPTIONS
    2. North America MARKET SIZE ESTIMATES; FORECAST
      1. BY PRODUCT TYPE, 2025-2035 (USD Billion)
      2. BY END USER INDUSTRY, 2025-2035 (USD Billion)
    3. US MARKET SIZE ESTIMATES; FORECAST
      1. BY PRODUCT TYPE, 2025-2035 (USD Billion)
      2. BY END USER INDUSTRY, 2025-2035 (USD Billion)
    4. Canada MARKET SIZE ESTIMATES; FORECAST
      1. BY PRODUCT TYPE, 2025-2035 (USD Billion)
      2. BY END USER INDUSTRY, 2025-2035 (USD Billion)
    5. Europe MARKET SIZE ESTIMATES; FORECAST
      1. BY PRODUCT TYPE, 2025-2035 (USD Billion)
      2. BY END USER INDUSTRY, 2025-2035 (USD Billion)
    6. Germany MARKET SIZE ESTIMATES; FORECAST
      1. BY PRODUCT TYPE, 2025-2035 (USD Billion)
      2. BY END USER INDUSTRY, 2025-2035 (USD Billion)
    7. UK MARKET SIZE ESTIMATES; FORECAST
      1. BY PRODUCT TYPE, 2025-2035 (USD Billion)
      2. BY END USER INDUSTRY, 2025-2035 (USD Billion)
    8. France MARKET SIZE ESTIMATES; FORECAST
      1. BY PRODUCT TYPE, 2025-2035 (USD Billion)
      2. BY END USER INDUSTRY, 2025-2035 (USD Billion)
    9. Russia MARKET SIZE ESTIMATES; FORECAST
      1. BY PRODUCT TYPE, 2025-2035 (USD Billion)
      2. BY END USER INDUSTRY, 2025-2035 (USD Billion)
    10. Italy MARKET SIZE ESTIMATES; FORECAST
      1. BY PRODUCT TYPE, 2025-2035 (USD Billion)
      2. BY END USER INDUSTRY, 2025-2035 (USD Billion)
    11. Spain MARKET SIZE ESTIMATES; FORECAST
      1. BY PRODUCT TYPE, 2025-2035 (USD Billion)
      2. BY END USER INDUSTRY, 2025-2035 (USD Billion)
    12. Rest of Europe MARKET SIZE ESTIMATES; FORECAST
      1. BY PRODUCT TYPE, 2025-2035 (USD Billion)
      2. BY END USER INDUSTRY, 2025-2035 (USD Billion)
    13. APAC MARKET SIZE ESTIMATES; FORECAST
      1. BY PRODUCT TYPE, 2025-2035 (USD Billion)
      2. BY END USER INDUSTRY, 2025-2035 (USD Billion)
    14. China MARKET SIZE ESTIMATES; FORECAST
      1. BY PRODUCT TYPE, 2025-2035 (USD Billion)
      2. BY END USER INDUSTRY, 2025-2035 (USD Billion)
    15. India MARKET SIZE ESTIMATES; FORECAST
      1. BY PRODUCT TYPE, 2025-2035 (USD Billion)
      2. BY END USER INDUSTRY, 2025-2035 (USD Billion)
    16. Japan MARKET SIZE ESTIMATES; FORECAST
      1. BY PRODUCT TYPE, 2025-2035 (USD Billion)
      2. BY END USER INDUSTRY, 2025-2035 (USD Billion)
    17. South Korea MARKET SIZE ESTIMATES; FORECAST
      1. BY PRODUCT TYPE, 2025-2035 (USD Billion)
      2. BY END USER INDUSTRY, 2025-2035 (USD Billion)
    18. Malaysia MARKET SIZE ESTIMATES; FORECAST
      1. BY PRODUCT TYPE, 2025-2035 (USD Billion)
      2. BY END USER INDUSTRY, 2025-2035 (USD Billion)
    19. Thailand MARKET SIZE ESTIMATES; FORECAST
      1. BY PRODUCT TYPE, 2025-2035 (USD Billion)
      2. BY END USER INDUSTRY, 2025-2035 (USD Billion)
    20. Indonesia MARKET SIZE ESTIMATES; FORECAST
      1. BY PRODUCT TYPE, 2025-2035 (USD Billion)
      2. BY END USER INDUSTRY, 2025-2035 (USD Billion)
    21. Rest of APAC MARKET SIZE ESTIMATES; FORECAST
      1. BY PRODUCT TYPE, 2025-2035 (USD Billion)
      2. BY END USER INDUSTRY, 2025-2035 (USD Billion)
    22. South America MARKET SIZE ESTIMATES; FORECAST
      1. BY PRODUCT TYPE, 2025-2035 (USD Billion)
      2. BY END USER INDUSTRY, 2025-2035 (USD Billion)
    23. Brazil MARKET SIZE ESTIMATES; FORECAST
      1. BY PRODUCT TYPE, 2025-2035 (USD Billion)
      2. BY END USER INDUSTRY, 2025-2035 (USD Billion)
    24. Mexico MARKET SIZE ESTIMATES; FORECAST
      1. BY PRODUCT TYPE, 2025-2035 (USD Billion)
      2. BY END USER INDUSTRY, 2025-2035 (USD Billion)
    25. Argentina MARKET SIZE ESTIMATES; FORECAST
      1. BY PRODUCT TYPE, 2025-2035 (USD Billion)
      2. BY END USER INDUSTRY, 2025-2035 (USD Billion)
    26. Rest of South America MARKET SIZE ESTIMATES; FORECAST
      1. BY PRODUCT TYPE, 2025-2035 (USD Billion)
      2. BY END USER INDUSTRY, 2025-2035 (USD Billion)
    27. MEA MARKET SIZE ESTIMATES; FORECAST
      1. BY PRODUCT TYPE, 2025-2035 (USD Billion)
      2. BY END USER INDUSTRY, 2025-2035 (USD Billion)
    28. GCC Countries MARKET SIZE ESTIMATES; FORECAST
      1. BY PRODUCT TYPE, 2025-2035 (USD Billion)
      2. BY END USER INDUSTRY, 2025-2035 (USD Billion)
    29. South Africa MARKET SIZE ESTIMATES; FORECAST
      1. BY PRODUCT TYPE, 2025-2035 (USD Billion)
      2. BY END USER INDUSTRY, 2025-2035 (USD Billion)
    30. Rest of MEA MARKET SIZE ESTIMATES; FORECAST
      1. BY PRODUCT TYPE, 2025-2035 (USD Billion)
      2. BY END USER INDUSTRY, 2025-2035 (USD Billion)
    31. PRODUCT LAUNCH/PRODUCT DEVELOPMENT/APPROVAL
    32. ACQUISITION/PARTNERSHIP


Utility system construction Market Segmentation

Utility system construction Product Type Outlook (USD Billion, 2018-2032)

  • Water and Sewer Line
  • Related Structures Construction
  • Oil and Gas Pipeline and Related Structures Construction
  • Power and Communication Line
  • Related Structures Construction

Utility system construction End User industry Outlook (USD Billion, 2018-2032)

  • Private
  • Public

Utility system construction Regional Outlook (USD Billion, 2018-2032)

  • North America Outlook (USD Billion, 2018-2032)

    • North America Utility system construction by Product Type
      • Water and Sewer Line
      • Related Structures Construction
      • Oil and Gas Pipeline and Related Structures Construction
      • Power and Communication Line
      • Related Structures Construction
    • North America Utility system construction by End User industry
      • Private
      • Public
    • US Outlook (USD Billion, 2018-2032)

    • US Utility system construction by Product Type
      • Water and Sewer Line
      • Related Structures Construction
      • Oil and Gas Pipeline and Related Structures Construction
      • Power and Communication Line
      • Related Structures Construction
    • US Utility system construction by End User industry
      • Private
      • Public
    • CANADA Outlook (USD Billion, 2018-2032)

    • CANADA Utility system construction by Product Type
      • Water and Sewer Line
      • Related Structures Construction
      • Oil and Gas Pipeline and Related Structures Construction
      • Power and Communication Line
      • Related Structures Construction
    • CANADA Utility system construction by End User industry
      • Private
      • Public
  • Europe Outlook (USD Billion, 2018-2032)

    • Europe Utility system construction by Product Type
      • Water and Sewer Line
      • Related Structures Construction
      • Oil and Gas Pipeline and Related Structures Construction
      • Power and Communication Line
      • Related Structures Construction
    • Europe Utility system construction by End User industry
      • Private
      • Public
    • Germany Outlook (USD Billion, 2018-2032)

    • Germany Utility system construction by Product Type
      • Water and Sewer Line
      • Related Structures Construction
      • Oil and Gas Pipeline and Related Structures Construction
      • Power and Communication Line
      • Related Structures Construction
    • Germany Utility system construction by End User industry
      • Private
      • Public
    • France Outlook (USD Billion, 2018-2032)

    • France Utility system construction by Product Type
      • Water and Sewer Line
      • Related Structures Construction
      • Oil and Gas Pipeline and Related Structures Construction
      • Power and Communication Line
      • Related Structures Construction
    • France Utility system construction by End User industry
      • Private
      • Public
    • UK Outlook (USD Billion, 2018-2032)

    • UK Utility system construction by Product Type
      • Water and Sewer Line
      • Related Structures Construction
      • Oil and Gas Pipeline and Related Structures Construction
      • Power and Communication Line
      • Related Structures Construction
    • UK Utility system construction by End User industry
      • Private
      • Public
    • ITALY Outlook (USD Billion, 2018-2032)

    • ITALY Utility system construction by Product Type
      • Water and Sewer Line
      • Related Structures Construction
      • Oil and Gas Pipeline and Related Structures Construction
      • Power and Communication Line
      • Related Structures Construction
    • ITALY Utility system construction by End User industry
      • Private
      • Public
    • SPAIN Outlook (USD Billion, 2018-2032)

    • Spain Utility system construction by Product Type
      • Water and Sewer Line
      • Related Structures Construction
      • Oil and Gas Pipeline and Related Structures Construction
      • Power and Communication Line
      • Related Structures Construction
    • Spain Utility system construction by End User industry
      • Private
      • Public
    • Rest Of Europe Outlook (USD Billion, 2018-2032)

    • Rest Of Europe Utility system construction by Product Type
      • Water and Sewer Line
      • Related Structures Construction
      • Oil and Gas Pipeline and Related Structures Construction
      • Power and Communication Line
      • Related Structures Construction
    • REST OF EUROPE Utility system construction by End User industry
      • Private
      • Public
  • Asia-Pacific Outlook (USD Billion, 2018-2032)

    • Asia-Pacific Utility system construction by Product Type
      • Water and Sewer Line
      • Related Structures Construction
      • Oil and Gas Pipeline and Related Structures Construction
      • Power and Communication Line
      • Related Structures Construction
    • Asia-Pacific Utility system construction by End User industry
      • Private
      • Public
    • China Outlook (USD Billion, 2018-2032)

    • China Utility system construction by Product Type
      • Water and Sewer Line
      • Related Structures Construction
      • Oil and Gas Pipeline and Related Structures Construction
      • Power and Communication Line
      • Related Structures Construction
    • China Utility system construction by End User industry
      • Private
      • Public
    • Japan Outlook (USD Billion, 2018-2032)

    • Japan Utility system construction by Product Type
      • Water and Sewer Line
      • Related Structures Construction
      • Oil and Gas Pipeline and Related Structures Construction
      • Power and Communication Line
      • Related Structures Construction
    • Japan Utility system construction by End User industry
      • Private
      • Public
    • India Outlook (USD Billion, 2018-2032)

    • India Utility system construction by Product Type
      • Water and Sewer Line
      • Related Structures Construction
      • Oil and Gas Pipeline and Related Structures Construction
      • Power and Communication Line
      • Related Structures Construction
    • India Utility system construction by End User industry
      • Private
      • Public
    • Australia Outlook (USD Billion, 2018-2032)

    • Australia Utility system construction by Product Type
      • Water and Sewer Line
      • Related Structures Construction
      • Oil and Gas Pipeline and Related Structures Construction
      • Power and Communication Line
      • Related Structures Construction
    • Australia Utility system construction by End User industry
      • Private
      • Public
    • Rest of Asia-Pacific Outlook (USD Billion, 2018-2032)

    • Rest of Asia-Pacific Utility system construction by Product Type
      • Water and Sewer Line
      • Related Structures Construction
      • Oil and Gas Pipeline and Related Structures Construction
      • Power and Communication Line
      • Related Structures Construction
    • Rest of Asia-Pacific Utility system construction by End User industry
      • Private
      • Public
  • Rest of the World Outlook (USD Billion, 2018-2032)

    • Rest of the World Utility system construction by Product Type
      • Water and Sewer Line
      • Related Structures Construction
      • Oil and Gas Pipeline and Related Structures Construction
      • Power and Communication Line
      • Related Structures Construction
    • Rest of the World Utility system construction by End User industry
      • Private
      • Public
    • Middle East Outlook (USD Billion, 2018-2032)

    • Middle East Utility system construction by Product Type
      • Water and Sewer Line
      • Related Structures Construction
      • Oil and Gas Pipeline and Related Structures Construction
      • Power and Communication Line
      • Related Structures Construction
    • Middle East Utility system construction by End User industry
      • Private
      • Public
    • Africa Outlook (USD Billion, 2018-2032)

    • Africa Utility system construction by Product Type
      • Water and Sewer Line
      • Related Structures Construction
      • Oil and Gas Pipeline and Related Structures Construction
      • Power and Communication Line
      • Related Structures Construction
    • Africa Utility system construction by End User industry
      • Private
      • Public
    • Latin America Outlook (USD Billion, 2018-2032)

    • Latin America Utility system construction by Product Type
      • Water and Sewer Line
      • Related Structures Construction
      • Oil and Gas Pipeline and Related Structures Construction
      • Power and Communication Line
      • Related Structures Construction
    • Latin America Utility system construction by End User industry
      • Private
      • Public
Infographic

Free Sample Request

Kindly complete the form below to receive a free sample of this Report

Get Free Sample

Customer Strories

“I am very pleased with how market segments have been defined in a relevant way for my purposes (such as "Portable Freezers & refrigerators" and "last-mile"). In general the report is well structured. Thanks very much for your efforts.”

Victoria Milne

Founder

Compare Licence

×
Features License Type
Single User Multiuser License Enterprise User
Price $4,950 $5,950 $7,250
Maximum User Access Limit 1 User Upto 10 Users Unrestricted Access Throughout the Organization
Free Customization
Direct Access to Analyst
Deliverable Format
Platform Access
Discount on Next Purchase 10% 15% 15%
Printable Versions