×
  • Cat-intel
  • MedIntelliX
  • Resources
  • About Us
  • Hero Background
    English
    Chinese
    French
    Japanese
    Korean
    German
    Spanish

    UV Air Purifiers Market Trends

    ID: MRFR/SEM/10410-HCR
    128 Pages
    Ankit Gupta
    October 2025

    UV Air Purifiers Market Research Report Information By Mounting Type (Fixed and Portable), By Power (Less than 70, 70 – 100, 100 – 140, and More than 140), By Air Flow (Less than 0.7 m3/sec, 0.7-1.4 m3/sec, 1.4-2.0 m3/sec, and More than 2.0 m3/sec), By End Use (Residential, Commercial, and Industrial), and By Region (North America, Europe, Asia-Pacific, and Rest Of The World) – Industry Size, S...

    Share:
    Download PDF ×

    We do not share your information with anyone. However, we may send you emails based on your report interest from time to time. You may contact us at any time to opt-out.

    UV Air Purifiers Market Infographic
    Purchase Options

    Market Trends

    Key Emerging Trends in the UV Air Purifiers Market

    The UV air purifiers market is experiencing several noteworthy trends that reflect the evolving preferences and demands of consumers. One prominent trend is the increasing emphasis on health and wellness. As individuals become more health-conscious, there is a growing demand for products that contribute to a healthier living environment. UV air purifiers, with their ability to neutralize airborne pathogens, allergens, and pollutants, align with this trend by providing a proactive solution for maintaining clean indoor air.

    The ongoing COVID-19 pandemic has accelerated a trend towards heightened awareness of indoor air quality. With the virus's ability to spread through airborne particles, consumers are increasingly turning to UV air purifiers as a preventive measure. This trend is expected to persist, with a continued focus on creating safer indoor spaces and reducing the risk of respiratory infections. UV air purifiers are positioned as a valuable tool in this ongoing battle against airborne pathogens.

    Environmental sustainability is emerging as a key trend in the UV air purifiers market. Consumers are expressing a growing interest in eco-friendly products that have minimal environmental impact. Manufacturers are responding by incorporating sustainable materials, energy-efficient technologies, and environmentally conscious production processes into their UV air purifiers. This trend reflects a broader global shift towards responsible consumption and environmental stewardship.

    Smart technology integration is becoming increasingly prevalent in UV air purifiers. The market is witnessing a surge in products that feature smart sensors, connectivity, and automation. These advancements allow users to monitor and control their air purifiers remotely, adjust settings based on real-time air quality data, and receive alerts. The integration of smart technologies not only enhances user convenience but also aligns with the broader trend of interconnected smart home ecosystems.

    Another significant trend is the continuous innovation in UV-C light sources and purification technologies. Manufacturers are investing in research and development to improve the efficiency and effectiveness of UV air purifiers. This includes advancements in UV-C LED technology, which is not only more energy-efficient but also provides a safer alternative to traditional mercury-based UV-C lamps. These innovations contribute to the market's dynamic landscape, offering consumers more reliable and high-performance options.

    Customization and personalization are emerging as trends in the UV air purifiers market. Manufacturers are recognizing the diverse needs of consumers and are introducing products with customizable features. This includes adjustable purification settings, various fan speeds, and the ability to target specific pollutants. The trend towards customization allows users to tailor their air purifiers to suit individual preferences and address specific air quality concerns.

    Increasing market competition is fostering a trend of affordability and accessibility. As more players enter the UV air purifiers market, companies are striving to offer cost-effective solutions to reach a broader consumer base. This trend is making air purifiers more accessible to a wider audience, driving market growth and adoption.

    Aesthetic considerations are also influencing market trends, with manufacturers focusing on design and visual appeal. UV air purifiers are no longer solely functional devices but are also being designed to complement modern interiors. Sleek and stylish designs are becoming more prevalent, catering to consumers who prioritize both performance and aesthetics in their home appliances.

    Author
    Ankit Gupta
    Senior Research Analyst

    Ankit Gupta is an analyst in market research industry in ICT and SEMI industry. With post-graduation in "Telecom and Marketing Management" and graduation in "Electronics and Telecommunication" vertical he is well versed with recent development in ICT industry as a whole. Having worked on more than 150+ reports including consultation for fortune 500 companies such as Microsoft and Rio Tinto in identifying solutions with respect to business problems his opinions are inclined towards mixture of technical and managerial aspects.

    Leave a Comment

    FAQs

    What is the current market valuation of the UV Air Purifiers Market?

    The UV Air Purifiers Market was valued at 1.912 USD Billion in 2024.

    What is the projected market size for UV Air Purifiers by 2035?

    The market is projected to reach 10.56 USD Billion by 2035.

    What is the expected CAGR for the UV Air Purifiers Market from 2025 to 2035?

    The expected CAGR for the market during the forecast period 2025 - 2035 is 16.8%.

    Which companies are leading the UV Air Purifiers Market?

    Key players in the market include Honeywell, Philips, Sharp, LG Electronics, Samsung, Blueair, Dyson, Molekule, and Air Oasis.

    How does the market segment by mounting type perform?

    In 2024, the fixed segment was valued at 0.912 USD Billion, while the portable segment reached 1.0 USD Billion.

    What are the power segment valuations for UV Air Purifiers?

    The power segment showed valuations of 0.573 USD Billion for less than 70, and 0.501 USD Billion for more than 140.

    Market Summary

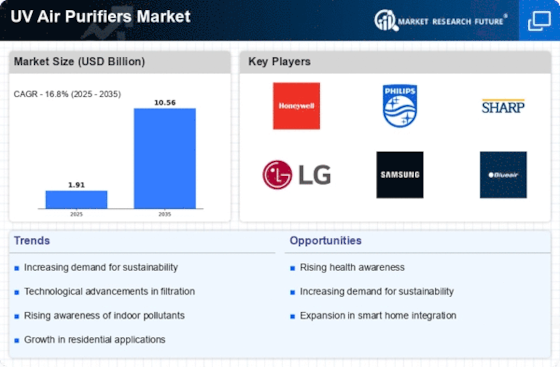
    As per MRFR analysis, the UV Air Purifiers Market Size was estimated at 1.912 USD Billion in 2024. The UV Air Purifiers industry is projected to grow from 2.233 USD Billion in 2025 to 10.56 USD Billion by 2035, exhibiting a compound annual growth rate (CAGR) of 16.8 during the forecast period 2025 - 2035.

    Key Market Trends & Highlights

    The UV Air Purifiers Market is experiencing robust growth driven by technological advancements and increasing health awareness.

    • Technological advancements in UV air purification systems are enhancing efficiency and effectiveness.
    • The North American market remains the largest, while the Asia-Pacific region is emerging as the fastest-growing market.
    • Fixed UV air purifiers dominate the market, whereas portable units are witnessing rapid growth due to consumer preferences.
    • Rising air quality concerns and increased consumer spending on health products are key drivers propelling market expansion.

    Market Size & Forecast

    2024 Market Size 1.912 (USD Billion)
    2035 Market Size 10.56 (USD Billion)
    CAGR (2025 - 2035) 16.8%
    Largest Regional Market Share in 2024 Asia Pacific

    Major Players

    <p>Honeywell (US), Philips (NL), Sharp (JP), LG Electronics (KR), Samsung (KR), Blueair (SE), Dyson (GB), Molekule (US), Air Oasis (US)</p>

    Market Trends

    The UV Air Purifiers Market is currently experiencing a notable transformation, driven by increasing awareness regarding indoor air quality and its implications for health. Consumers are becoming more conscious of the pollutants present in their environments, which has led to a growing demand for effective air purification solutions. This trend is further fueled by advancements in technology, enabling the development of more efficient and user-friendly UV air purifiers. Manufacturers are focusing on integrating smart features, such as app connectivity and real-time monitoring, to enhance user experience and engagement. Moreover, the market is witnessing a shift towards eco-friendly products, as consumers seek sustainable options that minimize environmental impact. This inclination towards sustainability is prompting companies to innovate and create UV air purifiers that utilize energy-efficient technologies and recyclable materials. As a result, the UV Air Purifiers Market is poised for continued growth, with an emphasis on health, technology, and sustainability shaping its future trajectory.

    Technological Advancements

    The UV Air Purifiers Market is seeing rapid technological innovations that enhance purification efficiency. New features, such as smart sensors and automated controls, are becoming commonplace, allowing users to monitor air quality in real-time. These advancements not only improve functionality but also cater to the growing demand for convenience in home appliances.

    Sustainability Focus

    There is a marked trend towards sustainability within the UV Air Purifiers Market. Consumers are increasingly prioritizing eco-friendly products that reduce energy consumption and utilize recyclable materials. This shift is encouraging manufacturers to adopt greener practices and develop products that align with environmental values.

    Health Awareness

    Heightened awareness of health issues related to air quality is significantly influencing the UV Air Purifiers Market. As individuals become more informed about the effects of indoor pollutants, the demand for effective air purification solutions is rising. This trend is likely to drive market growth as consumers seek products that promote better health outcomes.

    UV Air Purifiers Market Market Drivers

    Technological Innovations

    Technological advancements play a crucial role in shaping the UV Air Purifiers Market. Innovations in UV-C light technology have enhanced the efficiency and effectiveness of air purifiers. Newer models are equipped with smart features, such as real-time air quality monitoring and automated operation, which appeal to tech-savvy consumers. The integration of IoT capabilities allows users to control devices remotely, further driving market growth. According to recent data, the introduction of advanced filtration systems in UV air purifiers has led to a significant increase in their adoption rates. As manufacturers continue to invest in research and development, the market is expected to witness a surge in innovative products that cater to diverse consumer needs.

    Rising Air Quality Concerns

    The increasing awareness regarding air quality issues is a primary driver for the UV Air Purifiers Market. As urbanization continues to rise, many regions experience deteriorating air quality, leading to health complications. Reports indicate that air pollution contributes to millions of premature deaths annually, prompting consumers to seek effective solutions. UV air purifiers, known for their ability to eliminate airborne pathogens and pollutants, are gaining traction. The market is projected to grow as individuals and businesses prioritize clean air environments, with a notable increase in demand for residential and commercial air purification systems. This trend is likely to continue as more people recognize the importance of maintaining healthy indoor air quality.

    Regulatory Support and Standards

    Regulatory frameworks and standards are increasingly influencing the UV Air Purifiers Market. Governments and health organizations are establishing guidelines to improve indoor air quality, which encourages the adoption of air purification technologies. For instance, certain regions have implemented regulations that mandate the use of air purifiers in public spaces, thereby boosting market demand. Additionally, certifications from recognized bodies enhance consumer trust in UV air purifiers, making them more appealing. The market is likely to benefit from ongoing regulatory support, as it aligns with public health initiatives aimed at reducing airborne diseases and improving overall well-being. This trend suggests a favorable environment for market expansion.

    Growing Awareness of Indoor Pollution Sources

    The growing awareness of indoor pollution sources is a significant driver for the UV Air Purifiers Market. Many consumers are becoming increasingly informed about the various pollutants present in their homes, such as dust, mold, and volatile organic compounds. This awareness is prompting individuals to seek effective solutions to mitigate these risks. UV air purifiers are recognized for their ability to neutralize harmful microorganisms and improve overall air quality. As educational campaigns and information dissemination continue to rise, the market is expected to expand, with more consumers opting for air purification systems to create healthier living spaces. This trend indicates a shift towards proactive health management in residential and commercial settings.

    Increased Consumer Spending on Health Products

    The trend of increased consumer spending on health-related products significantly impacts the UV Air Purifiers Market. As individuals become more health-conscious, they are willing to invest in products that promote well-being, including air purifiers. Market data indicates that the health and wellness sector has seen substantial growth, with consumers prioritizing products that enhance their living environments. This shift in consumer behavior is likely to drive demand for UV air purifiers, as they are perceived as essential tools for maintaining a healthy indoor atmosphere. The willingness to spend on premium air purification solutions suggests a robust market potential, particularly among affluent consumers seeking high-quality products.

    Market Segment Insights

    By Mounting Type: Fixed (Largest) vs. Portable (Fastest-Growing)

    <p>In the UV Air Purifiers market, the mounting type segment is predominantly driven by fixed units, which hold the largest share. These fixed units are often installed in homes and commercial buildings, providing a robust solution for continuous air purification. Portable units, while representing a smaller segment, are gaining traction due to their convenience and flexibility, allowing users to easily move the purifiers from one room to another. As consumer preferences shift towards adaptable solutions, the portable segment is growing rapidly.</p>

    <p>Mounting Type: Fixed (Dominant) vs. Portable (Emerging)</p>

    <p>Fixed UV air purifiers dominate the market, recognized for their durability and effectiveness in providing consistent air quality. They are typically installed in specific locations, catering to larger spaces and offering higher purification rates over time. In contrast, portable UV air purifiers are becoming increasingly popular, particularly among consumers seeking mobile solutions. Their compact design and ease of use appeal to a diverse customer base, including renters and those in smaller living spaces. As technology advances, the features of portable units are enhancing, positioning them as a legitimate alternative to fixed solutions.</p>

    By Power: Less than 70 (Largest) vs. More than 140 (Fastest-Growing)

    <p>In the UV air purifiers market, power segments play a crucial role in shaping consumer preferences and choices. The segment of UV air purifiers with power less than 70 watts stands out as the largest, leveraging its energy efficiency to attract environmentally-conscious consumers. This segment constitutes a significant portion of the overall market, primarily due to its affordability and effectiveness in smaller spaces, such as homes and personal offices. On the other hand, the 'More than 140' watts category is emerging as the fastest-growing segment, driven by heightened demand for powerful and effective air purification solutions in commercial and industrial applications. While the lower power segment (less than 70 watts) is known for its accessibility and convenience, the higher power segment (more than 140 watts) appeals to businesses seeking robust air purification systems capable of handling larger volumes of air. Factors such as increasing awareness about air quality issues, alongside advancements in UV purification technology, are propelling growth in this higher power segment. The expansion of commercial infrastructures and health regulations focusing on air quality further bolster the demand for high-capacity UV air purifiers, ensuring their position as a key player in the evolving market landscape.</p>

    <p>Power: Less than 70 (Dominant) vs. More than 140 (Emerging)</p>

    <p>The 'Less than 70' watts segment is characterized by its dominance in the UV air purifiers market, appealing primarily to residential consumers and small businesses. This category offers a cost-effective and energy-efficient solution, making it an attractive choice for those looking to improve indoor air quality without incurring high operational costs. These purifiers are ideal for smaller spaces, providing adequate air purification while maintaining low energy consumption. In contrast, the 'More than 140' watts segment is emerging rapidly as a preferred choice for larger commercial applications. These powerful units are capable of treating high capacities of air, ensuring thorough purification in expansive environments. As the demand for enhanced air quality in larger establishments grows, this segment's innovation in UV technology positions it for promising growth in the coming years.</p>

    By Air Flow: 0.7-1.4 m3/sec (Largest) vs. Less than 0.7 m3/sec (Fastest-Growing)

    <p>In the UV air purifiers market, the air flow segment is shaped by diverse categories: 'Less than 0.7 m3/sec', '0.7-1.4 m3/sec', '1.4-2.0 m3/sec', and 'More than 2.0 m3/sec'. Among them, the '0.7-1.4 m3/sec' range holds the largest market share, catering mainly to residential and small commercial applications that require a balanced performance in purification. The 'Less than 0.7 m3/sec' segment, while smaller in share, is quickly gaining traction due to increasing demand for compact, efficient units suitable for smaller spaces.</p>

    <p>0.7-1.4 m3/sec (Dominant) vs. More than 2.0 m3/sec (Emerging)</p>

    <p>The '0.7-1.4 m3/sec' segment stands out as a dominant player in the UV air purifiers market, offering a balance between airflow rate and effective filtration, making it ideal for a wide range of applications from residential spaces to small commercial areas. Consumers favor this category for its efficiency and effectiveness in ensuring air quality without excessive energy consumption. In contrast, the 'More than 2.0 m3/sec' segment is emerging, appealing to larger establishments such as hospitals and large offices. This segment is characterized by high-capacity units that provide rapid air turnover rates, essential for environments requiring stringent air quality standards, driving its growth.</p>

    By End Use: Residential (Largest) vs. Commercial (Fastest-Growing)

    <p>The UV Air Purifiers Market is significantly influenced by its end-user segments: residential, commercial, and industrial. Among these, the residential segment holds the largest share, driven by increasing health awareness and the need for cleaner indoor air environments. Homeowners are increasingly investing in UV air purifiers as a proactive measure against airborne pathogens and allergens, leading to a substantial market preference for residential units.</p>

    <p>End Use: Residential (Dominant) vs. Commercial (Emerging)</p>

    <p>The residential segment of the UV air purifiers market is characterized by a growing consumer base that prioritizes indoor air quality. Products in this category are designed to be user-friendly and efficient in eliminating harmful bacteria and viruses, catering to health-conscious consumers. In contrast, the commercial segment is emerging rapidly, mainly in response to stricter air quality regulations in workplaces. Businesses are adopting UV purifiers to ensure employee safety and better air management, leading to innovations tailored for higher efficiency and scalability in commercial settings.</p>

    Get more detailed insights about UV Air Purifiers Market Research Report - Global Forecast till 2035

    Regional Insights

    North America : Market Leader in Innovation

    North America is the largest market for UV air purifiers, holding approximately 40% of the global market share. The region's growth is driven by increasing awareness of air quality issues, rising health concerns, and stringent regulations on indoor air quality. The demand for UV air purifiers is further fueled by technological advancements and the growing trend of smart home devices. Regulatory bodies are promoting cleaner air initiatives, which support market expansion. The competitive landscape in North America is robust, with key players like Honeywell, Molekule, and Air Oasis leading the market. The presence of established brands and innovative startups fosters a dynamic environment. The U.S. is the largest contributor, followed by Canada, which is also witnessing a surge in demand for air purification solutions. The market is characterized by continuous product innovation and a focus on energy efficiency.

    Europe : Regulatory-Driven Market Growth

    Europe is witnessing significant growth in the UV air purifiers market, accounting for approximately 30% of the global share. The region's expansion is largely driven by stringent regulations aimed at improving indoor air quality and reducing pollutants. The European Union's initiatives to promote cleaner air and health-conscious living are key catalysts for market growth. Additionally, increasing consumer awareness regarding health and wellness is propelling demand for effective air purification solutions. Leading countries in this region include Germany, France, and the UK, where the market is highly competitive. Major players such as Philips and Dyson are at the forefront, offering innovative products that meet regulatory standards. The presence of advanced technology and a focus on sustainability further enhance the competitive landscape. The market is characterized by a growing trend towards smart and connected air purification systems, aligning with consumer preferences for convenience and efficiency.

    Asia-Pacific : Emerging Market with High Potential

    Asia-Pacific is an emerging powerhouse in the UV air purifiers market, holding around 25% of the global market share. The region's growth is driven by rapid urbanization, increasing pollution levels, and a rising middle class that prioritizes health and wellness. Countries like China and India are witnessing a surge in demand for air purification solutions, supported by government initiatives aimed at combating air quality issues. The market is expected to grow significantly as awareness of air quality improves. China is the largest market in the region, followed by Japan and India, where local manufacturers are increasingly entering the market. The competitive landscape is evolving, with both international and domestic players vying for market share. Companies like Sharp and LG Electronics are prominent, focusing on innovative technologies and affordability. The region's diverse consumer base and varying regulatory environments present both challenges and opportunities for market players.

    Middle East and Africa : Growing Awareness and Demand

    The Middle East and Africa region is gradually emerging in the UV air purifiers market, holding about 5% of the global share. The growth is primarily driven by increasing awareness of air quality issues and rising health concerns among consumers. Urbanization and industrialization are contributing to higher pollution levels, prompting a demand for effective air purification solutions. Government initiatives aimed at improving public health standards are also supporting market growth in this region. Leading countries include South Africa and the UAE, where the market is characterized by a mix of local and international players. Companies are focusing on educating consumers about the benefits of UV air purifiers. The competitive landscape is still developing, with opportunities for growth as more consumers recognize the importance of clean air. The presence of key players is expected to increase as the market matures and demand rises.

    Key Players and Competitive Insights

    The UV Air Purifiers Market is currently characterized by a dynamic competitive landscape, driven by increasing consumer awareness regarding air quality and the health implications of airborne pollutants. Major players such as Honeywell (US), Philips (NL), and Dyson (GB) are strategically positioned to leverage innovation and technological advancements. Honeywell (US) focuses on enhancing its product line with smart technology integration, while Philips (NL) emphasizes sustainability in its manufacturing processes. Dyson (GB) continues to innovate with its design-centric approach, appealing to a premium market segment. Collectively, these strategies foster a competitive environment that prioritizes technological differentiation and consumer-centric solutions.

    In terms of business tactics, companies are increasingly localizing manufacturing to reduce lead times and optimize supply chains. The market structure appears moderately fragmented, with several key players holding substantial market shares. This fragmentation allows for niche players to emerge, yet the influence of established brands remains significant, as they set benchmarks for quality and innovation. The collective actions of these companies shape a competitive framework that encourages continuous improvement and adaptation to market demands.

    In August 2025, Honeywell (US) announced the launch of a new line of UV air purifiers designed specifically for commercial spaces, which integrates IoT capabilities for real-time air quality monitoring. This strategic move not only expands Honeywell's product offerings but also positions the company as a leader in the commercial air purification sector, catering to businesses increasingly focused on health and safety.

    In September 2025, Philips (NL) unveiled its latest UV air purifier model, which features enhanced energy efficiency and a reduced carbon footprint. This initiative aligns with global sustainability trends and reflects Philips' commitment to environmentally friendly practices. By prioritizing energy efficiency, Philips not only meets regulatory standards but also appeals to eco-conscious consumers, thereby strengthening its market position.

    In October 2025, Dyson (GB) revealed a partnership with a leading technology firm to develop AI-driven air quality monitoring systems integrated into their UV air purifiers. This collaboration signifies a strategic shift towards incorporating advanced technology into air purification solutions, enhancing user experience and operational efficiency. Such innovations are likely to set new industry standards and redefine consumer expectations.

    As of October 2025, the competitive trends in the UV Air Purifiers Market are increasingly influenced by digitalization, sustainability, and the integration of artificial intelligence. Strategic alliances are becoming more prevalent, as companies recognize the value of collaboration in enhancing product offerings and market reach. Looking ahead, competitive differentiation is expected to evolve, with a notable shift from price-based competition to a focus on innovation, technological advancements, and supply chain reliability. This transition underscores the importance of adaptability and forward-thinking strategies in maintaining a competitive edge.

    Key Companies in the UV Air Purifiers Market market include

    Industry Developments

    December 2020: With just one air pass, the VIRUSKILLER air purifier from Rentokil Initial plc has been shown to eradicate 99.99% of viruses, including coronavirus. With just one air pass, the VIRUSKILLER technology eliminates 99.99% of viruses using unique UV reactor chambers and a series of filters.

    .webp

    Future Outlook

    UV Air Purifiers Market Future Outlook

    <p>The UV Air Purifiers Market is projected to grow at a 16.8% CAGR from 2024 to 2035, driven by increasing air quality concerns, technological advancements, and rising health awareness.</p>

    New opportunities lie in:

    • <p>Expansion into smart home integration solutions</p>
    • <p>Development of portable UV air purifiers for travel</p>
    • <p>Partnerships with HVAC manufacturers for integrated systems</p>

    <p>By 2035, the market is expected to be robust, reflecting substantial growth and innovation.</p>

    Market Segmentation

    UV Air Purifiers Market Power Outlook

    • Less than 70
    • 70 – 100
    • 100 – 140
    • More than 140

    UV Air Purifiers Market End Use Outlook

    • Residential
    • Commercial
    • Industrial

    UV Air Purifiers Market Air Flow Outlook

    • Less than 0.7 m3/sec
    • 0.7-1.4 m3/sec
    • 1.4-2.0 m3/sec
    • More than 2.0 m3/sec

    UV Air Purifiers Market Mounting Type Outlook

    • Fixed
    • Portable

    Report Scope

    MARKET SIZE 20241.912(USD Billion)
    MARKET SIZE 20252.233(USD Billion)
    MARKET SIZE 203510.56(USD Billion)
    COMPOUND ANNUAL GROWTH RATE (CAGR)16.8% (2024 - 2035)
    REPORT COVERAGERevenue Forecast, Competitive Landscape, Growth Factors, and Trends
    BASE YEAR2024
    Market Forecast Period2025 - 2035
    Historical Data2019 - 2024
    Market Forecast UnitsUSD Billion
    Key Companies ProfiledMarket analysis in progress
    Segments CoveredMarket segmentation analysis in progress
    Key Market OpportunitiesGrowing consumer awareness of indoor air quality drives demand for UV Air Purifiers Market solutions.
    Key Market DynamicsRising consumer awareness of air quality drives demand for advanced UV air purifiers amid regulatory changes.
    Countries CoveredNorth America, Europe, APAC, South America, MEA

    FAQs

    What is the current market valuation of the UV Air Purifiers Market?

    The UV Air Purifiers Market was valued at 1.912 USD Billion in 2024.

    What is the projected market size for UV Air Purifiers by 2035?

    The market is projected to reach 10.56 USD Billion by 2035.

    What is the expected CAGR for the UV Air Purifiers Market from 2025 to 2035?

    The expected CAGR for the market during the forecast period 2025 - 2035 is 16.8%.

    Which companies are leading the UV Air Purifiers Market?

    Key players in the market include Honeywell, Philips, Sharp, LG Electronics, Samsung, Blueair, Dyson, Molekule, and Air Oasis.

    How does the market segment by mounting type perform?

    In 2024, the fixed segment was valued at 0.912 USD Billion, while the portable segment reached 1.0 USD Billion.

    What are the power segment valuations for UV Air Purifiers?

    The power segment showed valuations of 0.573 USD Billion for less than 70, and 0.501 USD Billion for more than 140.

    1. SECTION I: EXECUTIVE SUMMARY AND KEY HIGHLIGHTS
      1. | 1.1 EXECUTIVE SUMMARY
      2. | | 1.1.1 Market Overview
      3. | | 1.1.2 Key Findings
      4. | | 1.1.3 Market Segmentation
      5. | | 1.1.4 Competitive Landscape
      6. | | 1.1.5 Challenges and Opportunities
      7. | | 1.1.6 Future Outlook
    2. SECTION II: SCOPING, METHODOLOGY AND MARKET STRUCTURE
      1. | 2.1 MARKET INTRODUCTION
      2. | | 2.1.1 Definition
      3. | | 2.1.2 Scope of the study
      4. | | | 2.1.2.1 Research Objective
      5. | | | 2.1.2.2 Assumption
      6. | | | 2.1.2.3 Limitations
      7. | 2.2 RESEARCH METHODOLOGY
      8. | | 2.2.1 Overview
      9. | | 2.2.2 Data Mining
      10. | | 2.2.3 Secondary Research
      11. | | 2.2.4 Primary Research
      12. | | | 2.2.4.1 Primary Interviews and Information Gathering Process
      13. | | | 2.2.4.2 Breakdown of Primary Respondents
      14. | | 2.2.5 Forecasting Model
      15. | | 2.2.6 Market Size Estimation
      16. | | | 2.2.6.1 Bottom-Up Approach
      17. | | | 2.2.6.2 Top-Down Approach
      18. | | 2.2.7 Data Triangulation
      19. | | 2.2.8 Validation
    3. SECTION III: QUALITATIVE ANALYSIS
      1. | 3.1 MARKET DYNAMICS
      2. | | 3.1.1 Overview
      3. | | 3.1.2 Drivers
      4. | | 3.1.3 Restraints
      5. | | 3.1.4 Opportunities
      6. | 3.2 MARKET FACTOR ANALYSIS
      7. | | 3.2.1 Value chain Analysis
      8. | | 3.2.2 Porter's Five Forces Analysis
      9. | | | 3.2.2.1 Bargaining Power of Suppliers
      10. | | | 3.2.2.2 Bargaining Power of Buyers
      11. | | | 3.2.2.3 Threat of New Entrants
      12. | | | 3.2.2.4 Threat of Substitutes
      13. | | | 3.2.2.5 Intensity of Rivalry
      14. | | 3.2.3 COVID-19 Impact Analysis
      15. | | | 3.2.3.1 Market Impact Analysis
      16. | | | 3.2.3.2 Regional Impact
      17. | | | 3.2.3.3 Opportunity and Threat Analysis
    4. SECTION IV: QUANTITATIVE ANALYSIS
      1. | 4.1 Semiconductor & Electronics, BY Mounting Type (USD Billion)
      2. | | 4.1.1 Fixed
      3. | | 4.1.2 Portable
      4. | 4.2 Semiconductor & Electronics, BY Power (USD Billion)
      5. | | 4.2.1 Less than 70
      6. | | 4.2.2 70 – 100
      7. | | 4.2.3 100 – 140
      8. | | 4.2.4 More than 140
      9. | 4.3 Semiconductor & Electronics, BY Air Flow (USD Billion)
      10. | | 4.3.1 Less than 0.7 m3/sec
      11. | | 4.3.2 0.7-1.4 m3/sec
      12. | | 4.3.3 1.4-2.0 m3/sec
      13. | | 4.3.4 More than 2.0 m3/sec
      14. | 4.4 Semiconductor & Electronics, BY End Use (USD Billion)
      15. | | 4.4.1 Residential
      16. | | 4.4.2 Commercial
      17. | | 4.4.3 Industrial
      18. | 4.5 Semiconductor & Electronics, BY Region (USD Billion)
      19. | | 4.5.1 North America
      20. | | | 4.5.1.1 US
      21. | | | 4.5.1.2 Canada
      22. | | 4.5.2 Europe
      23. | | | 4.5.2.1 Germany
      24. | | | 4.5.2.2 UK
      25. | | | 4.5.2.3 France
      26. | | | 4.5.2.4 Russia
      27. | | | 4.5.2.5 Italy
      28. | | | 4.5.2.6 Spain
      29. | | | 4.5.2.7 Rest of Europe
      30. | | 4.5.3 APAC
      31. | | | 4.5.3.1 China
      32. | | | 4.5.3.2 India
      33. | | | 4.5.3.3 Japan
      34. | | | 4.5.3.4 South Korea
      35. | | | 4.5.3.5 Malaysia
      36. | | | 4.5.3.6 Thailand
      37. | | | 4.5.3.7 Indonesia
      38. | | | 4.5.3.8 Rest of APAC
      39. | | 4.5.4 South America
      40. | | | 4.5.4.1 Brazil
      41. | | | 4.5.4.2 Mexico
      42. | | | 4.5.4.3 Argentina
      43. | | | 4.5.4.4 Rest of South America
      44. | | 4.5.5 MEA
      45. | | | 4.5.5.1 GCC Countries
      46. | | | 4.5.5.2 South Africa
      47. | | | 4.5.5.3 Rest of MEA
    5. SECTION V: COMPETITIVE ANALYSIS
      1. | 5.1 Competitive Landscape
      2. | | 5.1.1 Overview
      3. | | 5.1.2 Competitive Analysis
      4. | | 5.1.3 Market share Analysis
      5. | | 5.1.4 Major Growth Strategy in the Semiconductor & Electronics
      6. | | 5.1.5 Competitive Benchmarking
      7. | | 5.1.6 Leading Players in Terms of Number of Developments in the Semiconductor & Electronics
      8. | | 5.1.7 Key developments and growth strategies
      9. | | | 5.1.7.1 New Product Launch/Service Deployment
      10. | | | 5.1.7.2 Merger & Acquisitions
      11. | | | 5.1.7.3 Joint Ventures
      12. | | 5.1.8 Major Players Financial Matrix
      13. | | | 5.1.8.1 Sales and Operating Income
      14. | | | 5.1.8.2 Major Players R&D Expenditure. 2023
      15. | 5.2 Company Profiles
      16. | | 5.2.1 Honeywell (US)
      17. | | | 5.2.1.1 Financial Overview
      18. | | | 5.2.1.2 Products Offered
      19. | | | 5.2.1.3 Key Developments
      20. | | | 5.2.1.4 SWOT Analysis
      21. | | | 5.2.1.5 Key Strategies
      22. | | 5.2.2 Philips (NL)
      23. | | | 5.2.2.1 Financial Overview
      24. | | | 5.2.2.2 Products Offered
      25. | | | 5.2.2.3 Key Developments
      26. | | | 5.2.2.4 SWOT Analysis
      27. | | | 5.2.2.5 Key Strategies
      28. | | 5.2.3 Sharp (JP)
      29. | | | 5.2.3.1 Financial Overview
      30. | | | 5.2.3.2 Products Offered
      31. | | | 5.2.3.3 Key Developments
      32. | | | 5.2.3.4 SWOT Analysis
      33. | | | 5.2.3.5 Key Strategies
      34. | | 5.2.4 LG Electronics (KR)
      35. | | | 5.2.4.1 Financial Overview
      36. | | | 5.2.4.2 Products Offered
      37. | | | 5.2.4.3 Key Developments
      38. | | | 5.2.4.4 SWOT Analysis
      39. | | | 5.2.4.5 Key Strategies
      40. | | 5.2.5 Samsung (KR)
      41. | | | 5.2.5.1 Financial Overview
      42. | | | 5.2.5.2 Products Offered
      43. | | | 5.2.5.3 Key Developments
      44. | | | 5.2.5.4 SWOT Analysis
      45. | | | 5.2.5.5 Key Strategies
      46. | | 5.2.6 Blueair (SE)
      47. | | | 5.2.6.1 Financial Overview
      48. | | | 5.2.6.2 Products Offered
      49. | | | 5.2.6.3 Key Developments
      50. | | | 5.2.6.4 SWOT Analysis
      51. | | | 5.2.6.5 Key Strategies
      52. | | 5.2.7 Dyson (GB)
      53. | | | 5.2.7.1 Financial Overview
      54. | | | 5.2.7.2 Products Offered
      55. | | | 5.2.7.3 Key Developments
      56. | | | 5.2.7.4 SWOT Analysis
      57. | | | 5.2.7.5 Key Strategies
      58. | | 5.2.8 Molekule (US)
      59. | | | 5.2.8.1 Financial Overview
      60. | | | 5.2.8.2 Products Offered
      61. | | | 5.2.8.3 Key Developments
      62. | | | 5.2.8.4 SWOT Analysis
      63. | | | 5.2.8.5 Key Strategies
      64. | | 5.2.9 Air Oasis (US)
      65. | | | 5.2.9.1 Financial Overview
      66. | | | 5.2.9.2 Products Offered
      67. | | | 5.2.9.3 Key Developments
      68. | | | 5.2.9.4 SWOT Analysis
      69. | | | 5.2.9.5 Key Strategies
      70. | 5.3 Appendix
      71. | | 5.3.1 References
      72. | | 5.3.2 Related Reports
    6. LIST OF FIGURES
      1. | 6.1 MARKET SYNOPSIS
      2. | 6.2 NORTH AMERICA MARKET ANALYSIS
      3. | 6.3 US MARKET ANALYSIS BY MOUNTING TYPE
      4. | 6.4 US MARKET ANALYSIS BY POWER
      5. | 6.5 US MARKET ANALYSIS BY AIR FLOW
      6. | 6.6 US MARKET ANALYSIS BY END USE
      7. | 6.7 CANADA MARKET ANALYSIS BY MOUNTING TYPE
      8. | 6.8 CANADA MARKET ANALYSIS BY POWER
      9. | 6.9 CANADA MARKET ANALYSIS BY AIR FLOW
      10. | 6.10 CANADA MARKET ANALYSIS BY END USE
      11. | 6.11 EUROPE MARKET ANALYSIS
      12. | 6.12 GERMANY MARKET ANALYSIS BY MOUNTING TYPE
      13. | 6.13 GERMANY MARKET ANALYSIS BY POWER
      14. | 6.14 GERMANY MARKET ANALYSIS BY AIR FLOW
      15. | 6.15 GERMANY MARKET ANALYSIS BY END USE
      16. | 6.16 UK MARKET ANALYSIS BY MOUNTING TYPE
      17. | 6.17 UK MARKET ANALYSIS BY POWER
      18. | 6.18 UK MARKET ANALYSIS BY AIR FLOW
      19. | 6.19 UK MARKET ANALYSIS BY END USE
      20. | 6.20 FRANCE MARKET ANALYSIS BY MOUNTING TYPE
      21. | 6.21 FRANCE MARKET ANALYSIS BY POWER
      22. | 6.22 FRANCE MARKET ANALYSIS BY AIR FLOW
      23. | 6.23 FRANCE MARKET ANALYSIS BY END USE
      24. | 6.24 RUSSIA MARKET ANALYSIS BY MOUNTING TYPE
      25. | 6.25 RUSSIA MARKET ANALYSIS BY POWER
      26. | 6.26 RUSSIA MARKET ANALYSIS BY AIR FLOW
      27. | 6.27 RUSSIA MARKET ANALYSIS BY END USE
      28. | 6.28 ITALY MARKET ANALYSIS BY MOUNTING TYPE
      29. | 6.29 ITALY MARKET ANALYSIS BY POWER
      30. | 6.30 ITALY MARKET ANALYSIS BY AIR FLOW
      31. | 6.31 ITALY MARKET ANALYSIS BY END USE
      32. | 6.32 SPAIN MARKET ANALYSIS BY MOUNTING TYPE
      33. | 6.33 SPAIN MARKET ANALYSIS BY POWER
      34. | 6.34 SPAIN MARKET ANALYSIS BY AIR FLOW
      35. | 6.35 SPAIN MARKET ANALYSIS BY END USE
      36. | 6.36 REST OF EUROPE MARKET ANALYSIS BY MOUNTING TYPE
      37. | 6.37 REST OF EUROPE MARKET ANALYSIS BY POWER
      38. | 6.38 REST OF EUROPE MARKET ANALYSIS BY AIR FLOW
      39. | 6.39 REST OF EUROPE MARKET ANALYSIS BY END USE
      40. | 6.40 APAC MARKET ANALYSIS
      41. | 6.41 CHINA MARKET ANALYSIS BY MOUNTING TYPE
      42. | 6.42 CHINA MARKET ANALYSIS BY POWER
      43. | 6.43 CHINA MARKET ANALYSIS BY AIR FLOW
      44. | 6.44 CHINA MARKET ANALYSIS BY END USE
      45. | 6.45 INDIA MARKET ANALYSIS BY MOUNTING TYPE
      46. | 6.46 INDIA MARKET ANALYSIS BY POWER
      47. | 6.47 INDIA MARKET ANALYSIS BY AIR FLOW
      48. | 6.48 INDIA MARKET ANALYSIS BY END USE
      49. | 6.49 JAPAN MARKET ANALYSIS BY MOUNTING TYPE
      50. | 6.50 JAPAN MARKET ANALYSIS BY POWER
      51. | 6.51 JAPAN MARKET ANALYSIS BY AIR FLOW
      52. | 6.52 JAPAN MARKET ANALYSIS BY END USE
      53. | 6.53 SOUTH KOREA MARKET ANALYSIS BY MOUNTING TYPE
      54. | 6.54 SOUTH KOREA MARKET ANALYSIS BY POWER
      55. | 6.55 SOUTH KOREA MARKET ANALYSIS BY AIR FLOW
      56. | 6.56 SOUTH KOREA MARKET ANALYSIS BY END USE
      57. | 6.57 MALAYSIA MARKET ANALYSIS BY MOUNTING TYPE
      58. | 6.58 MALAYSIA MARKET ANALYSIS BY POWER
      59. | 6.59 MALAYSIA MARKET ANALYSIS BY AIR FLOW
      60. | 6.60 MALAYSIA MARKET ANALYSIS BY END USE
      61. | 6.61 THAILAND MARKET ANALYSIS BY MOUNTING TYPE
      62. | 6.62 THAILAND MARKET ANALYSIS BY POWER
      63. | 6.63 THAILAND MARKET ANALYSIS BY AIR FLOW
      64. | 6.64 THAILAND MARKET ANALYSIS BY END USE
      65. | 6.65 INDONESIA MARKET ANALYSIS BY MOUNTING TYPE
      66. | 6.66 INDONESIA MARKET ANALYSIS BY POWER
      67. | 6.67 INDONESIA MARKET ANALYSIS BY AIR FLOW
      68. | 6.68 INDONESIA MARKET ANALYSIS BY END USE
      69. | 6.69 REST OF APAC MARKET ANALYSIS BY MOUNTING TYPE
      70. | 6.70 REST OF APAC MARKET ANALYSIS BY POWER
      71. | 6.71 REST OF APAC MARKET ANALYSIS BY AIR FLOW
      72. | 6.72 REST OF APAC MARKET ANALYSIS BY END USE
      73. | 6.73 SOUTH AMERICA MARKET ANALYSIS
      74. | 6.74 BRAZIL MARKET ANALYSIS BY MOUNTING TYPE
      75. | 6.75 BRAZIL MARKET ANALYSIS BY POWER
      76. | 6.76 BRAZIL MARKET ANALYSIS BY AIR FLOW
      77. | 6.77 BRAZIL MARKET ANALYSIS BY END USE
      78. | 6.78 MEXICO MARKET ANALYSIS BY MOUNTING TYPE
      79. | 6.79 MEXICO MARKET ANALYSIS BY POWER
      80. | 6.80 MEXICO MARKET ANALYSIS BY AIR FLOW
      81. | 6.81 MEXICO MARKET ANALYSIS BY END USE
      82. | 6.82 ARGENTINA MARKET ANALYSIS BY MOUNTING TYPE
      83. | 6.83 ARGENTINA MARKET ANALYSIS BY POWER
      84. | 6.84 ARGENTINA MARKET ANALYSIS BY AIR FLOW
      85. | 6.85 ARGENTINA MARKET ANALYSIS BY END USE
      86. | 6.86 REST OF SOUTH AMERICA MARKET ANALYSIS BY MOUNTING TYPE
      87. | 6.87 REST OF SOUTH AMERICA MARKET ANALYSIS BY POWER
      88. | 6.88 REST OF SOUTH AMERICA MARKET ANALYSIS BY AIR FLOW
      89. | 6.89 REST OF SOUTH AMERICA MARKET ANALYSIS BY END USE
      90. | 6.90 MEA MARKET ANALYSIS
      91. | 6.91 GCC COUNTRIES MARKET ANALYSIS BY MOUNTING TYPE
      92. | 6.92 GCC COUNTRIES MARKET ANALYSIS BY POWER
      93. | 6.93 GCC COUNTRIES MARKET ANALYSIS BY AIR FLOW
      94. | 6.94 GCC COUNTRIES MARKET ANALYSIS BY END USE
      95. | 6.95 SOUTH AFRICA MARKET ANALYSIS BY MOUNTING TYPE
      96. | 6.96 SOUTH AFRICA MARKET ANALYSIS BY POWER
      97. | 6.97 SOUTH AFRICA MARKET ANALYSIS BY AIR FLOW
      98. | 6.98 SOUTH AFRICA MARKET ANALYSIS BY END USE
      99. | 6.99 REST OF MEA MARKET ANALYSIS BY MOUNTING TYPE
      100. | 6.100 REST OF MEA MARKET ANALYSIS BY POWER
      101. | 6.101 REST OF MEA MARKET ANALYSIS BY AIR FLOW
      102. | 6.102 REST OF MEA MARKET ANALYSIS BY END USE
      103. | 6.103 KEY BUYING CRITERIA OF SEMICONDUCTOR & ELECTRONICS
      104. | 6.104 RESEARCH PROCESS OF MRFR
      105. | 6.105 DRO ANALYSIS OF SEMICONDUCTOR & ELECTRONICS
      106. | 6.106 DRIVERS IMPACT ANALYSIS: SEMICONDUCTOR & ELECTRONICS
      107. | 6.107 RESTRAINTS IMPACT ANALYSIS: SEMICONDUCTOR & ELECTRONICS
      108. | 6.108 SUPPLY / VALUE CHAIN: SEMICONDUCTOR & ELECTRONICS
      109. | 6.109 SEMICONDUCTOR & ELECTRONICS, BY MOUNTING TYPE, 2024 (% SHARE)
      110. | 6.110 SEMICONDUCTOR & ELECTRONICS, BY MOUNTING TYPE, 2024 TO 2035 (USD Billion)
      111. | 6.111 SEMICONDUCTOR & ELECTRONICS, BY POWER, 2024 (% SHARE)
      112. | 6.112 SEMICONDUCTOR & ELECTRONICS, BY POWER, 2024 TO 2035 (USD Billion)
      113. | 6.113 SEMICONDUCTOR & ELECTRONICS, BY AIR FLOW, 2024 (% SHARE)
      114. | 6.114 SEMICONDUCTOR & ELECTRONICS, BY AIR FLOW, 2024 TO 2035 (USD Billion)
      115. | 6.115 SEMICONDUCTOR & ELECTRONICS, BY END USE, 2024 (% SHARE)
      116. | 6.116 SEMICONDUCTOR & ELECTRONICS, BY END USE, 2024 TO 2035 (USD Billion)
      117. | 6.117 BENCHMARKING OF MAJOR COMPETITORS
    7. LIST OF TABLES
      1. | 7.1 LIST OF ASSUMPTIONS
      2. | | 7.1.1
      3. | 7.2 North America MARKET SIZE ESTIMATES; FORECAST
      4. | | 7.2.1 BY MOUNTING TYPE, 2025-2035 (USD Billion)
      5. | | 7.2.2 BY POWER, 2025-2035 (USD Billion)
      6. | | 7.2.3 BY AIR FLOW, 2025-2035 (USD Billion)
      7. | | 7.2.4 BY END USE, 2025-2035 (USD Billion)
      8. | 7.3 US MARKET SIZE ESTIMATES; FORECAST
      9. | | 7.3.1 BY MOUNTING TYPE, 2025-2035 (USD Billion)
      10. | | 7.3.2 BY POWER, 2025-2035 (USD Billion)
      11. | | 7.3.3 BY AIR FLOW, 2025-2035 (USD Billion)
      12. | | 7.3.4 BY END USE, 2025-2035 (USD Billion)
      13. | 7.4 Canada MARKET SIZE ESTIMATES; FORECAST
      14. | | 7.4.1 BY MOUNTING TYPE, 2025-2035 (USD Billion)
      15. | | 7.4.2 BY POWER, 2025-2035 (USD Billion)
      16. | | 7.4.3 BY AIR FLOW, 2025-2035 (USD Billion)
      17. | | 7.4.4 BY END USE, 2025-2035 (USD Billion)
      18. | 7.5 Europe MARKET SIZE ESTIMATES; FORECAST
      19. | | 7.5.1 BY MOUNTING TYPE, 2025-2035 (USD Billion)
      20. | | 7.5.2 BY POWER, 2025-2035 (USD Billion)
      21. | | 7.5.3 BY AIR FLOW, 2025-2035 (USD Billion)
      22. | | 7.5.4 BY END USE, 2025-2035 (USD Billion)
      23. | 7.6 Germany MARKET SIZE ESTIMATES; FORECAST
      24. | | 7.6.1 BY MOUNTING TYPE, 2025-2035 (USD Billion)
      25. | | 7.6.2 BY POWER, 2025-2035 (USD Billion)
      26. | | 7.6.3 BY AIR FLOW, 2025-2035 (USD Billion)
      27. | | 7.6.4 BY END USE, 2025-2035 (USD Billion)
      28. | 7.7 UK MARKET SIZE ESTIMATES; FORECAST
      29. | | 7.7.1 BY MOUNTING TYPE, 2025-2035 (USD Billion)
      30. | | 7.7.2 BY POWER, 2025-2035 (USD Billion)
      31. | | 7.7.3 BY AIR FLOW, 2025-2035 (USD Billion)
      32. | | 7.7.4 BY END USE, 2025-2035 (USD Billion)
      33. | 7.8 France MARKET SIZE ESTIMATES; FORECAST
      34. | | 7.8.1 BY MOUNTING TYPE, 2025-2035 (USD Billion)
      35. | | 7.8.2 BY POWER, 2025-2035 (USD Billion)
      36. | | 7.8.3 BY AIR FLOW, 2025-2035 (USD Billion)
      37. | | 7.8.4 BY END USE, 2025-2035 (USD Billion)
      38. | 7.9 Russia MARKET SIZE ESTIMATES; FORECAST
      39. | | 7.9.1 BY MOUNTING TYPE, 2025-2035 (USD Billion)
      40. | | 7.9.2 BY POWER, 2025-2035 (USD Billion)
      41. | | 7.9.3 BY AIR FLOW, 2025-2035 (USD Billion)
      42. | | 7.9.4 BY END USE, 2025-2035 (USD Billion)
      43. | 7.10 Italy MARKET SIZE ESTIMATES; FORECAST
      44. | | 7.10.1 BY MOUNTING TYPE, 2025-2035 (USD Billion)
      45. | | 7.10.2 BY POWER, 2025-2035 (USD Billion)
      46. | | 7.10.3 BY AIR FLOW, 2025-2035 (USD Billion)
      47. | | 7.10.4 BY END USE, 2025-2035 (USD Billion)
      48. | 7.11 Spain MARKET SIZE ESTIMATES; FORECAST
      49. | | 7.11.1 BY MOUNTING TYPE, 2025-2035 (USD Billion)
      50. | | 7.11.2 BY POWER, 2025-2035 (USD Billion)
      51. | | 7.11.3 BY AIR FLOW, 2025-2035 (USD Billion)
      52. | | 7.11.4 BY END USE, 2025-2035 (USD Billion)
      53. | 7.12 Rest of Europe MARKET SIZE ESTIMATES; FORECAST
      54. | | 7.12.1 BY MOUNTING TYPE, 2025-2035 (USD Billion)
      55. | | 7.12.2 BY POWER, 2025-2035 (USD Billion)
      56. | | 7.12.3 BY AIR FLOW, 2025-2035 (USD Billion)
      57. | | 7.12.4 BY END USE, 2025-2035 (USD Billion)
      58. | 7.13 APAC MARKET SIZE ESTIMATES; FORECAST
      59. | | 7.13.1 BY MOUNTING TYPE, 2025-2035 (USD Billion)
      60. | | 7.13.2 BY POWER, 2025-2035 (USD Billion)
      61. | | 7.13.3 BY AIR FLOW, 2025-2035 (USD Billion)
      62. | | 7.13.4 BY END USE, 2025-2035 (USD Billion)
      63. | 7.14 China MARKET SIZE ESTIMATES; FORECAST
      64. | | 7.14.1 BY MOUNTING TYPE, 2025-2035 (USD Billion)
      65. | | 7.14.2 BY POWER, 2025-2035 (USD Billion)
      66. | | 7.14.3 BY AIR FLOW, 2025-2035 (USD Billion)
      67. | | 7.14.4 BY END USE, 2025-2035 (USD Billion)
      68. | 7.15 India MARKET SIZE ESTIMATES; FORECAST
      69. | | 7.15.1 BY MOUNTING TYPE, 2025-2035 (USD Billion)
      70. | | 7.15.2 BY POWER, 2025-2035 (USD Billion)
      71. | | 7.15.3 BY AIR FLOW, 2025-2035 (USD Billion)
      72. | | 7.15.4 BY END USE, 2025-2035 (USD Billion)
      73. | 7.16 Japan MARKET SIZE ESTIMATES; FORECAST
      74. | | 7.16.1 BY MOUNTING TYPE, 2025-2035 (USD Billion)
      75. | | 7.16.2 BY POWER, 2025-2035 (USD Billion)
      76. | | 7.16.3 BY AIR FLOW, 2025-2035 (USD Billion)
      77. | | 7.16.4 BY END USE, 2025-2035 (USD Billion)
      78. | 7.17 South Korea MARKET SIZE ESTIMATES; FORECAST
      79. | | 7.17.1 BY MOUNTING TYPE, 2025-2035 (USD Billion)
      80. | | 7.17.2 BY POWER, 2025-2035 (USD Billion)
      81. | | 7.17.3 BY AIR FLOW, 2025-2035 (USD Billion)
      82. | | 7.17.4 BY END USE, 2025-2035 (USD Billion)
      83. | 7.18 Malaysia MARKET SIZE ESTIMATES; FORECAST
      84. | | 7.18.1 BY MOUNTING TYPE, 2025-2035 (USD Billion)
      85. | | 7.18.2 BY POWER, 2025-2035 (USD Billion)
      86. | | 7.18.3 BY AIR FLOW, 2025-2035 (USD Billion)
      87. | | 7.18.4 BY END USE, 2025-2035 (USD Billion)
      88. | 7.19 Thailand MARKET SIZE ESTIMATES; FORECAST
      89. | | 7.19.1 BY MOUNTING TYPE, 2025-2035 (USD Billion)
      90. | | 7.19.2 BY POWER, 2025-2035 (USD Billion)
      91. | | 7.19.3 BY AIR FLOW, 2025-2035 (USD Billion)
      92. | | 7.19.4 BY END USE, 2025-2035 (USD Billion)
      93. | 7.20 Indonesia MARKET SIZE ESTIMATES; FORECAST
      94. | | 7.20.1 BY MOUNTING TYPE, 2025-2035 (USD Billion)
      95. | | 7.20.2 BY POWER, 2025-2035 (USD Billion)
      96. | | 7.20.3 BY AIR FLOW, 2025-2035 (USD Billion)
      97. | | 7.20.4 BY END USE, 2025-2035 (USD Billion)
      98. | 7.21 Rest of APAC MARKET SIZE ESTIMATES; FORECAST
      99. | | 7.21.1 BY MOUNTING TYPE, 2025-2035 (USD Billion)
      100. | | 7.21.2 BY POWER, 2025-2035 (USD Billion)
      101. | | 7.21.3 BY AIR FLOW, 2025-2035 (USD Billion)
      102. | | 7.21.4 BY END USE, 2025-2035 (USD Billion)
      103. | 7.22 South America MARKET SIZE ESTIMATES; FORECAST
      104. | | 7.22.1 BY MOUNTING TYPE, 2025-2035 (USD Billion)
      105. | | 7.22.2 BY POWER, 2025-2035 (USD Billion)
      106. | | 7.22.3 BY AIR FLOW, 2025-2035 (USD Billion)
      107. | | 7.22.4 BY END USE, 2025-2035 (USD Billion)
      108. | 7.23 Brazil MARKET SIZE ESTIMATES; FORECAST
      109. | | 7.23.1 BY MOUNTING TYPE, 2025-2035 (USD Billion)
      110. | | 7.23.2 BY POWER, 2025-2035 (USD Billion)
      111. | | 7.23.3 BY AIR FLOW, 2025-2035 (USD Billion)
      112. | | 7.23.4 BY END USE, 2025-2035 (USD Billion)
      113. | 7.24 Mexico MARKET SIZE ESTIMATES; FORECAST
      114. | | 7.24.1 BY MOUNTING TYPE, 2025-2035 (USD Billion)
      115. | | 7.24.2 BY POWER, 2025-2035 (USD Billion)
      116. | | 7.24.3 BY AIR FLOW, 2025-2035 (USD Billion)
      117. | | 7.24.4 BY END USE, 2025-2035 (USD Billion)
      118. | 7.25 Argentina MARKET SIZE ESTIMATES; FORECAST
      119. | | 7.25.1 BY MOUNTING TYPE, 2025-2035 (USD Billion)
      120. | | 7.25.2 BY POWER, 2025-2035 (USD Billion)
      121. | | 7.25.3 BY AIR FLOW, 2025-2035 (USD Billion)
      122. | | 7.25.4 BY END USE, 2025-2035 (USD Billion)
      123. | 7.26 Rest of South America MARKET SIZE ESTIMATES; FORECAST
      124. | | 7.26.1 BY MOUNTING TYPE, 2025-2035 (USD Billion)
      125. | | 7.26.2 BY POWER, 2025-2035 (USD Billion)
      126. | | 7.26.3 BY AIR FLOW, 2025-2035 (USD Billion)
      127. | | 7.26.4 BY END USE, 2025-2035 (USD Billion)
      128. | 7.27 MEA MARKET SIZE ESTIMATES; FORECAST
      129. | | 7.27.1 BY MOUNTING TYPE, 2025-2035 (USD Billion)
      130. | | 7.27.2 BY POWER, 2025-2035 (USD Billion)
      131. | | 7.27.3 BY AIR FLOW, 2025-2035 (USD Billion)
      132. | | 7.27.4 BY END USE, 2025-2035 (USD Billion)
      133. | 7.28 GCC Countries MARKET SIZE ESTIMATES; FORECAST
      134. | | 7.28.1 BY MOUNTING TYPE, 2025-2035 (USD Billion)
      135. | | 7.28.2 BY POWER, 2025-2035 (USD Billion)
      136. | | 7.28.3 BY AIR FLOW, 2025-2035 (USD Billion)
      137. | | 7.28.4 BY END USE, 2025-2035 (USD Billion)
      138. | 7.29 South Africa MARKET SIZE ESTIMATES; FORECAST
      139. | | 7.29.1 BY MOUNTING TYPE, 2025-2035 (USD Billion)
      140. | | 7.29.2 BY POWER, 2025-2035 (USD Billion)
      141. | | 7.29.3 BY AIR FLOW, 2025-2035 (USD Billion)
      142. | | 7.29.4 BY END USE, 2025-2035 (USD Billion)
      143. | 7.30 Rest of MEA MARKET SIZE ESTIMATES; FORECAST
      144. | | 7.30.1 BY MOUNTING TYPE, 2025-2035 (USD Billion)
      145. | | 7.30.2 BY POWER, 2025-2035 (USD Billion)
      146. | | 7.30.3 BY AIR FLOW, 2025-2035 (USD Billion)
      147. | | 7.30.4 BY END USE, 2025-2035 (USD Billion)
      148. | 7.31 PRODUCT LAUNCH/PRODUCT DEVELOPMENT/APPROVAL
      149. | | 7.31.1
      150. | 7.32 ACQUISITION/PARTNERSHIP
      151. | | 7.32.1

    UV Air Purifiers Market Segmentation

    UV Air Purifiers Market Mounting Type Outlook (USD Billion, 2020-2034)

    • Fixed
    • Portable

    UV Air Purifiers Market Power (Watt) Outlook (USD Billion, 2020-2034)

    • Less than 70
    • 70 – 100
    • 100 – 140
    • More than 140

    UV Air Purifiers Market Air Flow Outlook (USD Billion, 2020-2034)

    • Less than 0.7 m3/sec
    • 0.7-1.4 m3/sec
    • 1.4-2.0 m3/sec
    • More than 2.0 m3/sec

    UV Air Purifiers Market End-User Outlook (USD Billion, 2020-2034)

    • Residential
    • Commercial
    • Industrial

    UV Air Purifiers Market Regional Outlook (USD Billion, 2020-2034)

    • North America Outlook (USD Billion, 2020-2034)
      • UV Air Purifiers Market by Cell Type
        • Fixed
        • Portable
      • UV Air Purifiers Market by Power(Watt)
        • Less than 70
        • 70 – 100
        • 100 – 140
        • More than 140
      • UV Air Purifiers Market by Air Flow
        • Less than 0.7 m3/sec
        • 0.7-1.4 m3/sec
        • 1.4-2.0 m3/sec
        • More than 2.0 m3/sec
      • UV Air Purifiers Market by End-User
        • Residential
        • Commercial
        • Industrial
      • US Outlook (USD Billion, 2020-2034)
      • UV Air Purifiers Market by Cell Type
        • Fixed
        • Portable
      • UV Air Purifiers Market by Power(Watt)
        • Less than 70
        • 70 – 100
        • 100 – 140
        • More than 140
      • UV Air Purifiers Market by Air Flow
        • Less than 0.7 m3/sec
        • 0.7-1.4 m3/sec
        • 1.4-2.0 m3/sec
        • More than 2.0 m3/sec
      • UV Air Purifiers Market by End-User
        • Residential
        • Commercial
        • Industrial
      • Canada Outlook (USD Billion, 2020-2034)
      • UV Air Purifiers Market by Cell Type
        • Fixed
        • Portable
      • UV Air Purifiers Market by Power(Watt)
        • Less than 70
        • 70 – 100
        • 100 – 140
        • More than 140
      • UV Air Purifiers Market by Air Flow
        • Less than 0.7 m3/sec
        • 0.7-1.4 m3/sec
        • 1.4-2.0 m3/sec
        • More than 2.0 m3/sec
      • UV Air Purifiers Market by End-User
        • Residential
        • Commercial
        • Industrial
    • Europe Outlook (USD Billion, 2020-2034)
      • UV Air Purifiers Market by Cell Type
        • Fixed
        • Portable
      • UV Air Purifiers Market by Power(Watt)
        • Less than 70
        • 70 – 100
        • 100 – 140
        • More than 140
      • UV Air Purifiers Market by Air Flow
        • Less than 0.7 m3/sec
        • 0.7-1.4 m3/sec
        • 1.4-2.0 m3/sec
        • More than 2.0 m3/sec
      • UV Air Purifiers Market by End-User
        • Residential
        • Commercial
        • Industrial
      • Germany Outlook (USD Billion, 2020-2034)
      • UV Air Purifiers Market by Cell Type
        • Fixed
        • Portable
      • UV Air Purifiers Market by Power(Watt)
        • Less than 70
        • 70 – 100
        • 100 – 140
        • More than 140
      • UV Air Purifiers Market by Air Flow
        • Less than 0.7 m3/sec
        • 0.7-1.4 m3/sec
        • 1.4-2.0 m3/sec
        • More than 2.0 m3/sec
      • UV Air Purifiers Market by End-User
        • Residential
        • Commercial
        • Industrial
      • France Outlook (USD Billion, 2020-2034)
      • UV Air Purifiers Market by Cell Type
        • Fixed
        • Portable
      • UV Air Purifiers Market by Power(Watt)
        • Less than 70
        • 70 – 100
        • 100 – 140
        • More than 140
      • UV Air Purifiers Market by Air Flow
        • Less than 0.7 m3/sec
        • 0.7-1.4 m3/sec
        • 1.4-2.0 m3/sec
        • More than 2.0 m3/sec
      • UV Air Purifiers Market by End-User
        • Residential
        • Commercial
        • Industrial
      • UK Outlook (USD Billion, 2020-2034)
      • UV Air Purifiers Market by Cell Type
        • Fixed
        • Portable
      • UV Air Purifiers Market by Power(Watt)
        • Less than 70
        • 70 – 100
        • 100 – 140
        • More than 140
      • UV Air Purifiers Market by Air Flow
        • Less than 0.7 m3/sec
        • 0.7-1.4 m3/sec
        • 1.4-2.0 m3/sec
        • More than 2.0 m3/sec
      • UV Air Purifiers Market by End-User
        • Residential
        • Commercial
        • Industrial
      • Italy Outlook (USD Billion, 2020-2034)
      • UV Air Purifiers Market by Cell Type
        • Fixed
        • Portable
      • UV Air Purifiers Market by Power(Watt)
        • Less than 70
        • 70 – 100
        • 100 – 140
        • More than 140
      • UV Air Purifiers Market by Air Flow
        • Less than 0.7 m3/sec
        • 0.7-1.4 m3/sec
        • 1.4-2.0 m3/sec
        • More than 2.0 m3/sec
      • UV Air Purifiers Market by End-User
        • Residential
        • Commercial
        • Industrial
      • Spain Outlook (USD Billion, 2020-2034)
      • UV Air Purifiers Market by Cell Type
        • Fixed
        • Portable
      • UV Air Purifiers Market by Power(Watt)
        • Less than 70
        • 70 – 100
        • 100 – 140
        • More than 140
      • UV Air Purifiers Market by Air Flow
        • Less than 0.7 m3/sec
        • 0.7-1.4 m3/sec
        • 1.4-2.0 m3/sec
        • More than 2.0 m3/sec
      • UV Air Purifiers Market by End-User
        • Residential
        • Commercial
        • Industrial
      • Rest Of Europe Outlook (USD Billion, 2020-2034)
      • UV Air Purifiers Market by Cell Type
        • Fixed
        • Portable
      • UV Air Purifiers Market by Power(Watt)
        • Less than 70
        • 70 – 100
        • 100 – 140
        • More than 140
      • UV Air Purifiers Market by Air Flow
        • Less than 0.7 m3/sec
        • 0.7-1.4 m3/sec
        • 1.4-2.0 m3/sec
        • More than 2.0 m3/sec
      • UV Air Purifiers Market by End-User
        • Residential
        • Commercial
        • Industrial
    • Asia-Pacific Outlook (USD Billion, 2020-2034)
      • UV Air Purifiers Market by Cell Type
        • Fixed
        • Portable
      • UV Air Purifiers Market by Power(Watt)
        • Less than 70
        • 70 – 100
        • 100 – 140
        • More than 140
      • UV Air Purifiers Market by Air Flow
        • Less than 0.7 m3/sec
        • 0.7-1.4 m3/sec
        • 1.4-2.0 m3/sec
        • More than 2.0 m3/sec
      • UV Air Purifiers Market by End-User
        • Residential
        • Commercial
        • Industrial
      • China Outlook (USD Billion, 2020-2034)
      • UV Air Purifiers Market by Cell Type
        • Fixed
        • Portable
      • UV Air Purifiers Market by Power(Watt)
        • Less than 70
        • 70 – 100
        • 100 – 140
        • More than 140
      • UV Air Purifiers Market by Air Flow
        • Less than 0.7 m3/sec
        • 0.7-1.4 m3/sec
        • 1.4-2.0 m3/sec
        • More than 2.0 m3/sec
      • UV Air Purifiers Market by End-User
        • Residential
        • Commercial
        • Industrial
      • Japan Outlook (USD Billion, 2020-2034)
      • UV Air Purifiers Market by Cell Type
        • Fixed
        • Portable
      • UV Air Purifiers Market by Power(Watt)
        • Less than 70
        • 70 – 100
        • 100 – 140
        • More than 140
      • UV Air Purifiers Market by Air Flow
        • Less than 0.7 m3/sec
        • 0.7-1.4 m3/sec
        • 1.4-2.0 m3/sec
        • More than 2.0 m3/sec
      • UV Air Purifiers Market by End-User
        • Residential
        • Commercial
        • Industrial
      • India Outlook (USD Billion, 2020-2034)
      • UV Air Purifiers Market by Cell Type
        • Fixed
        • Portable
      • UV Air Purifiers Market by Power(Watt)
        • Less than 70
        • 70 – 100
        • 100 – 140
        • More than 140
      • UV Air Purifiers Market by Air Flow
        • Less than 0.7 m3/sec
        • 0.7-1.4 m3/sec
        • 1.4-2.0 m3/sec
        • More than 2.0 m3/sec
      • UV Air Purifiers Market by End-User
        • Residential
        • Commercial
        • Industrial
      • Australia Outlook (USD Billion, 2020-2034)
      • UV Air Purifiers Market by Cell Type
        • Fixed
        • Portable
      • UV Air Purifiers Market by Power(Watt)
        • Less than 70
        • 70 – 100
        • 100 – 140
        • More than 140
      • UV Air Purifiers Market by Air Flow
        • Less than 0.7 m3/sec
        • 0.7-1.4 m3/sec
        • 1.4-2.0 m3/sec
        • More than 2.0 m3/sec
      • UV Air Purifiers Market by End-User
        • Residential
        • Commercial
        • Industrial
      • Rest of Asia-Pacific Outlook (USD Billion, 2020-2034)
      • UV Air Purifiers Market by Cell Type
        • Fixed
        • Portable
      • UV Air Purifiers Market by Power(Watt)
        • Less than 70
        • 70 – 100
        • 100 – 140
        • More than 140
      • UV Air Purifiers Market by Air Flow
        • Less than 0.7 m3/sec
        • 0.7-1.4 m3/sec
        • 1.4-2.0 m3/sec
        • More than 2.0 m3/sec
      • UV Air Purifiers Market by End-User
        • Residential
        • Commercial
        • Industrial
    • Rest of the World Outlook (USD Billion, 2020-2034)
      • UV Air Purifiers Market by Cell Type
        • Fixed
        • Portable
      • UV Air Purifiers Market by Power(Watt)
        • Less than 70
        • 70 – 100
        • 100 – 140
        • More than 140
      • UV Air Purifiers Market by Air Flow
        • Less than 0.7 m3/sec
        • 0.7-1.4 m3/sec
        • 1.4-2.0 m3/sec
        • More than 2.0 m3/sec
      • UV Air Purifiers Market by End-User
        • Residential
        • Commercial
        • Industrial
      • Middle East Outlook (USD Billion, 2020-2034)
      • UV Air Purifiers Market by Cell Type
        • Fixed
        • Portable
      • UV Air Purifiers Market by Power(Watt)
        • Less than 70
        • 70 – 100
        • 100 – 140
        • More than 140
      • UV Air Purifiers Market by Air Flow
        • Less than 0.7 m3/sec
        • 0.7-1.4 m3/sec
        • 1.4-2.0 m3/sec
        • More than 2.0 m3/sec
      • UV Air Purifiers Market by End-User
        • Residential
        • Commercial
        • Industrial
      • Africa Outlook (USD Billion, 2020-2034)
      • UV Air Purifiers Market by Cell Type
        • Fixed
        • Portable
      • UV Air Purifiers Market by Power(Watt)
        • Less than 70
        • 70 – 100
        • 100 – 140
        • More than 140
      • UV Air Purifiers Market by Air Flow
        • Less than 0.7 m3/sec
        • 0.7-1.4 m3/sec
        • 1.4-2.0 m3/sec
        • More than 2.0 m3/sec
      • UV Air Purifiers Market by End-User
        • Residential
        • Commercial
        • Industrial
      • Latin America Outlook (USD Billion, 2020-2034)
      • UV Air Purifiers Market by Cell Type
        • Fixed
        • Portable
      • UV Air Purifiers Market by Power(Watt)
        • Less than 70
        • 70 – 100
        • 100 – 140
        • More than 140
      • UV Air Purifiers Market by Air Flow
        • Less than 0.7 m3/sec
        • 0.7-1.4 m3/sec
        • 1.4-2.0 m3/sec
        • More than 2.0 m3/sec
      • UV Air Purifiers Market by End-User
        • Residential
        • Commercial
        • Industrial
    Infographic

    Free Sample Request

    Kindly complete the form below to receive a free sample of this Report

    Get Free Sample

    Customer Strories

    “I am very pleased with how market segments have been defined in a relevant way for my purposes (such as "Portable Freezers & refrigerators" and "last-mile"). In general the report is well structured. Thanks very much for your efforts.”

    Victoria Milne

    Founder
    Case Study
    Chemicals and Materials

    Compare Licence

    ×
    Features License Type
    Single User Multiuser License Enterprise User
    Price $4,950 $5,950 $7,250
    Maximum User Access Limit 1 User Upto 10 Users Unrestricted Access Throughout the Organization
    Free Customization
    Direct Access to Analyst
    Deliverable Format
    Platform Access
    Discount on Next Purchase 10% 15% 15%
    Printable Versions